


Another Way to Picture Sea Ice Loss
In mid-September 2012, the National Snow and Ice Data Center (NSIDC) announced that Arctic sea ice had reached a new record minimum — 3.41 million square kilometers (1.32 million square miles). The previous record low came in September 2007 at 4.17 million square kilometers (1.61 million square miles). The 1979–2000 average minimum ice extent was 6.70 million square kilometers (2.59 million square miles).
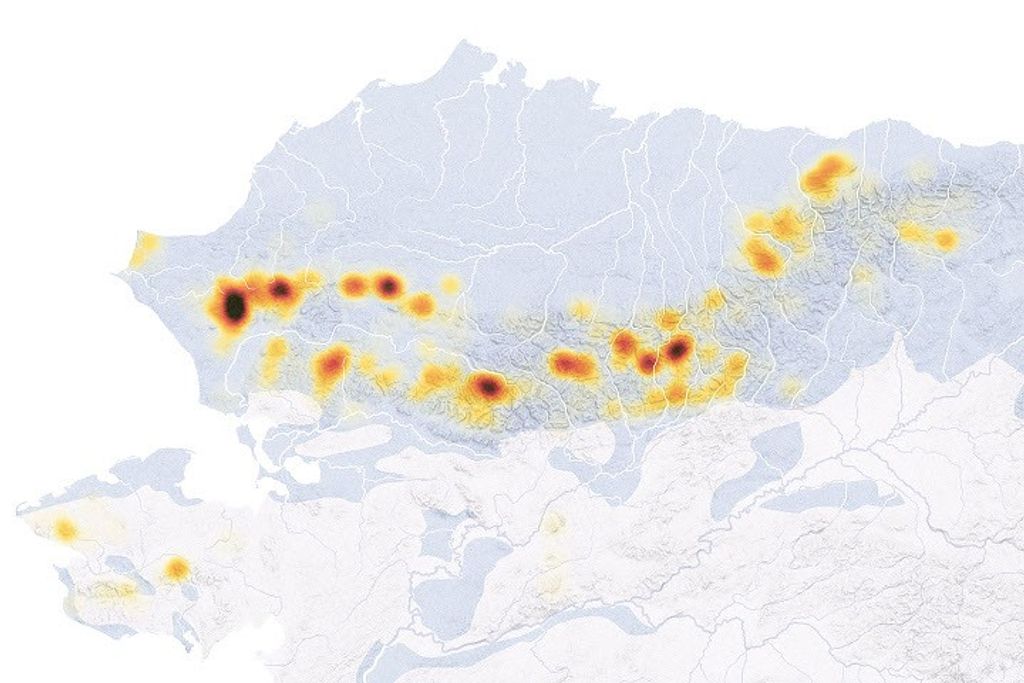
If you are not used to tracking the ice pack at the top of the globe, this may seem like just a string of big numbers. So NSIDC’s Walt Meier offers another way to understand the shrinking ice cap.
In the 1980s, the average extent of sea ice extent in the Arctic was roughly equal to the area of the contiguous United States, minus Washington and Oregon. In September 2007, the sea ice minimum dropped so far below the 1980s average that the area shaded in blue became open water, and the white and turquoise areas would have remained ice-covered. The September 2012 minimum was lower still, such that the Dakotas, Nebraska, and Kansas were also ice free, along with all of the states to the east.
