


A Climate Model for the History Books
Decades or even centuries from now, when enough time has passed for historians to write definitive accounts of global warming and climate change, two names are likely to make it into history books: Syukuro Manabe and Richard Wetherald.
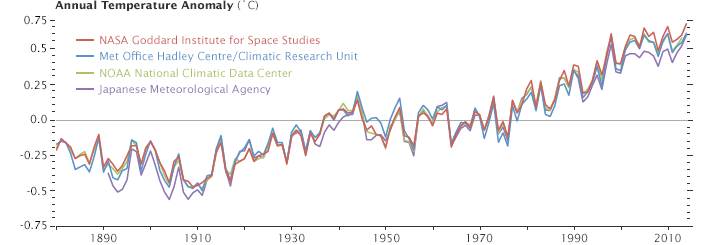
In the late-1960s, these two scientists from the Geophysical Fluid Dynamics Laboratory developed one of the very first climate models. In 1967, they published results showing that global temperatures would increase by 2.0 degrees Celsius (3.6 degrees Fahrenheit) if the carbon dioxide content of the atmosphere doubled.
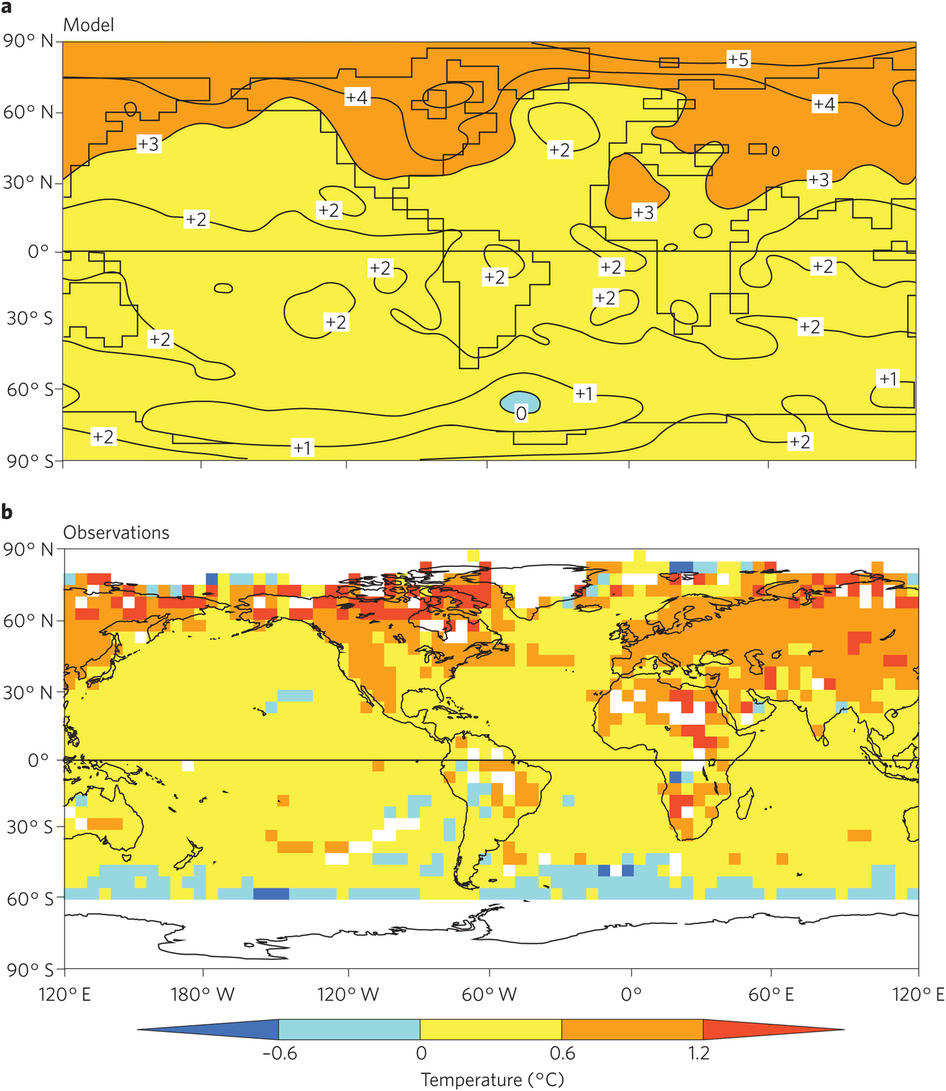
As Ethan Siegel pointed out in Forbes, carbon dioxide content has risen by roughly 50 percent since the pre-industrial era. Observed temperatures, meanwhile, have increased by 1°C (1.8°F). For a pair of scientists working in a time when computer instructions were compiled on printed punch cards and processing was thousands of times slower than today, they created a remarkably accurate model. That is not to say that Manabe claims his 1967 model is perfect. In fact, he is quick to point out that there are some aspects that his and other climate models still get wrong. In an interview with CarbonBrief, he put it this way:
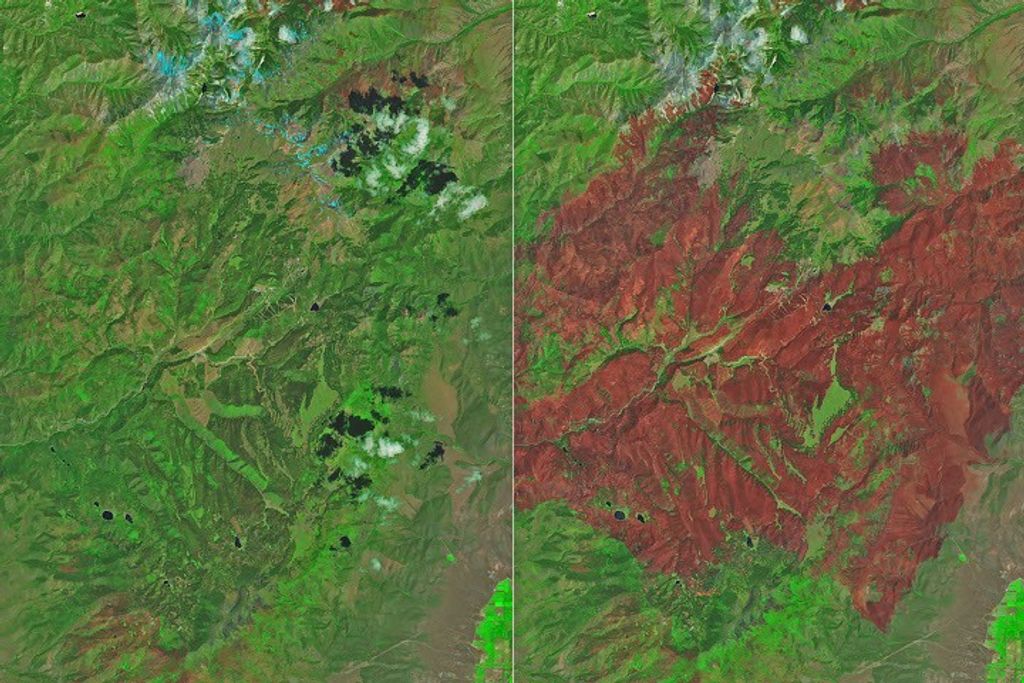
Models have been very effective in predicting climate change, but have not been as effective in predicting its impact on ecosystem[s] and human society. The distinction between the two has not been stated clearly. For this reason, major effort should be made to monitor globally not only climate change, but also its impact on ecosystem[s] through remote sensing from satellites as well as in-situ observation.
There is a great deal of fascinating detail about Manabe and Wetherald’s model and the early history of climate modeling that do not fit into a short blog post. If you want to learn more, this section of Spencer Wirt’s the History of Global Warming is well worth the time. The American Institute of Physics has also posted a Q & A with Manabe that covers his 1967 paper, which is considered one of the most influential in climate science. And in March 2017, Manabe and colleague Ronald Stouffer authored a commentary that was published in Nature Climate Change. The Independent also has a good article about this.