


Landsat 7 – USGS EROS Archive
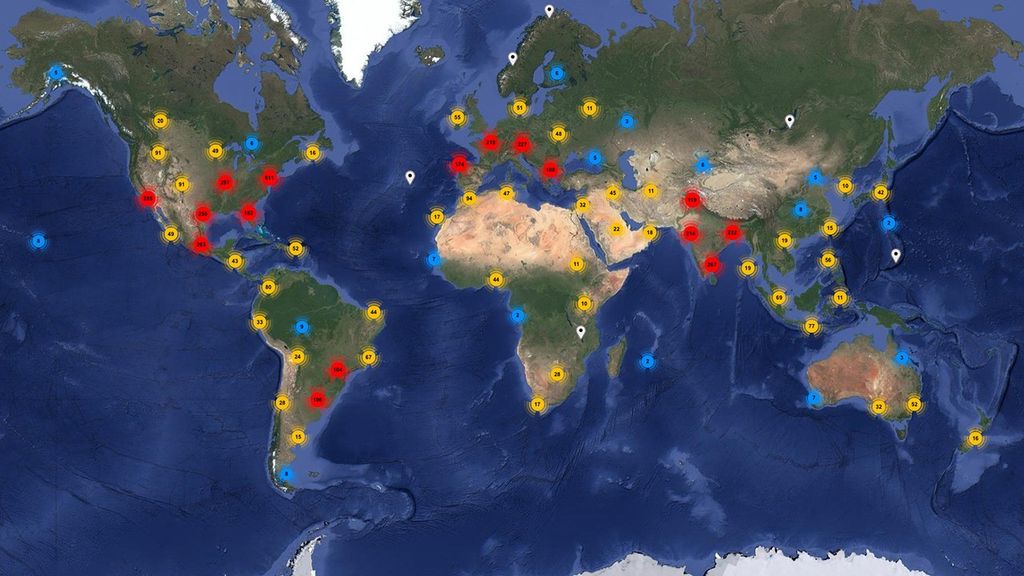
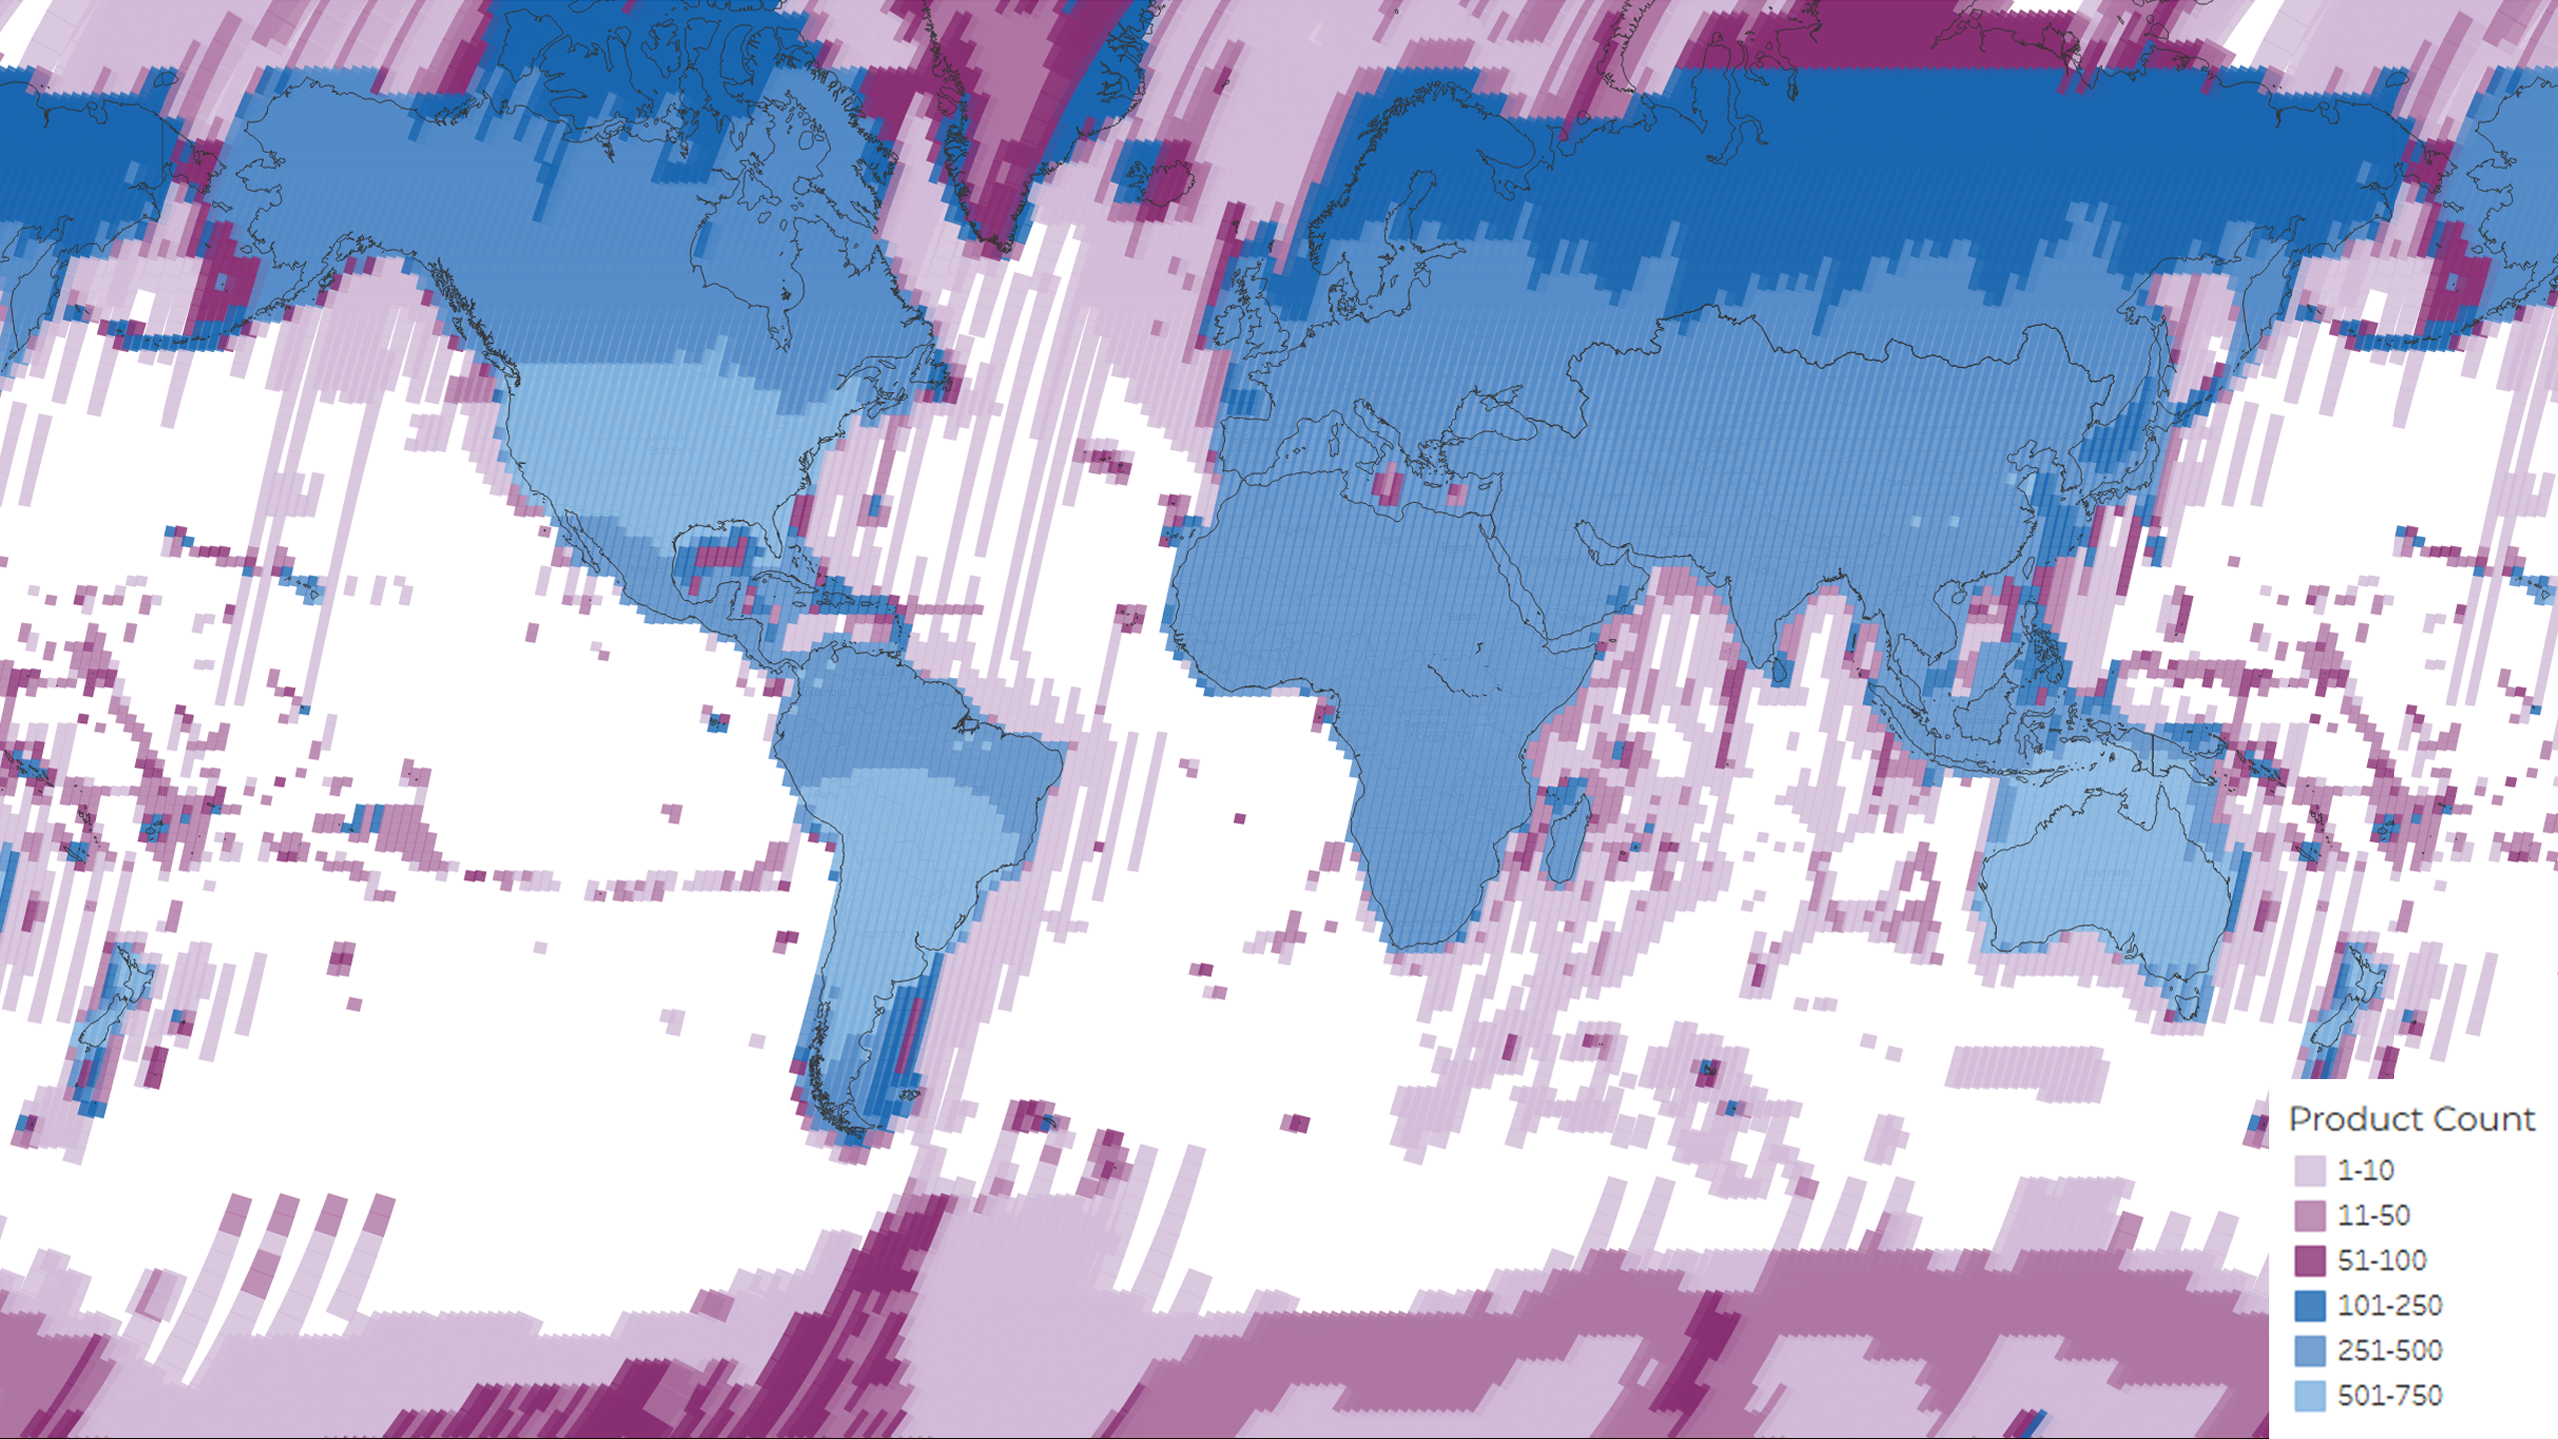
A density map showing the distribution of the total 3,316,494 ETM+ scenes acquired and archived during the lifetime of the Landsat 7 mission. The colors represent the number of products per Path/Row.
Image Credit: USGS
- X
https://science.nasa.gov/image-detail/amf-89a3c872-089f-4c54-befd-767b8183e577/
Image CreditUSGS
Size2558x1439px
