


Landsat Data
The Landsat archive represents the world's longest continuous record of Earth observation data, spanning over five decades of systematic global coverage since 1972.
Overview
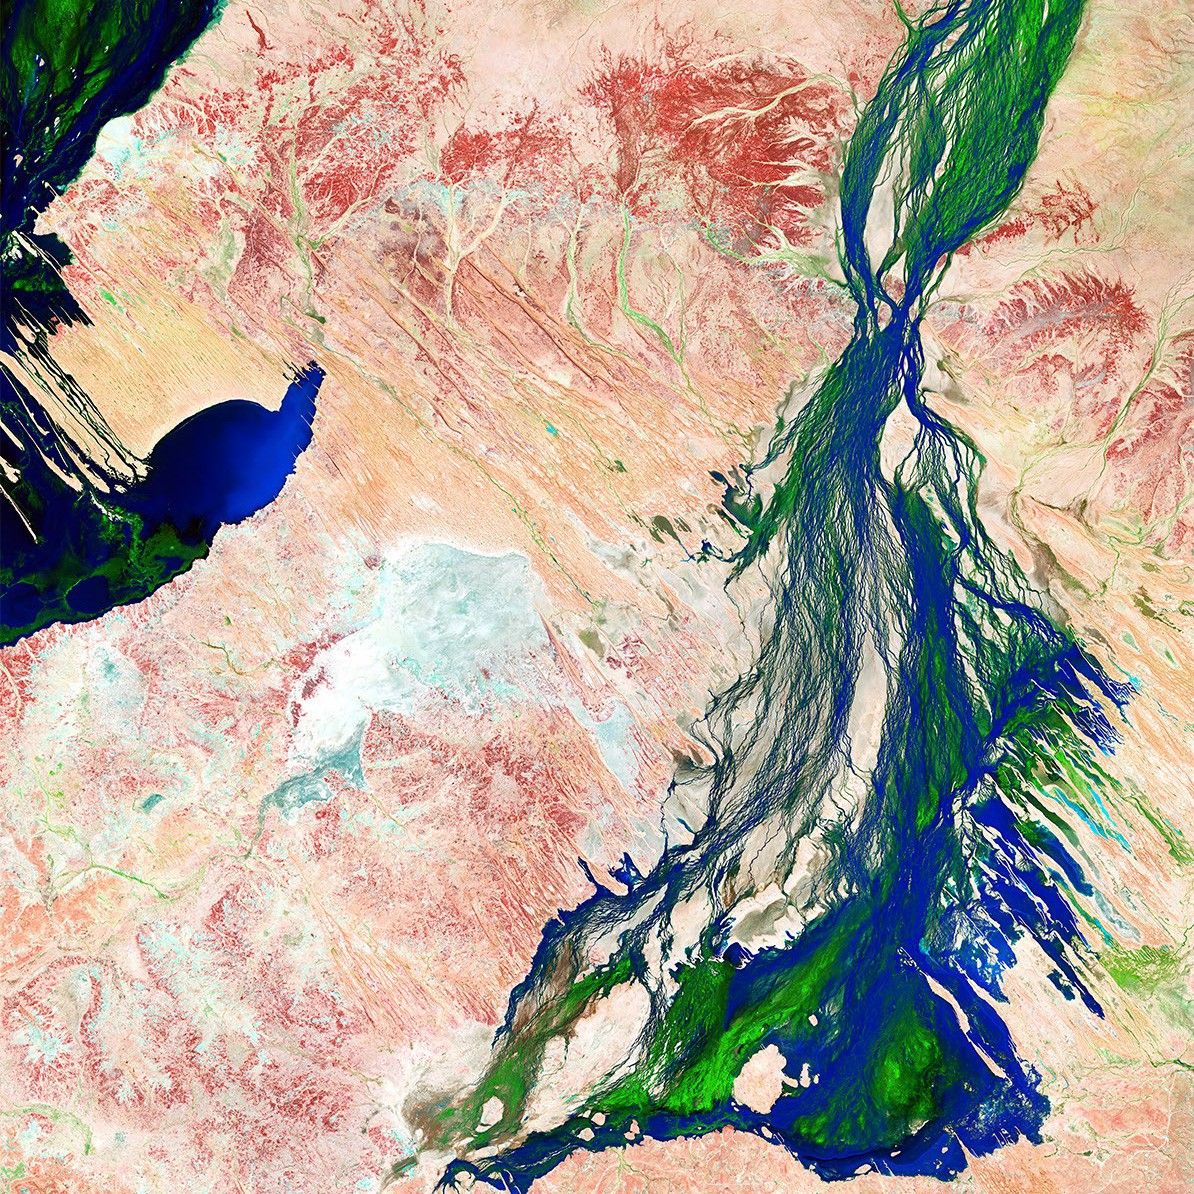
The Landsat program has systematically captured images of Earth's surface, creating the world's longest continuous data record of our planet's environmental changes. This vast digital archive provides the only comprehensive dataset capable of revealing both gradual environmental changes and sudden disturbances across local, regional, and global scales over multiple decades.
How to Access Data
Landsat data and science products are publicly accessible and free of charge. Explore and download these datasets using the following map viewers, data portals, and advanced cloud-computer platforms.
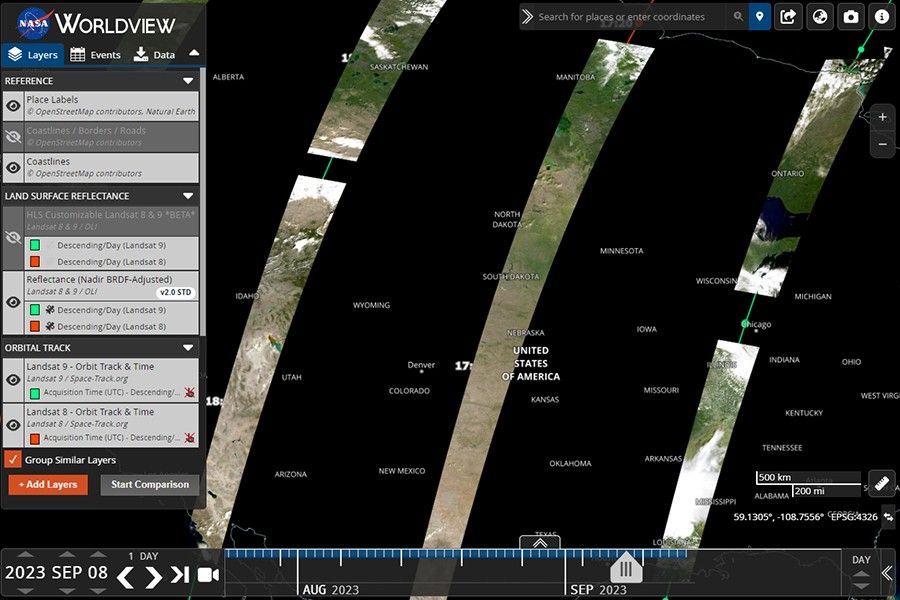
NASA Worldview
Browse, preview, and download full-resolution, global satellite imagery and create animated visualizations.
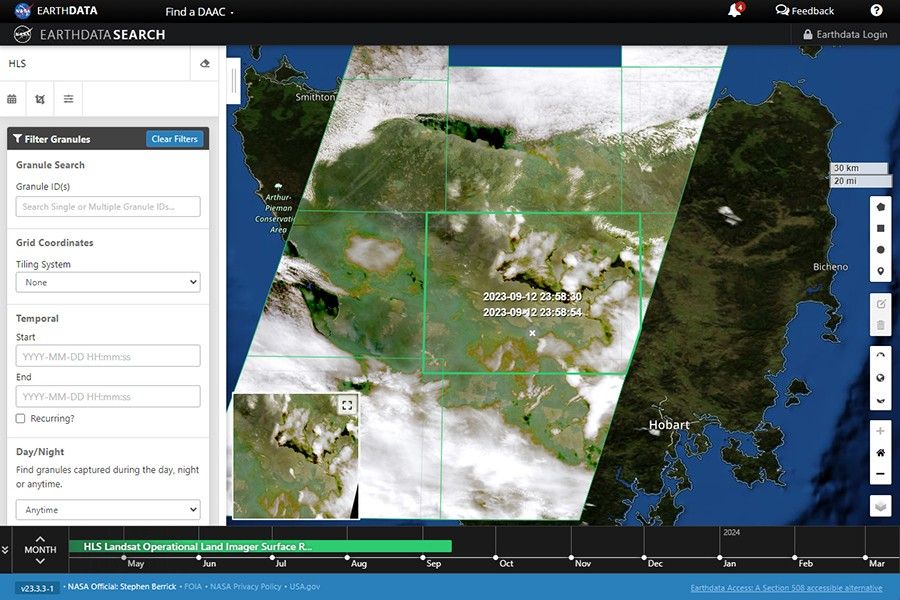
NASA Earthdata Search
Search, filter, view, compare, and download satellite data by keywords, spatial location, and time; access related data resources; and create visualizations.
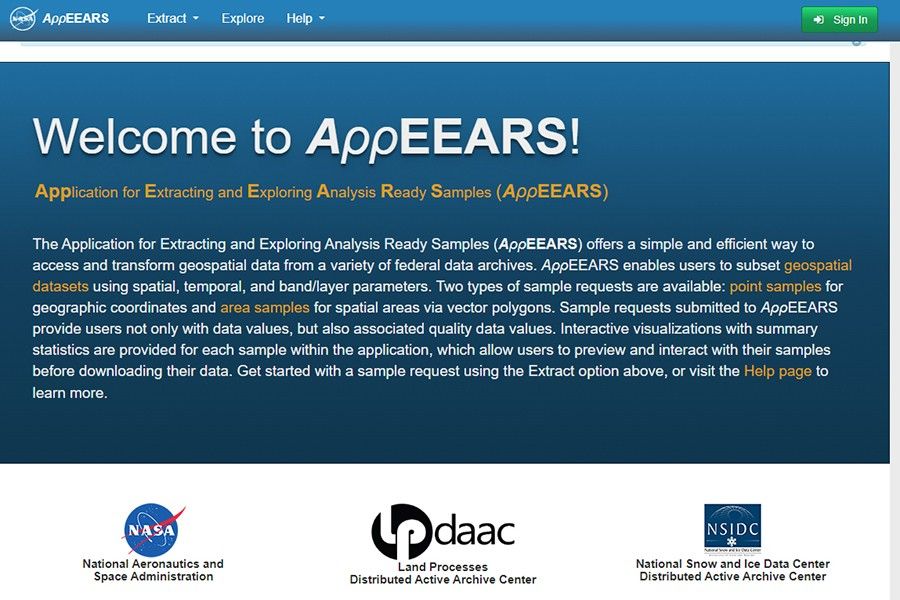
NASA AppEARS
Access, analyze, and visualize geospatial data for specific locations or areas. Create subsets by time period or data layer.
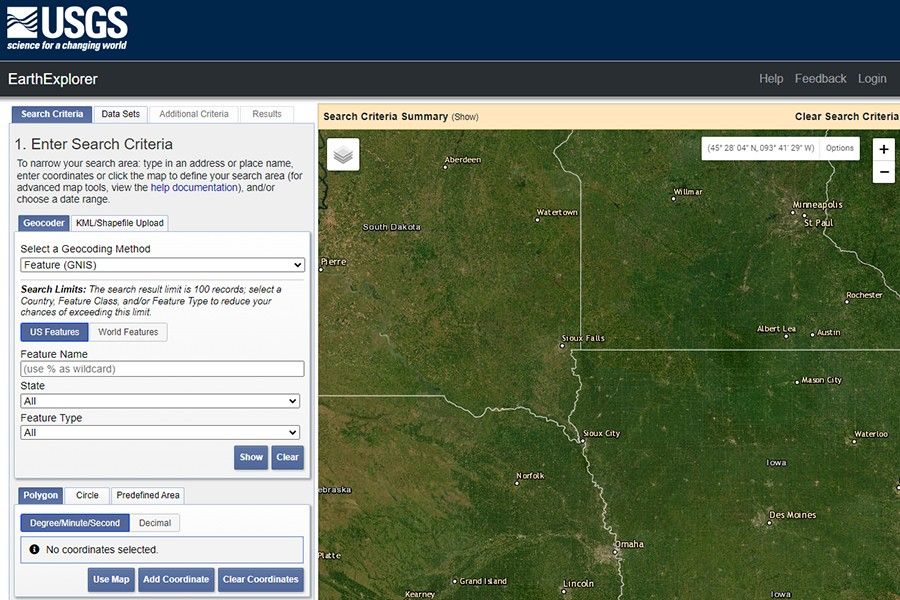
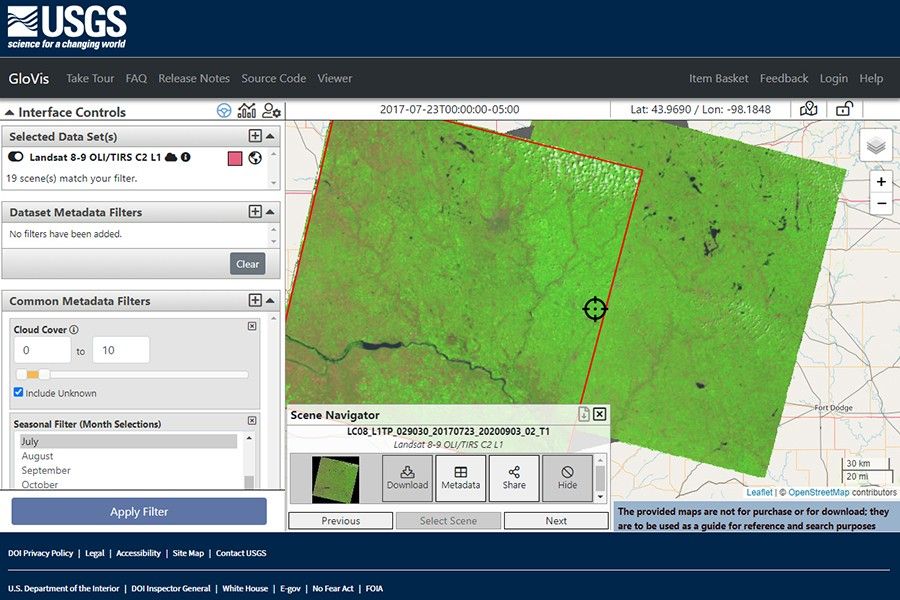
USGS Earth Explorer
Search, filter, and download satellite imagery, aerial photography, and cartographic products.
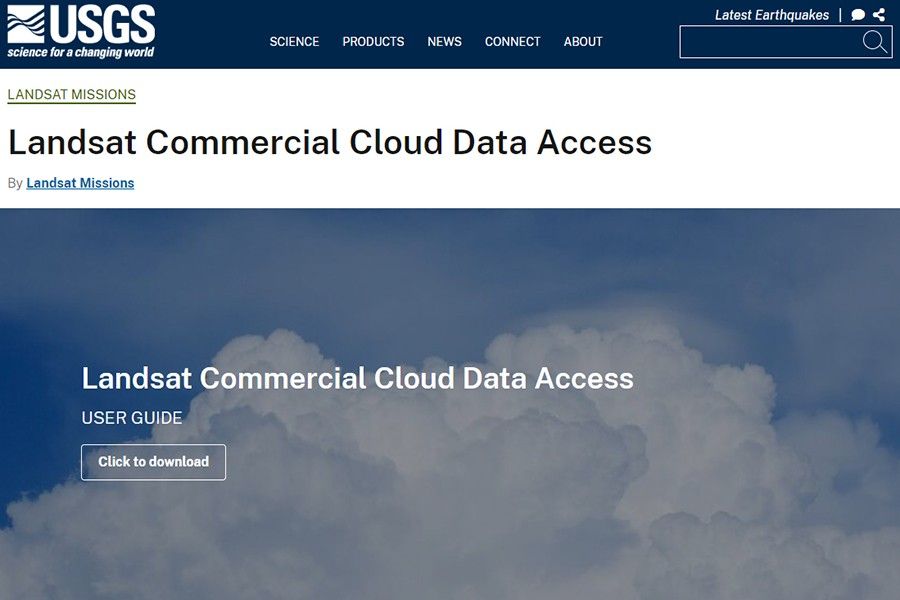
USGS Landsat Commercial Cloud Access
Download, process, and analyze Landsat Collection 2 imagery via Amazon Web Services (AWS).
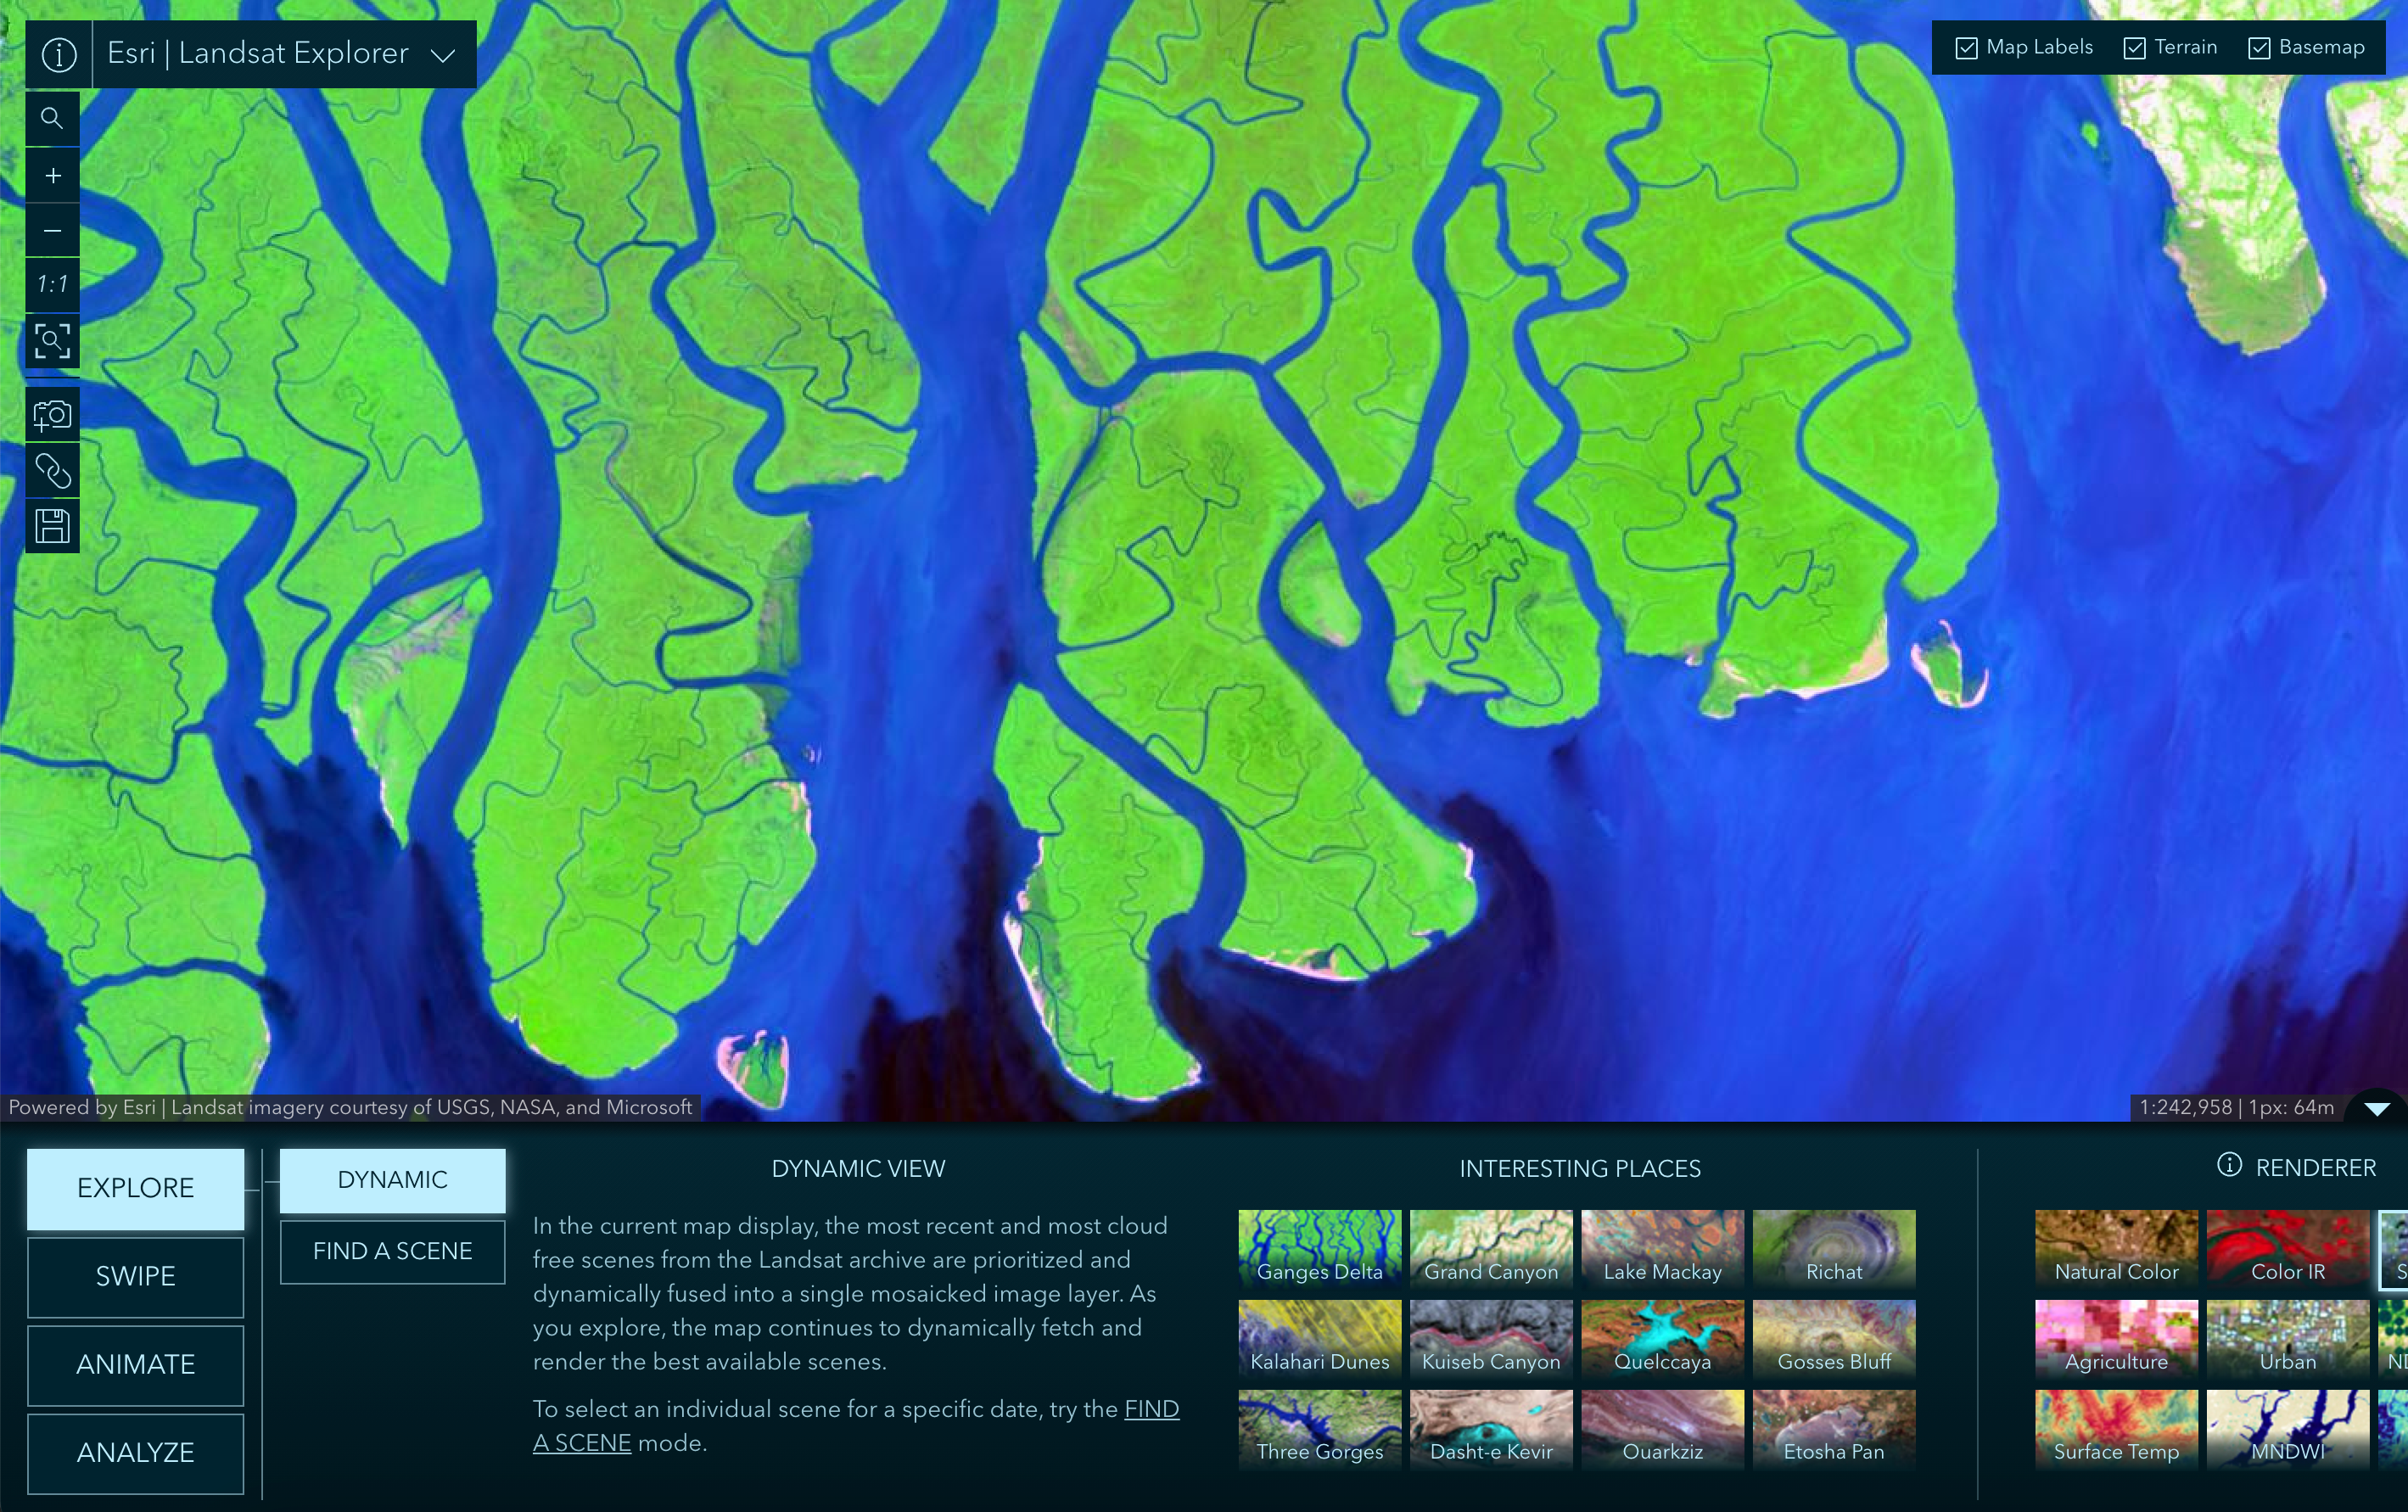
Esri Landsat Explorer
View, explore, and analyze the Landsat data archive through customizable band combinations, spectral indices, temporal filters, and interactive visualization tools.
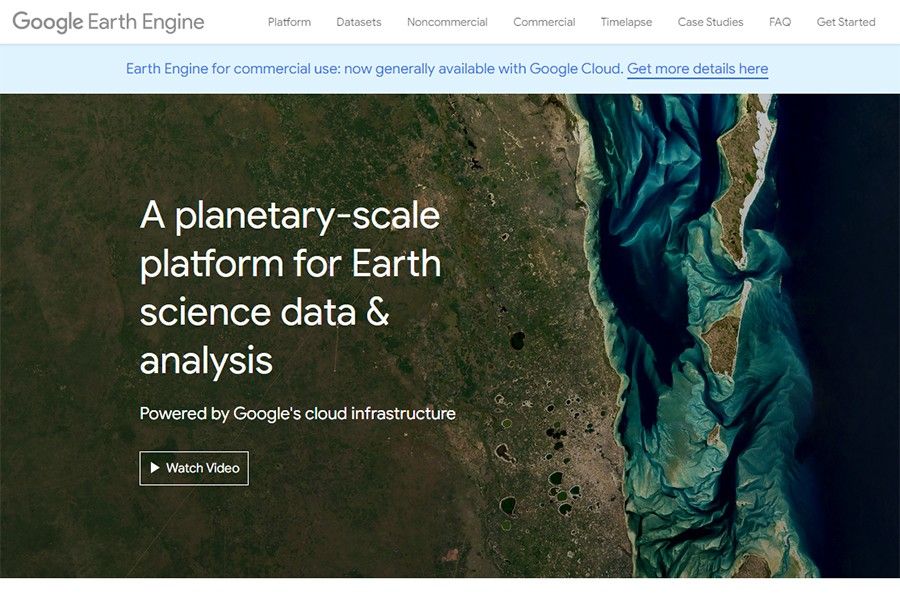
Google Earth Engine
Visualize, analyze, and quantify changes in satellite imagery and geospatial datasets in a script-based environment.
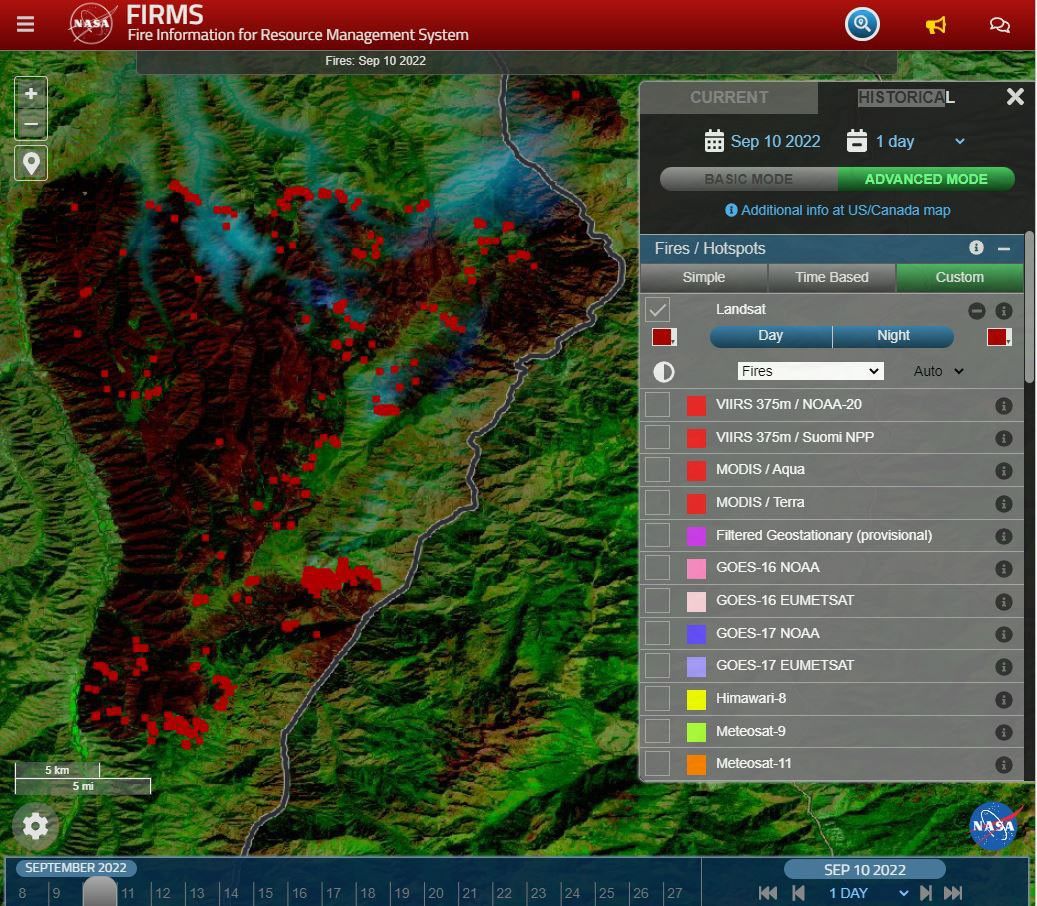
NASA FIRMS
View and download satellite imagery, active fire hotspots, and related products to identify the location, extent, and intensity of wildfire activity.
Learn More About NASA Earth Data

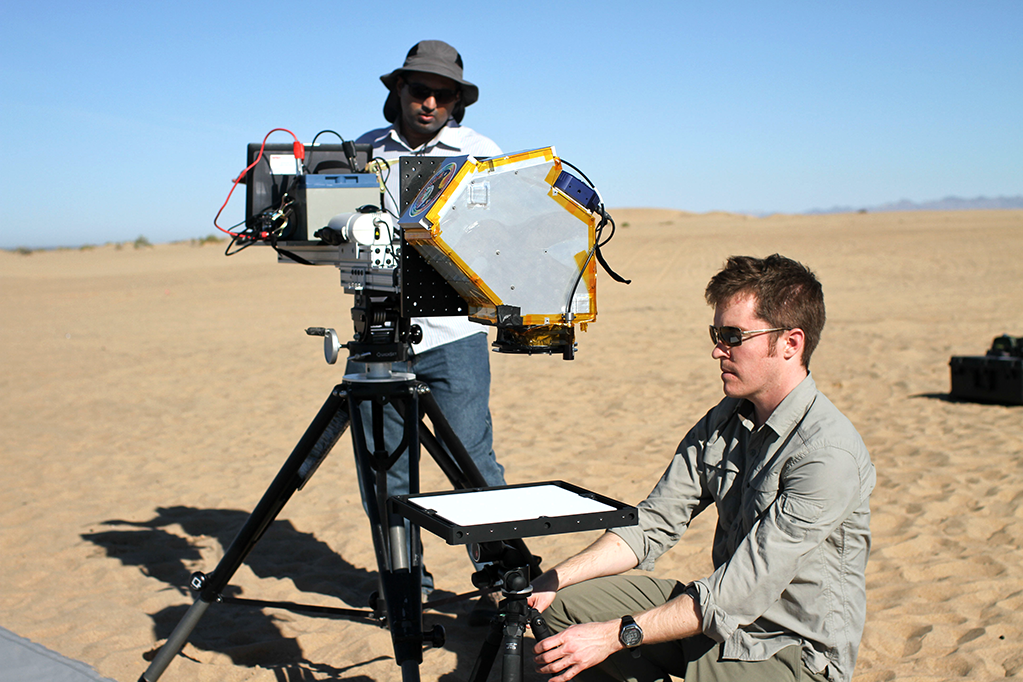
Calibration & Validation
Closely calibrated and validated data are a hallmark of the Landsat Program. For medium-resolution satellite data, Landsat is considered the “gold standard” because of the program’s tradition of rigorous, independently verified calibration that is diligently reported and documented in peer-reviewed literature.
Sensors are characterized pre- and post-launch to describe the sensor’s spectral, radiometric, and spatial accuracy and uniformity. Throughout the mission’s operation, routine onboard calibration and independent verification of those measurements against an external reference source validates that measurements accurately express surface reflectance and temperature measurements.
The scientific integrity of Landsat data stems from these rigorous calibration protocols. Ensuring that the data collected from different time periods and satellites are scientifically accurate and comparable is essential for analyzing change over time, combining Landsat data with other datasets, and for developing Landsat-derived data and science products.
Earth's Time Machine
Comparing data over time transforms static snapshots into dynamic stories of environmental change, revealing patterns and processes invisible in individual observations. Along with retrospective calibration efforts that have enhanced the consistency of historical data, decades of Landsat data can be reliably compared across the entire data record. This historical context provides a baseline essential for analyzing how Earth’s landscapes have changed over time, acting as a time machine of Earth’s land surfaces.
Scientists can measure not just what has changed, but how fast change is occurring. They can identify where forest loss is accelerating, urban expansion is slowing, and how quickly glaciers are retreating. By examining change over annual or decadal time scales, scientists can distinguish seasonal variations, weather anomalies, or the impacts of disasters like wildfires. This information is crucial for understanding the drivers of change and informing management decisions.
From Orbit to AI: Harnessing Machine Learning with Landsat Data
Over the past few years, machine learning techniques have been increasingly used to analyze the vast amount of data collected by the Landsat mission, which has been circling the globe for over 50 years. The data has been used to classify different types of land cover, detect changes to landscapes over time, and map the impact of human activity on the environment.
Learn MoreA Foundational Dataset
Opening the Landsat archive in 2008 fundamentally changed Earth observation science and applications. Previously, only well-funded research institutions and government agencies could afford to use these data. Making this invaluable resource free democratized access, multiplying the societal return on investment of the Landsat program.
The result has been an explosion in scientific publications, innovative applications, and widely-used products that benefit society, including Google Earth Engine's global analysis capabilities, the National Land Cover Database's comprehensive land use mapping, and OpenET's agricultural water use monitoring system.
Data Products
Harmonized Landsat Sentinel-2 (HLS)
A global land surface reflectance dataset that combines imagery from NASA/USGS Landsat and European Space Agency (ESA) Sentinel-2 satellites.
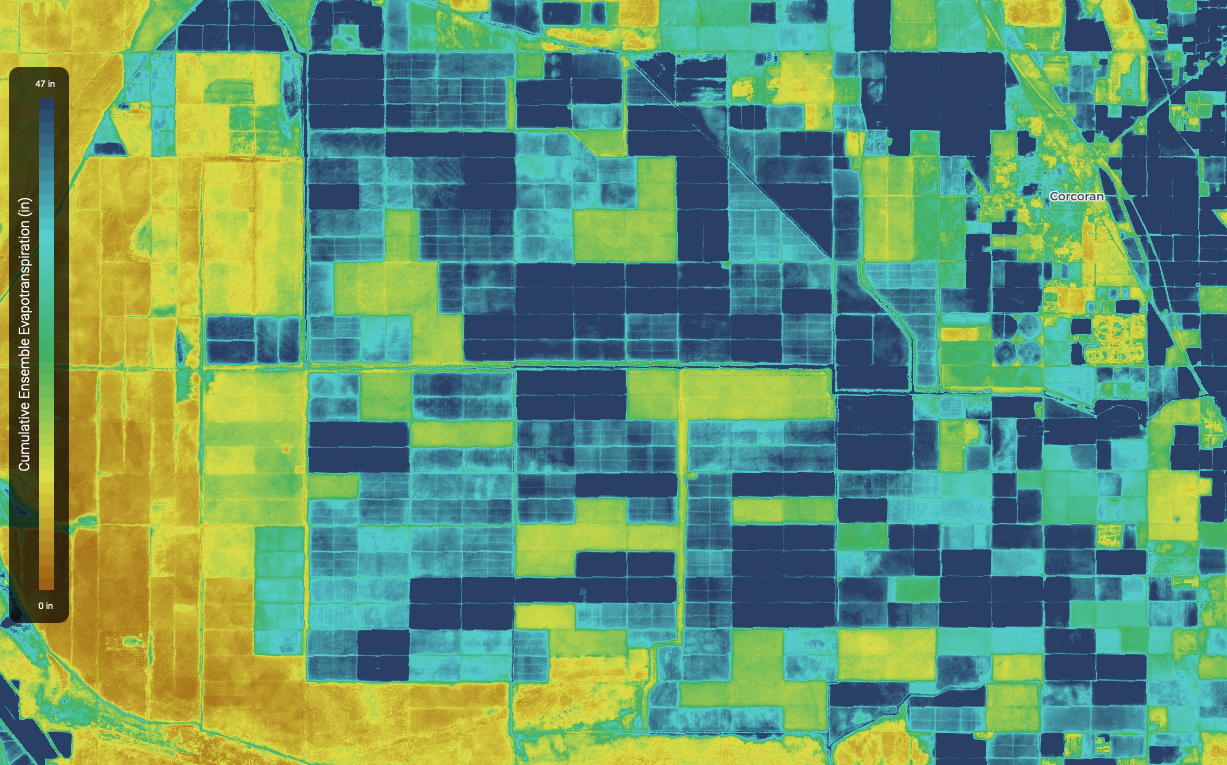
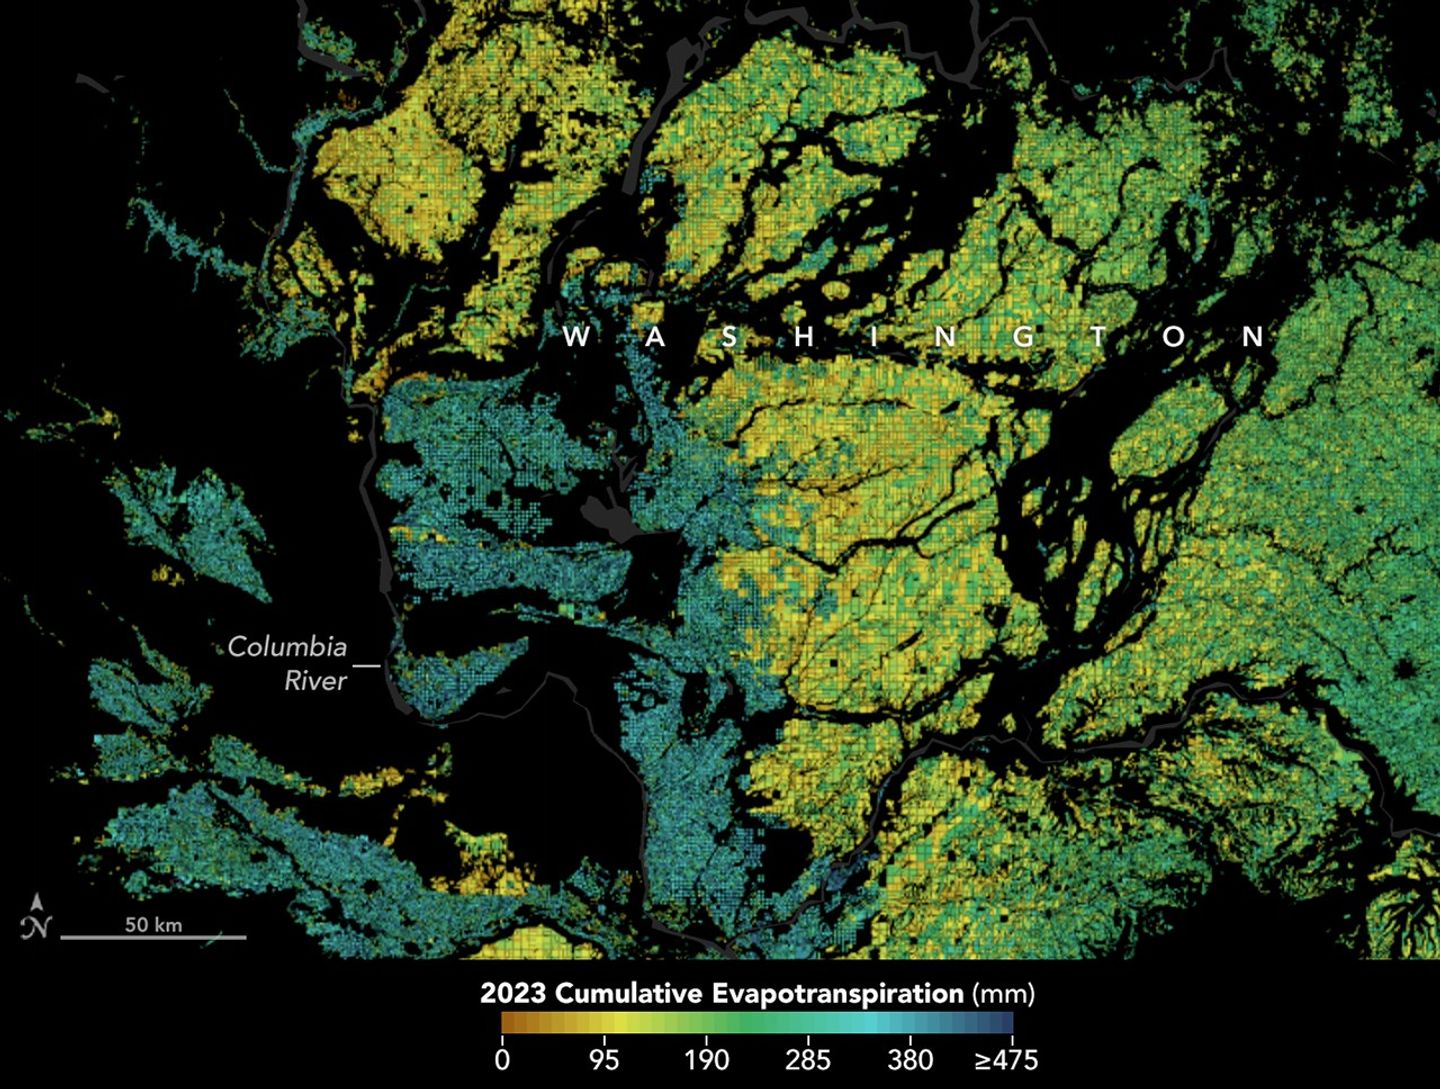
OpenET
Landsat-derived evapotranspiration (ET) data at the individual field level for water management across the western U.S.
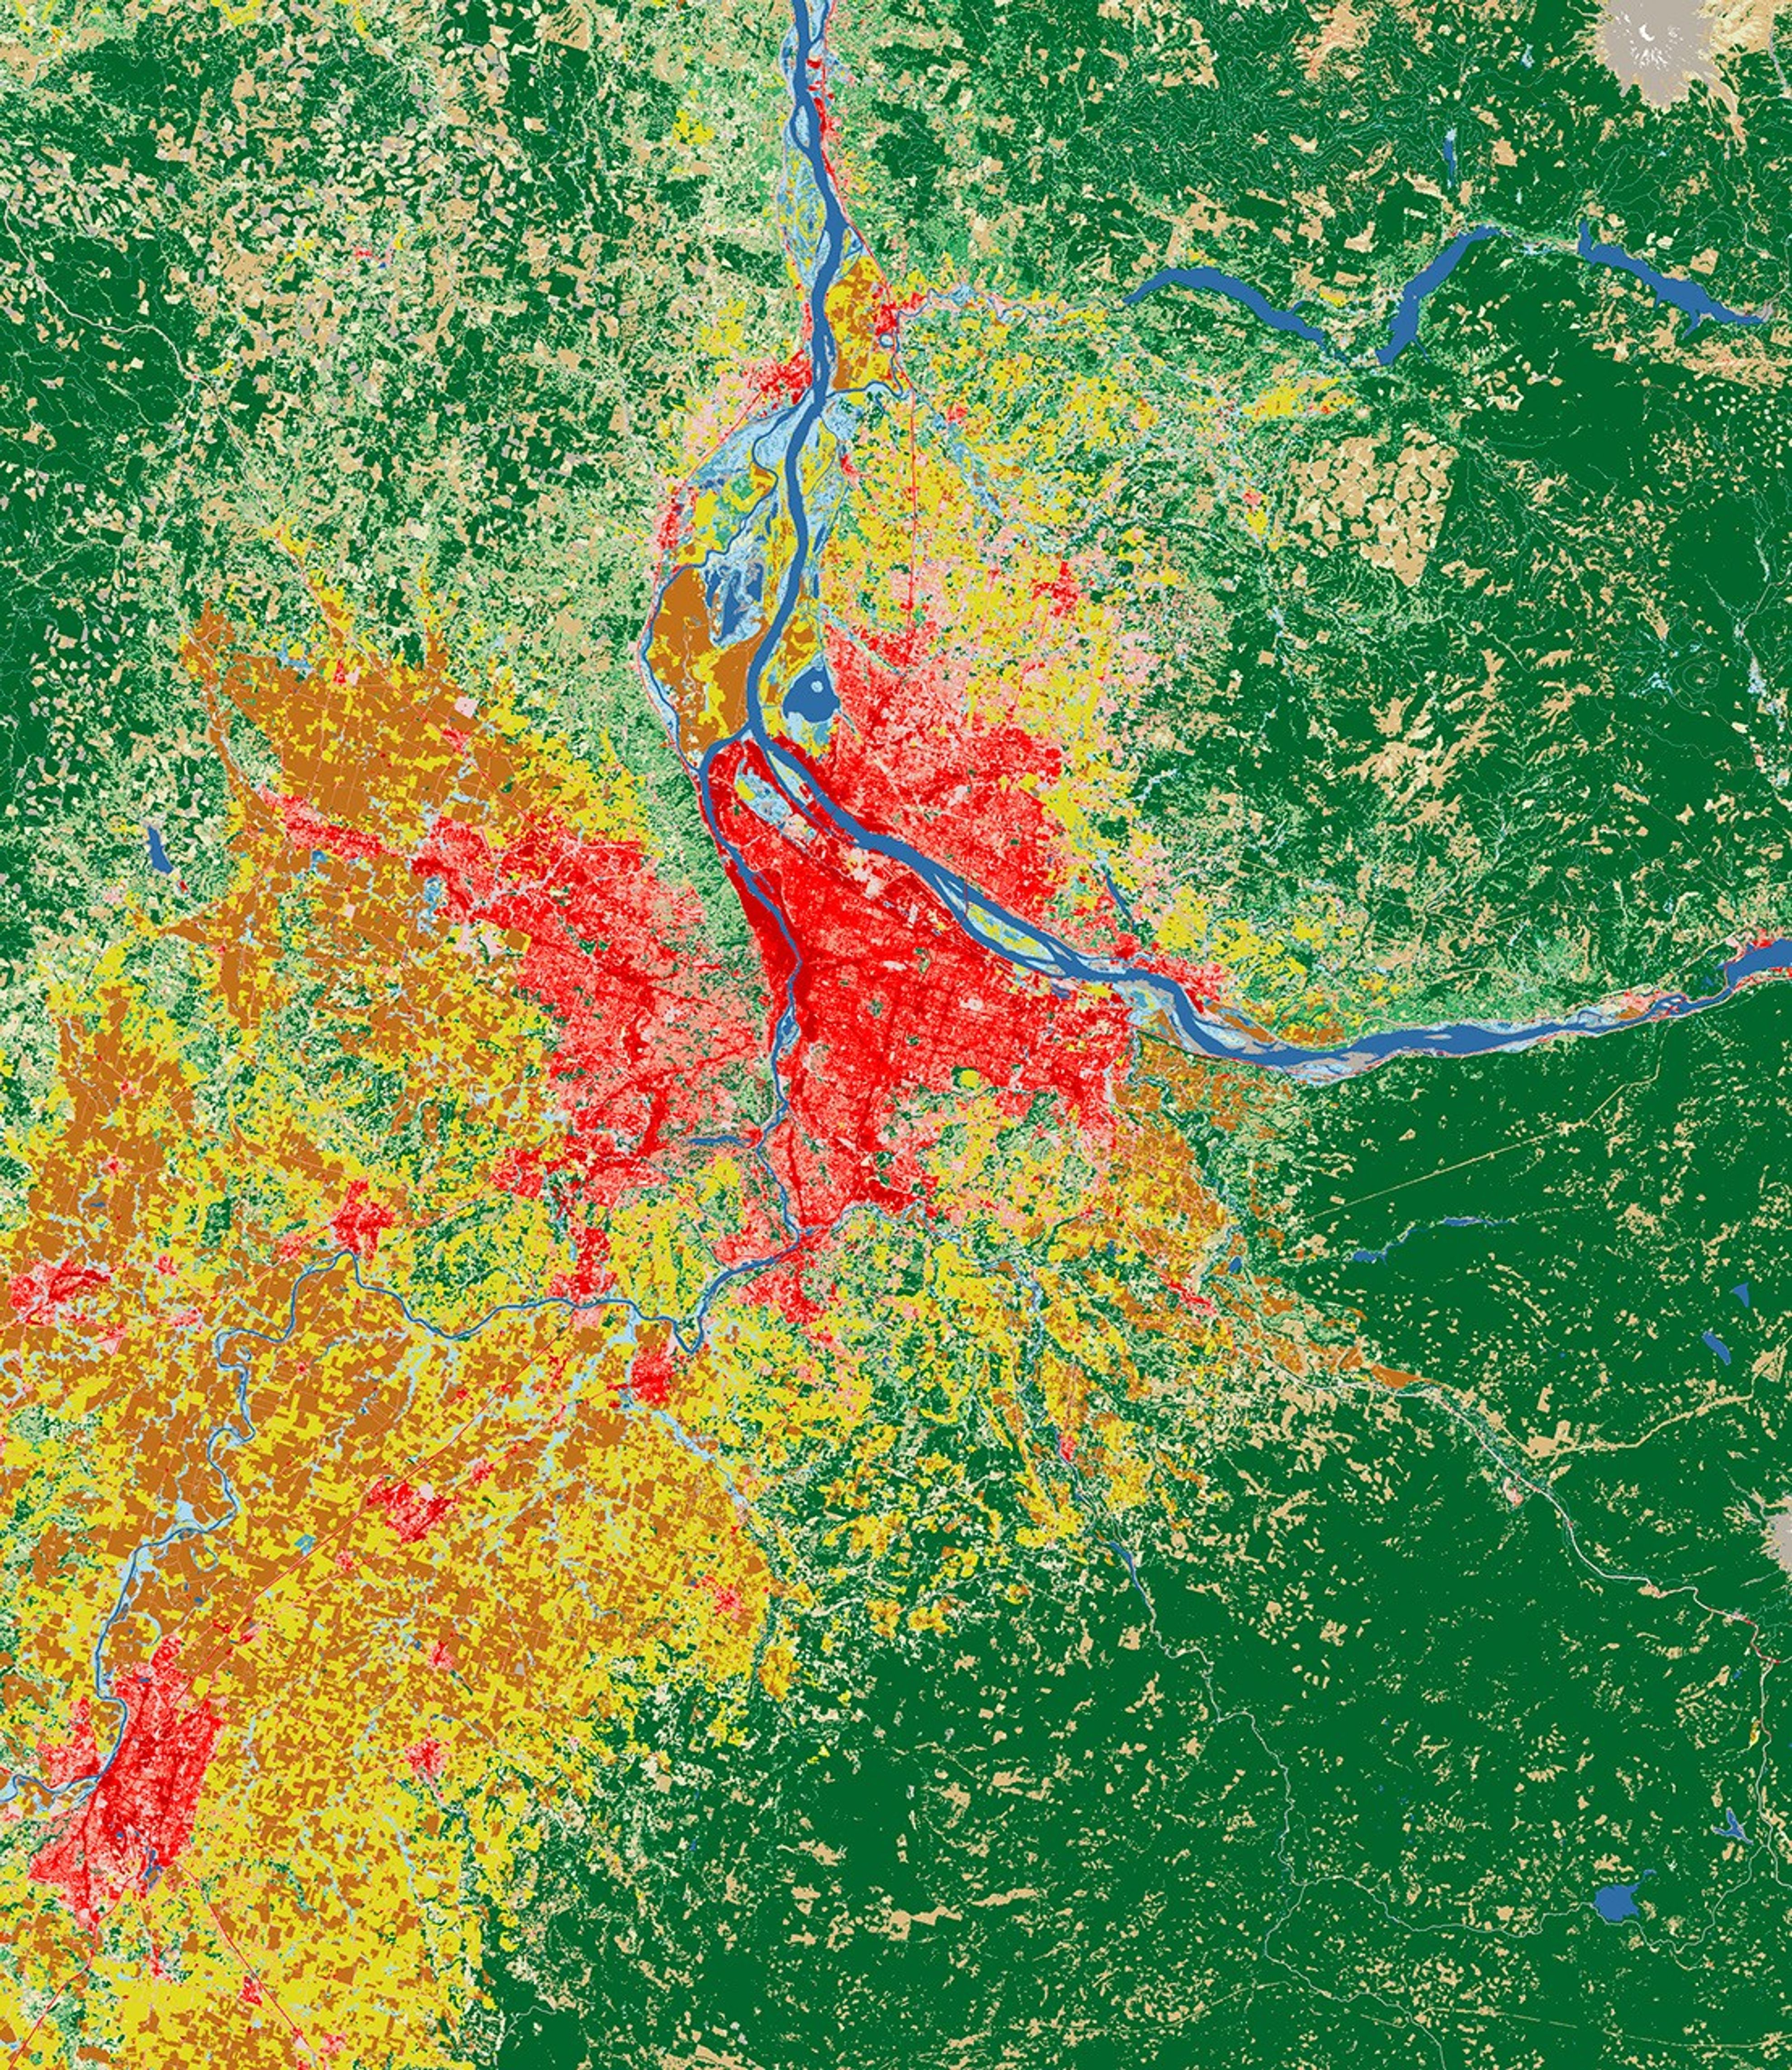
National Land Cover Database (NLCD)
Annually-updated land cover and land cover change datasets for the contiguous U.S., produced by the USGS Earth Resources Observation and Science (EROS) Center.
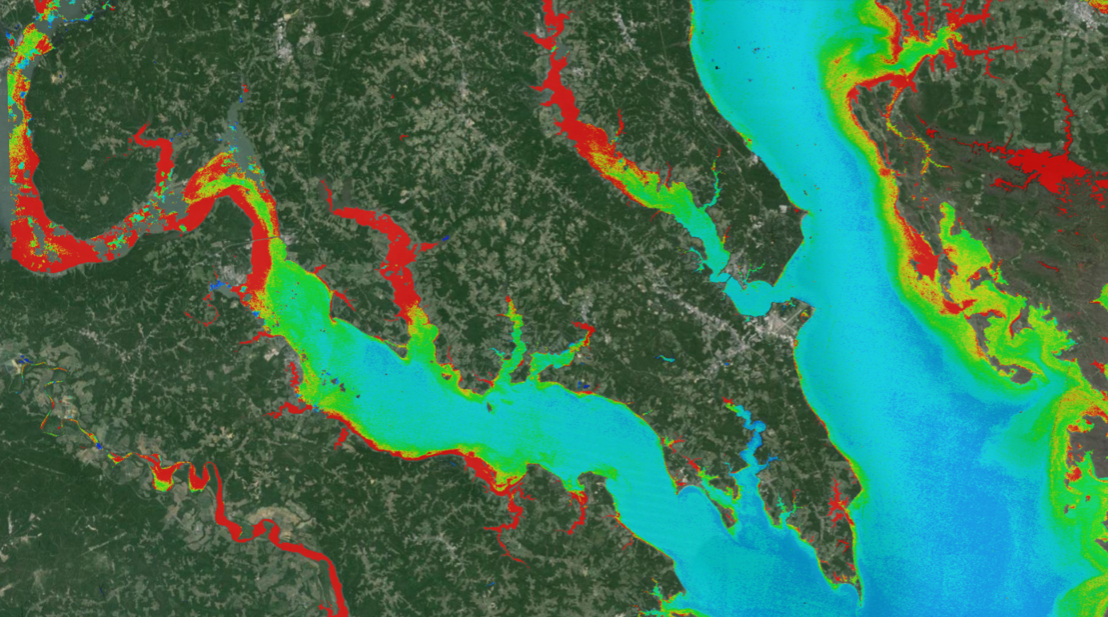
Satellite-based Tool for Rapid Evaluation of Aquatic environMents (STREAM)
A NASA tool that generates water quality maps using NASA/USGS Landsat and ESA Sentinel-2 imagery.
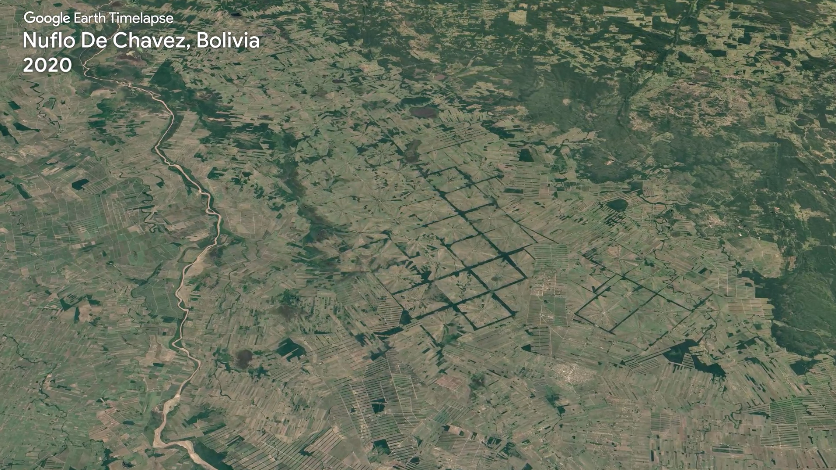
Google Timelapse
A visualization tool that provides global timelapses of Earth’s surface from 1984-2022.
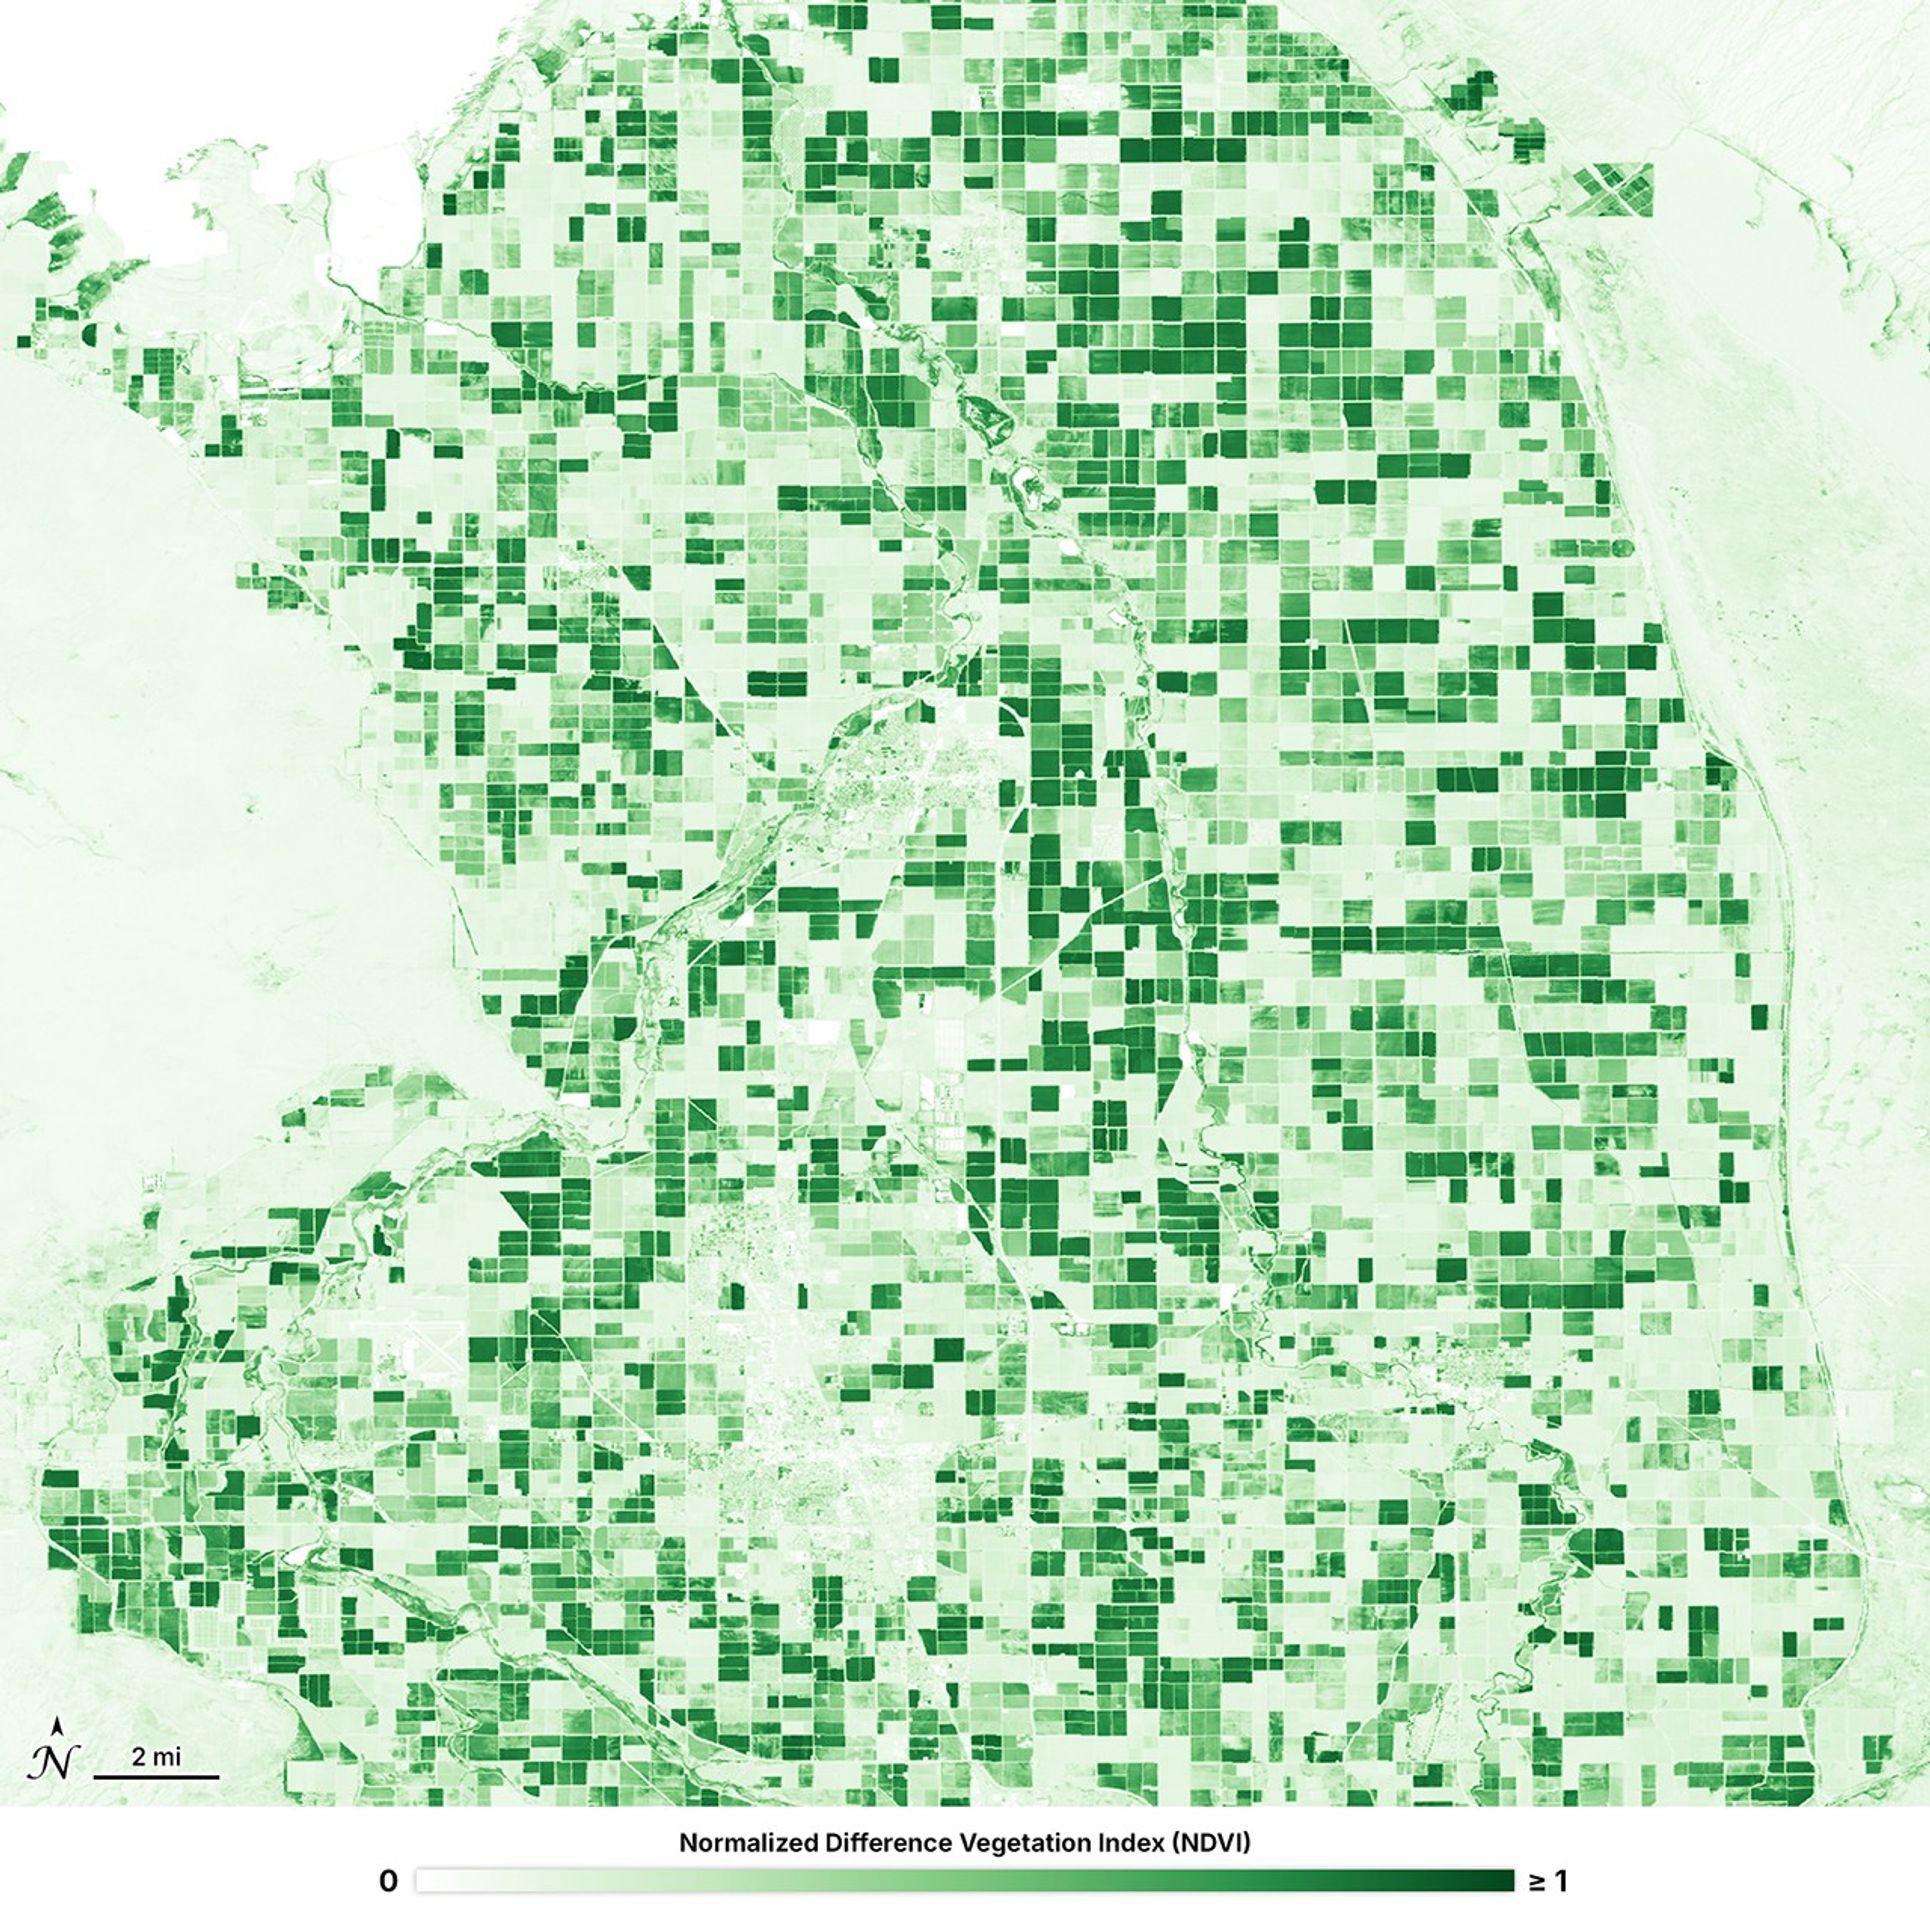
![The U.S. Department of Agriculture tracks how many acres and the annual yield for every crop produced. One method used to estimate crop acreage and yield is remote-sensing data from the NASA-USGS Landsat satellite program. The program started in 1997,with North Dakota, and by 2008 covered the entire lower 48 states and the District of Columbia. Music: "Downloading Landscapes" by Andrew Michael Britton [PRS] and David Stephen Goldsmith [PRS]. Published by Atmosphere Music Ltd [PRS].Complete transcript available.Watch this video on the NASA Goddard YouTube channel.](https://assets.science.nasa.gov/dynamicimage/assets/science/cds/svs/a010000/a013400/a013417/13417_Landsat_Croplands_print.jpg?w=1920&h=1080&fit=clip&crop=faces%2Cfocalpoint)
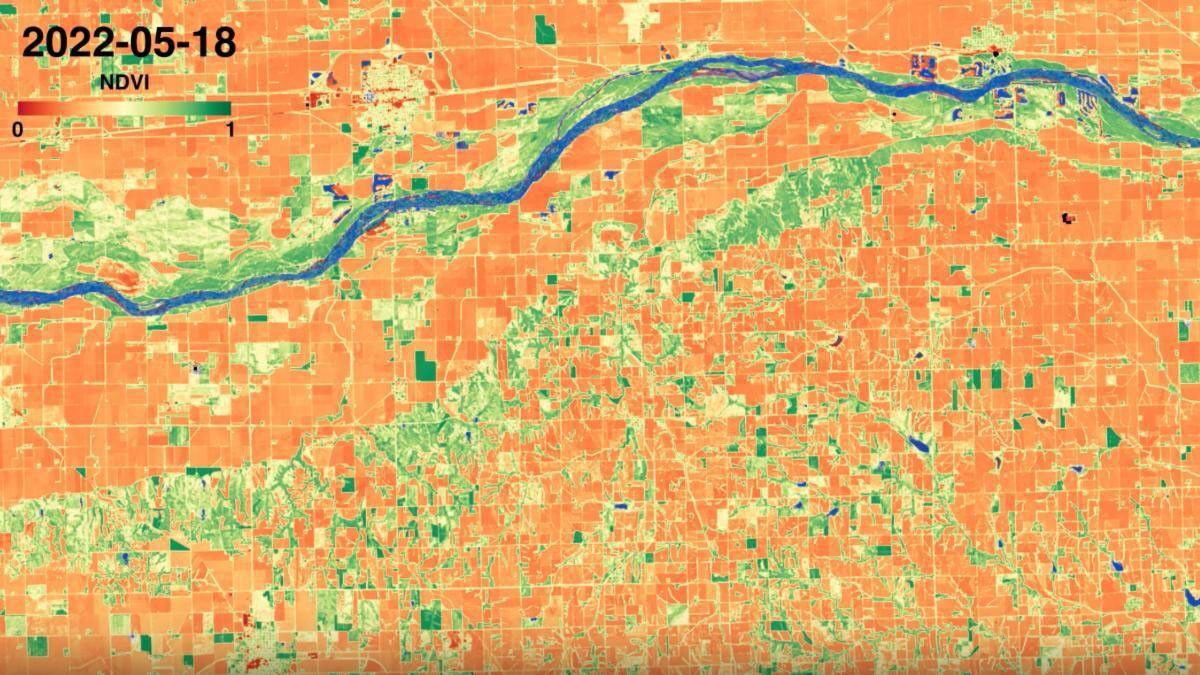
Cropland Data Layer (CDL)
An annual, geo-referenced, land cover data layer developed by the USDA that distinguishes crop types in the contiguous U.S.
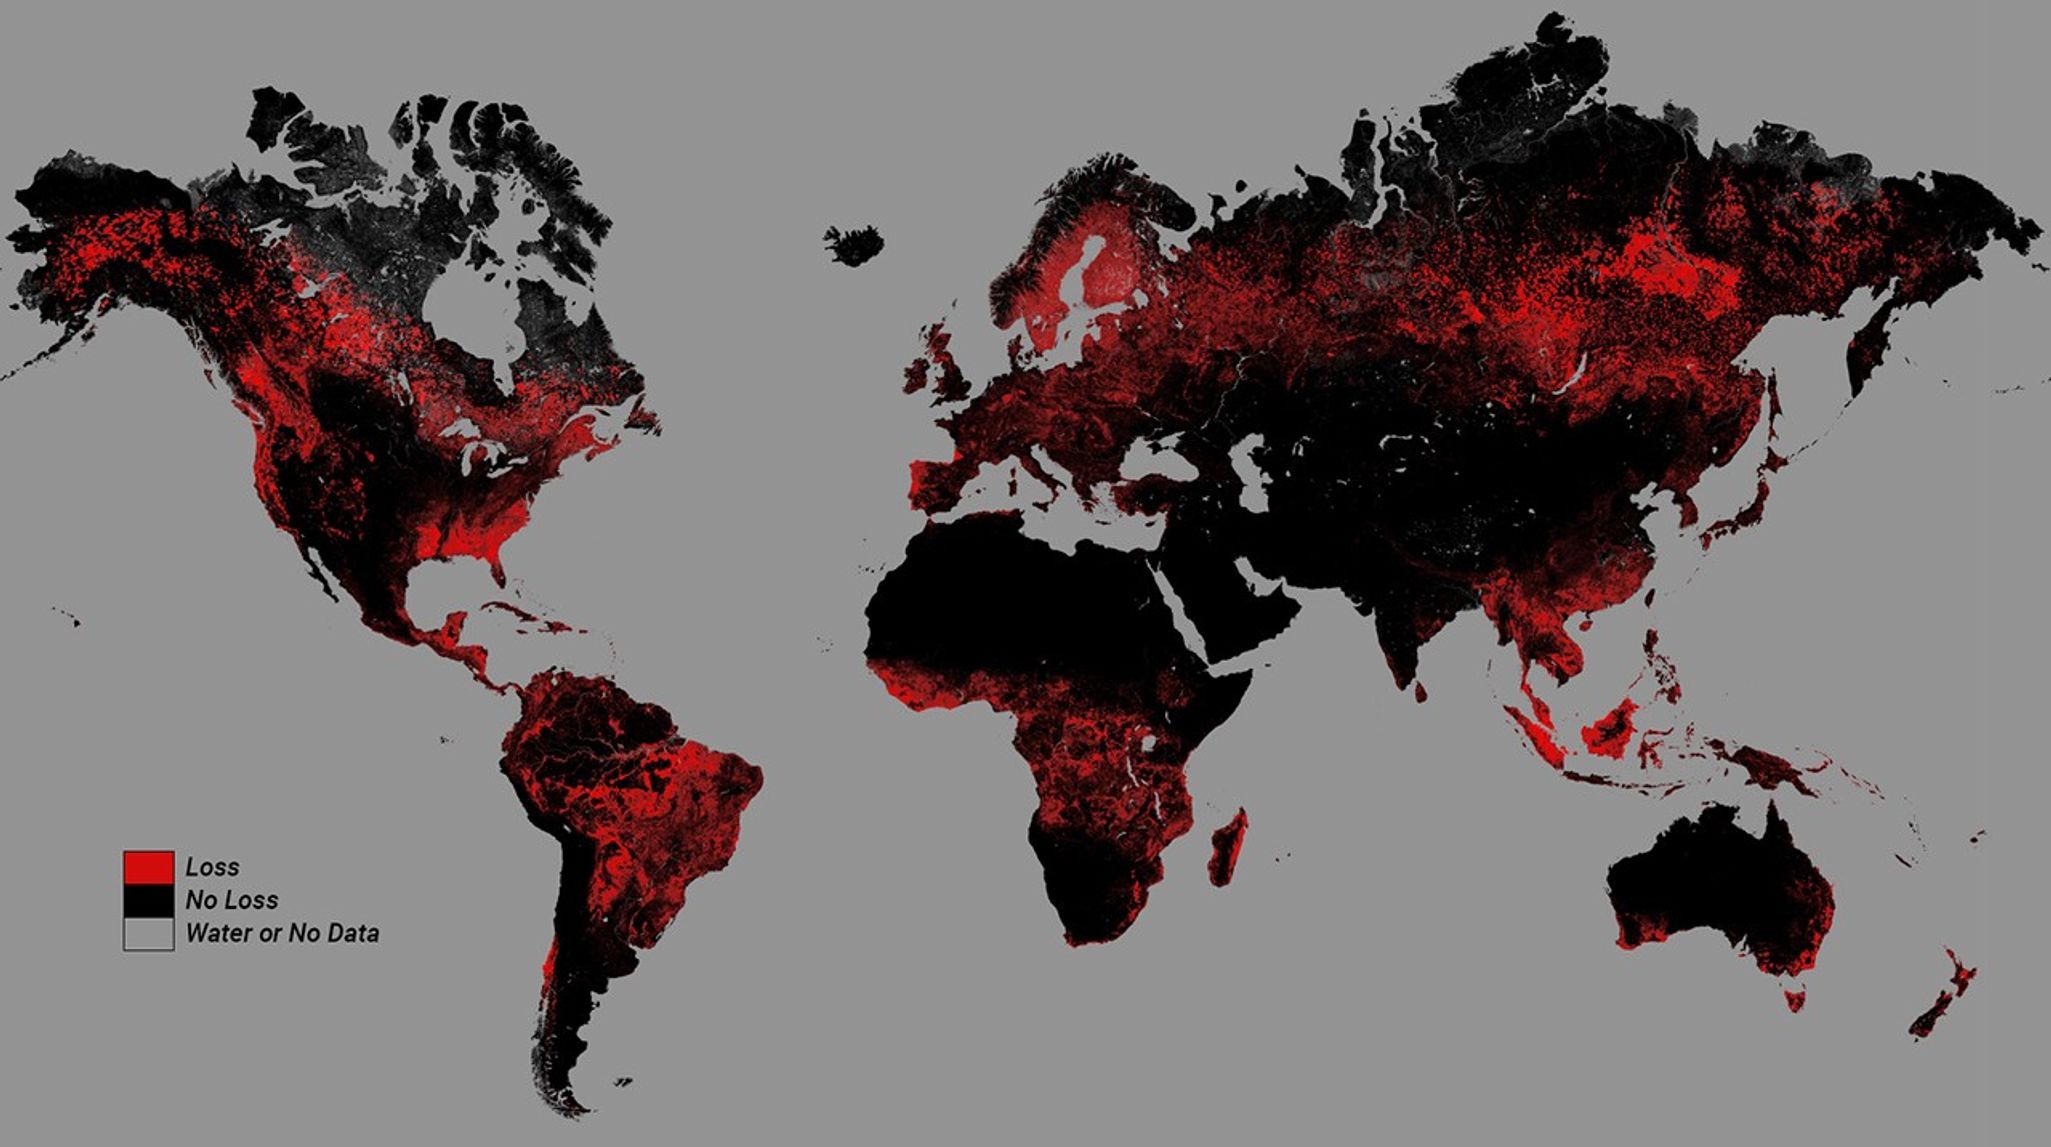
Global Forest Change
A University of Maryland project that monitors global forest extent and change.
Tutorials
“Timelapse in Google Earth simply wouldn’t have been possible without NASA and the United States Geological Survey’s Landsat program, the world’s first (and longest-running) civilian Earth observation program, and the European Union’s Copernicus program with its Sentinel satellites.”
Rebecca Moore
Director, Google Earth, Earth Engine & Outreach
Data Fusion
Landsat data are often used in conjunction with other satellite datasets to expand monitoring capabilities and leverage the strengths of multiple sensor systems. This type of integration is known as data fusion. Landsat imagery can be combined with active data like lidar and SAR, demographic data like population change, and other optical data to provide a more comprehensive view of Earth’s surface.
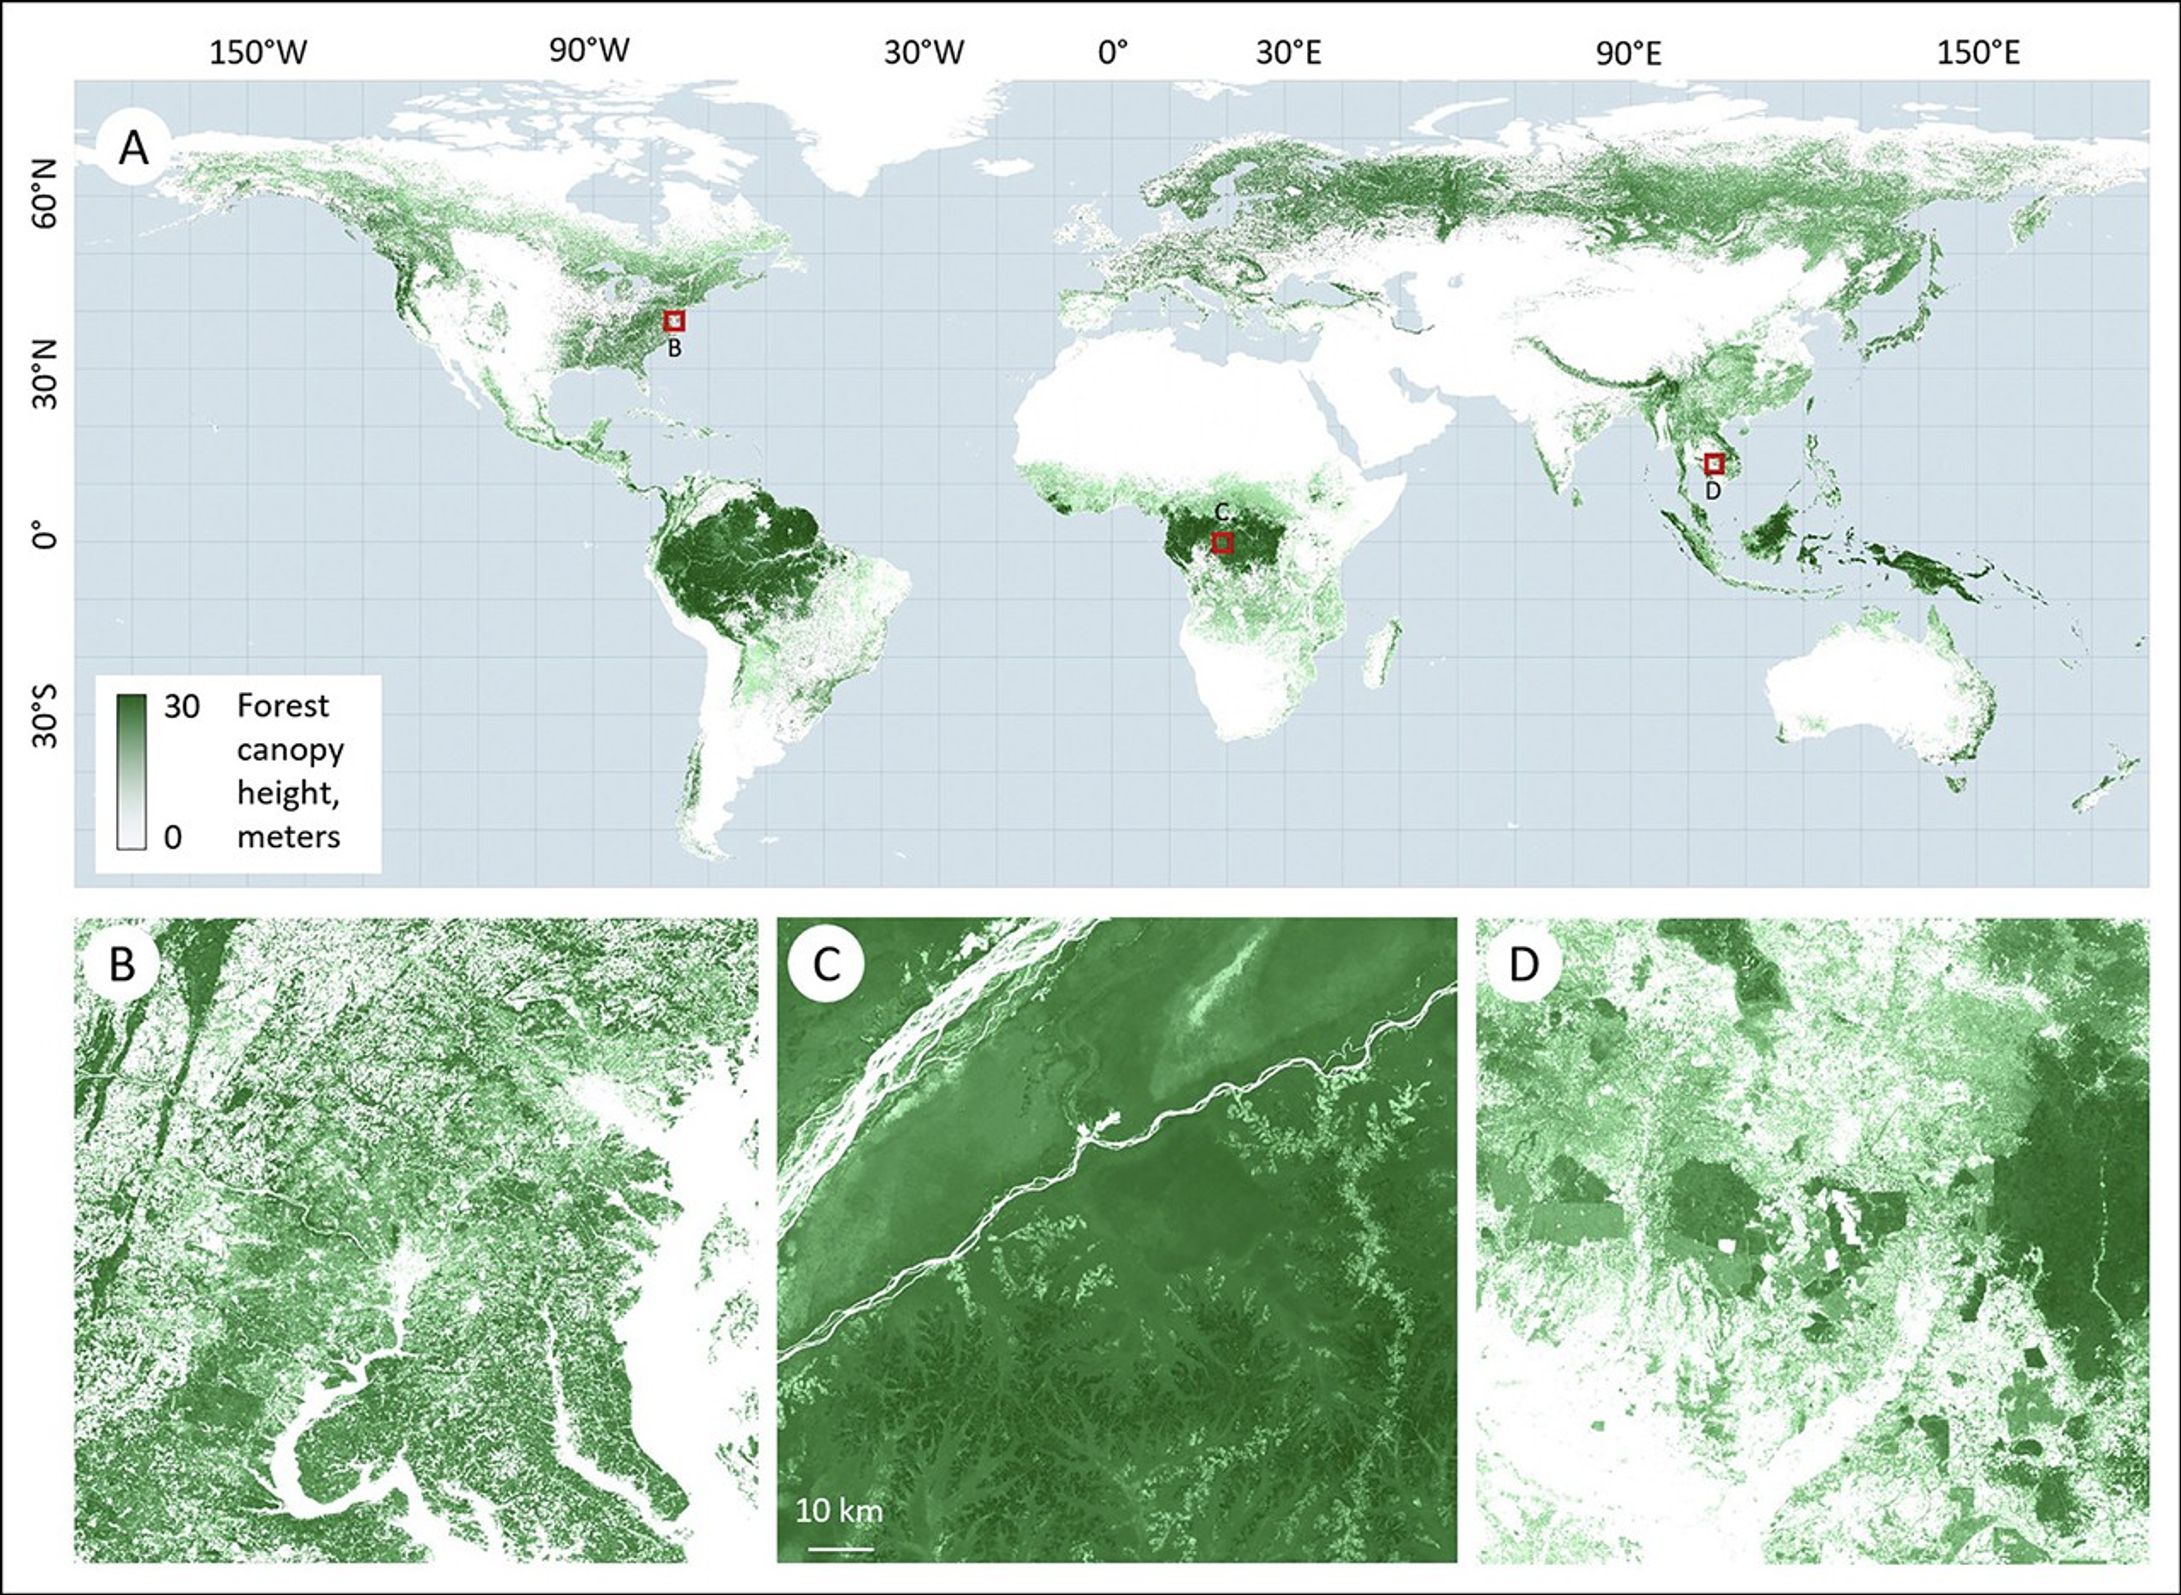
Fusing Landsat imagery with Global Ecosystem Dynamics Investigation (GEDI) 3D forest structure measurements enables detailed assessments of forest biomass, canopy height, and ecosystem health that would be impossible using either dataset alone. By combining these complementary datasets, researchers can monitor forest disturbances and recovery over time, model wildlife habitats, and estimate carbon stocks, supporting more effective and sustainable forest management at regional and global scales.
The Harmonized Landsat Sentinel-2 (HLS) combines imagery from Landsat OLI and Sentinel-2 MSI observations. HLS delivers global observations every 1.6 days—faster than Landsat or Sentinel-2 alone. This higher frequency of observations makes it easier to track short-term changes in vegetation, land use, and water resources. At the same time, HLS maintains the high radiometric and geometric standards of the Landsat mission, ensuring the data remain reliable and consistent for long-term analyses.
Data in Harmony: NASA's Harmonized Landsat and Sentinel-2 Project
NASA's Harmonized Landsat and Sentinel-2 (HLS) project is a groundbreaking initiative that combines data from Landsats 8 & 9 with the European Space Agency's Sentinel-2A & 2B satellites. Explore how HLS data is revolutionizing Earth observation, from aiding search and rescue operations in the aftermath of hurricanes to helping farmers optimize crop yields.
Learn MoreBig Data Helps Scientists Dig Deeper
Landsat’s multi-decade, global archive—comprising more than 4 million scenes and over 50 trillion 30-meter pixels—can be processed at scale using supercomputing and cloud platforms (like Google Earth Engine and NASA’s NEX) to run time‑series analyses, track forest carbon dynamics, detect sub-pixel change, and generate first‑ever global maps of forest gain and loss.
Explore
Landsat represents a public good, Earth-observation infrastructure that allows everyone to study their respective land resources and their change over time.

Matt Hansen
Professor of Geography, University of Maryland
Disclaimer: This web page contains hypertext links to information created and maintained by other organizations. NASA is not responsible for the content of any off-site pages. Reference herein to any specific commercial products, processes, or services by trade name, trademark, manufacturer, or otherwise, does not constitute or imply its endorsement or recommendation by the United States Government.