


![Request for Information – Potential [Placeholder for Prize]](https://assets.science.nasa.gov/dynamicimage/assets/science/psd/solar/2023/09/s/solarsystem_0.jpg?w=1024)


Standard Definition and Evaluation Team
Overview
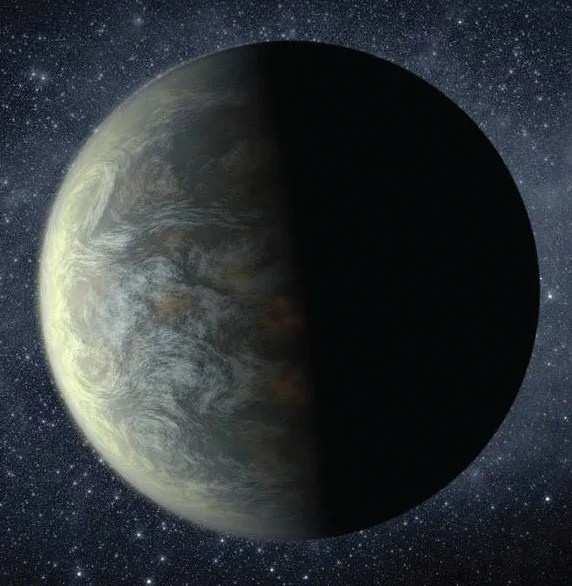
Two of the four large mission concept studies for the Astrophysics Decadal Survey were designed to directly image and spectrally characterize earth-like exoplanets. In 2016, the Astrophysics Division chartered an Exoplanet Standard Definition and Evaluation Team (ExSDET) for the purpose of providing an unbiased science yield analysis of the multiple large mission concepts using a transparent and documented set of common inputs, assumptions and methodologies.
Over the course of the past three years, the ExSDET has responded to the direction provided in the charter and the required deliverables by performing the following tasks:
- Develop analysis tools that will allow quantification of the science metrics of the mission studies
- Incorporate physics-based instrument models to evaluate both internal and external occulter designs
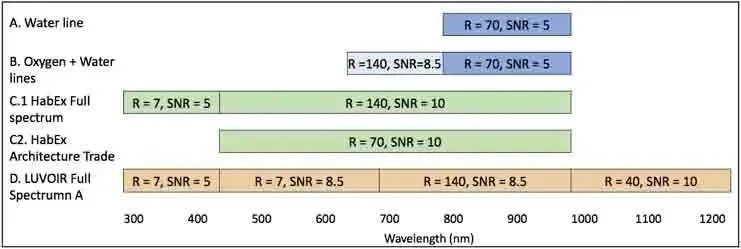
- Establish the science metrics that define the yield criteria
- Cross validate the various analytical methodologies and tools
- Provide complete evaluations using common assumptions and inputs of the exoplanet yields for each mission concept.
The primary goal of the SDET Final Report is to present the best understanding of the exoplanet imaging and characterization capabilities of the current STDT observatory and instrument designs, along with their nominal operating plans, using common input assumptions and analysis methodologies. This report is explicitly not intended to present an exploration of the capabilities of the full design spaces available to the various mission concepts. Due to large uncertainties in the astrophysics inputs, particularly exo-earth occurrence rate, the yield values should be considered relative rather than absolute.
H20 Line: metric A | Broad (metric C1) | Broad (metric C2) | |||||||
| Scenario | AYO | EXO SIMS | Omni | AYO | EXO SIMS | Omni | AYO | EXO SIMS | Omni |
| HabEx 4H | - | 9 | 29 | 8 | 5 | 9 | 8 | 7 | 17 |
| LUVOIR A | 54 | - | 50 | - | - | - | - | - | - |
| LUVOIR B | 28 | 18 | 28 | - | 4 | 6 | - | 7 | 10 |
| HabEx 4C | - | 6 | 12 | - | 2 | 3 | 5 | 3 | 5 |
| HabEx 4S | - | 3 | 18 | - | 3 | 9 | 5 | 3 | 13 |
We present here key plots from four cases evaluated in the Final Report. Each case has two interactive plots in star luminosity versus distance format, with user selectable quantity to be plotted, such as the number of earths detected or characterized, the mean integration time, and the first time the star was observed. Hovering over the star reveals the star name and statistics of the plotted quantity.
The video below shows one design reference mission Monte Carlo realization for the HabEx baseline hybrid architecture. The HabEx 4-meter hybrid case consists of a coronagraph used in a blind search for the detection of exoplanets and a starshade for the spectral characterization of exoplanets.
Case studies
- Case 1: HabEx 4H hybrid, metric C1
- Case 2: LUVOIR B, metric A
- Case 3: HabEx 4C, metric C2
- Case 4: HabEx 4S, metric C2
Documents
Links
- EXOSIMS on Github
- AYO for LUVOIR
- Habitable Exoplanet Observatory (HabEx)
- Large UV-Optical-Infrared Surveyor LUVOIR