![Request for Information – Potential [Placeholder for Prize]](https://assets.science.nasa.gov/dynamicimage/assets/science/missions/a-step/FFR_Earth_Background_20251120%20.png?w=1024)


before
after

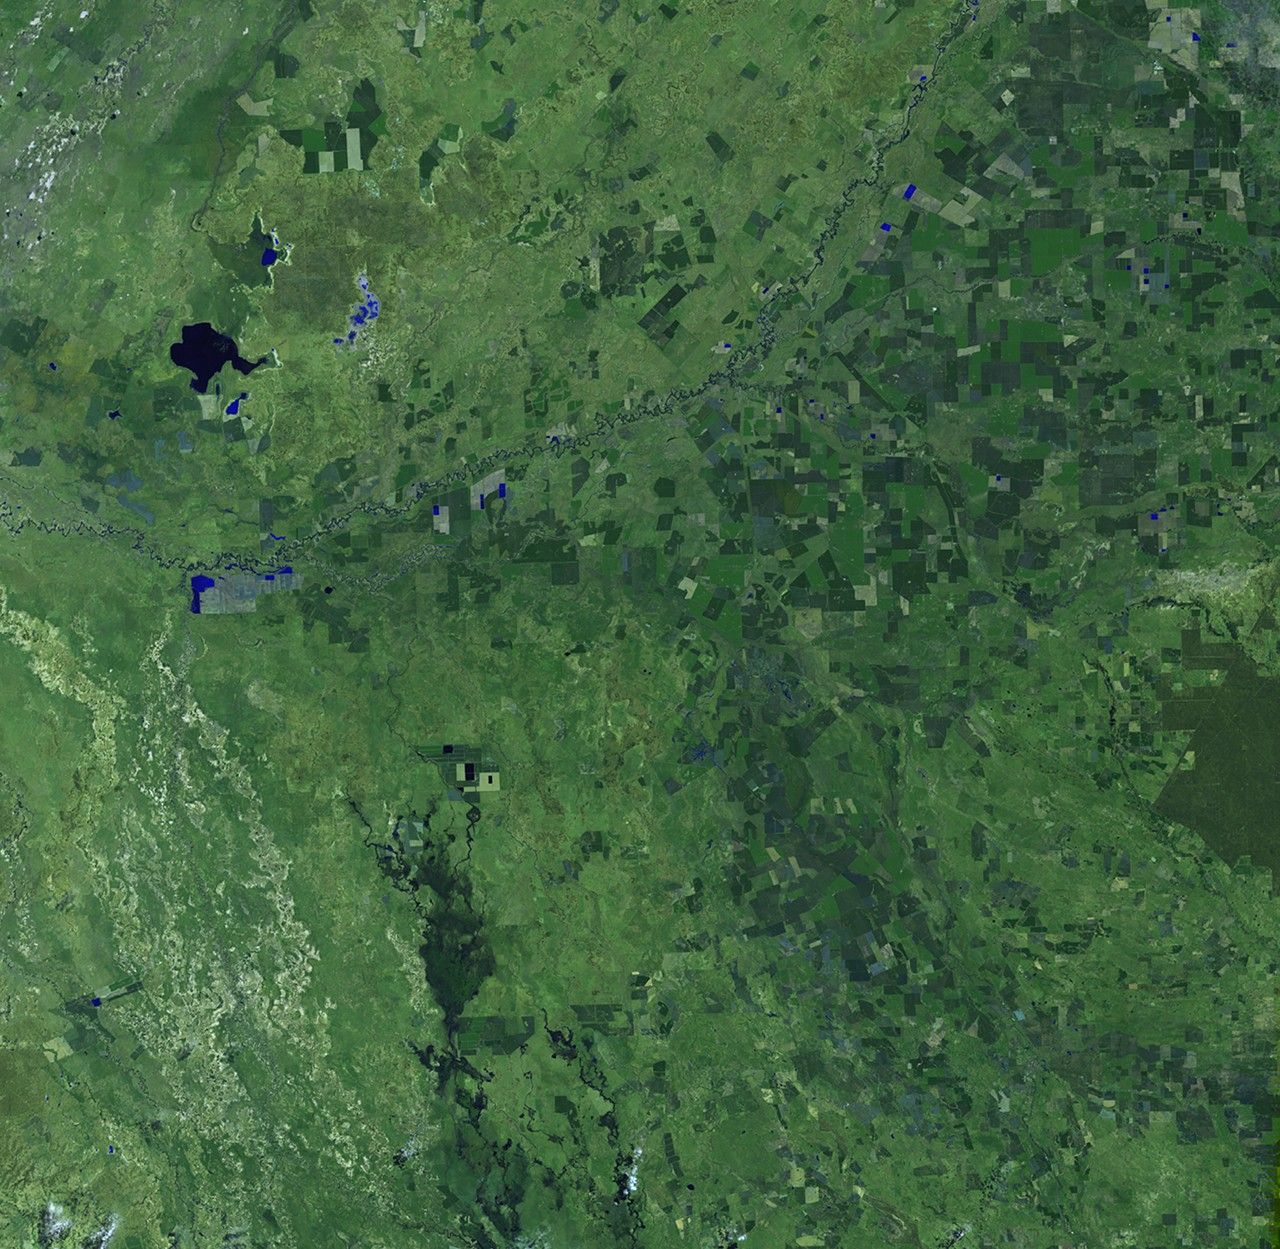
The worst flooding in decades affected an area in southern Australia the size of Germany and France combined, causing at least 10 deaths. It cut off 22 towns, affected over 200,000 people, closed 75 percent of the area's coalmines, devastated the country's wheat crop, and severely damaged housing and transport networks. The October image shows conditions before the flooding. Green tones represent vegetation, much of it wheat crops. Blue and black tones show lakes and meandering rivers. In the December picture, taken during the flood, the lakes and rivers have expanded and lowlands and agricultural fields have become saturated, as shown by the darker colors. Images taken by the Enhanced Thematic Mapper Plus sensor onboard Landsat 7. Source: U.S. Geological Survey (USGS) Landsat Missions Gallery, "Flooding in southern Australia," U.S. Department of the Interior / USGS.
NASA/USGS
before
after
Before and After
Flood, southern Australia
October 9, 2010 - December 12, 2010
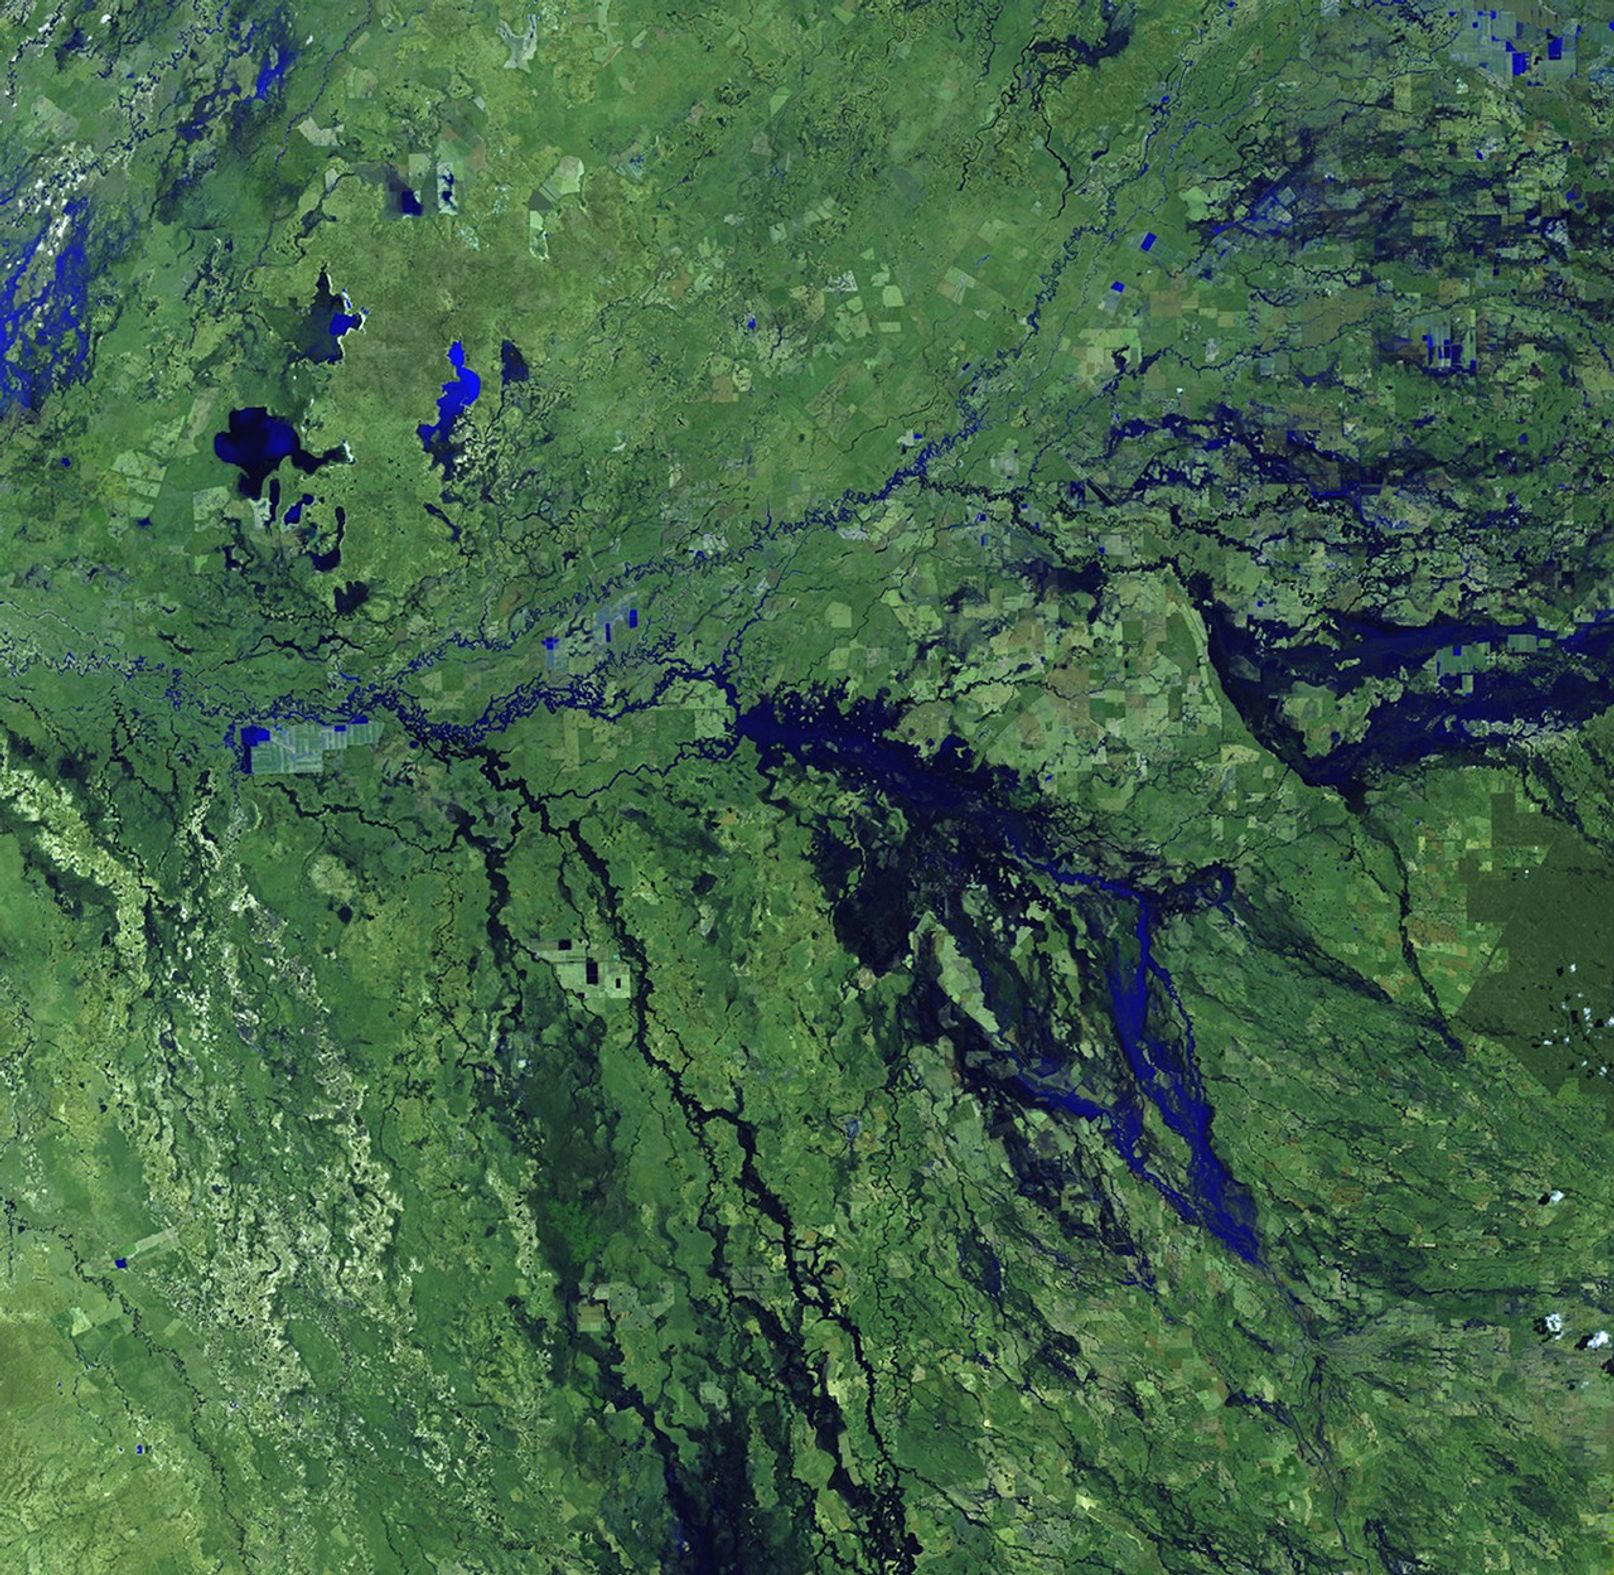
The worst flooding in decades affected an area in southern Australia the size of Germany and France combined, causing at least 10 deaths. It cut off 22 towns, affected over 200,000 people, closed 75 percent of the area's coalmines, devastated the country's wheat crop, and severely damaged housing and transport networks. The October image shows conditions before the flooding. Green tones represent vegetation, much of it wheat crops. Blue and black tones show lakes and meandering rivers. In the December picture, taken during the flood, the lakes and rivers have expanded and lowlands and agricultural fields have become saturated, as shown by the darker colors. Images taken by the Enhanced Thematic Mapper Plus sensor onboard Landsat 7. Source: U.S. Geological Survey (USGS) Landsat Missions Gallery, "Flooding in southern Australia," U.S. Department of the Interior / USGS.