


![Request for Information – Potential [Placeholder for Prize]](https://assets.science.nasa.gov/dynamicimage/assets/science/psd/solar/2023/09/s/solarsystem_0.jpg?w=1024)


Technology
Spectral Bands and Applications
Since the launch of Landsat 1 in 1972, new or refined spectral bands have been added to subsequent Landsat missions to empower existing and emerging applications.
Evolution of Spectral Bands
In 1972, Landsat 1 launched with two instruments: an analog three-band Return Beam Vidicon (RBV) camera system and a secondary four-band digital Multispectral Scanner System (MSS). The MSS had a scanning mirror that whisked back and forth to create an image. Many researchers at the time questioned the effectiveness of this experimental method relative to the high-quality camera systems traditionally used in aerial studies. However, the MSS instrument ultimately proved itself to be the imaging powerhouse and a pioneer in the newly-emerging digital era, delivering superior data compared to existing Earth-observing systems. The MSS was spectrally coarse; it essentially mimicked the color infrared films that were widely used during WWII.
For follow-on sensors, Landsat management brought together scientists from diverse fields to discuss and recommend spectral channels most useful for answering questions in their research areas. These discussions informed the more sophisticated seven-band Thematic Mapper (TM) sensor that flew on Landsats 4 and 5. The Landsat TM band placement has guided all successive Landsat sensors and is also echoed in almost all modern passive remote sensing systems—domestic, international, public, commercial, and even those circling about other planets. The Enhanced Thematic Mapper Plus (ETM+) instrument on Landsat 7 added an eighth band spanning the visible portion of the EM spectrum: the panchromatic band. It enabled Landsat images to be pansharpened to 15-meter resolution. The ETM+ also included a thermal infrared band and scientists developed methods to derive evapotranspiration rates using the thermal band data in conjunction with the other bands to assess water consumption in irrigated fields and natural ecosystems.
To maintain data continuity with earlier Landsat missions, Landsat 8 and 9 collect data in eight “heritage bands”: three visible bands, one near-infrared band, two shortwave-infrared bands, and two thermal-infrared bands. The Operational Land Imager (OLI) and Thermal Infrared Sensor (TIRS) instruments on Landsat 8 increased the total number of spectral bands to 11. On OLI, new bands included a coastal blue band (band 1) for ocean color observations in coastal zones and a shortwave-infrared band (band 9) which senses wavelengths that strongly absorb water vapor, allowing for the detection of cirrus clouds. The TIRS instrument collects data in two thermal bands (bands 10 and 11). These longer-wavelength bands play a vital role in measuring evapotranspiration to track water use, detect fire scars and volcanic lava flows, and calculate spectral indices to monitor land use.
Landsat 1-5 Multispectral Scanner System (MSS)
The MSS became the primary instrument on Landsat 1 after the rapid failure of the Return Beam Vidicon (RBV). It had superior radiometric and geometric performance for science applications. It was the primary instrument on Landsat 2 and 3 and the secondary instrument on Landsat 4 and 5. Landsat 3’s MSS sensor had an additional band, band 8, that sensed emitted thermal-infrared radiation.
| Landsat 1-2 Band | Landsat 3 Band | Landsat 4-5 Band* | Wavelength (µm) | GSD (m) |
|---|---|---|---|---|
| Band 4 - Green | Band 4 - Green | Band 1 - Green | 0.5-0.6 | 80 |
| Band 5 - Red | Band 5 - Red | Band 2 - Red | 0.6-0.7 | 80 |
| Band 6 - Near-infrared (NIR) | Band 6 - Near-infrared (NIR) | Band 3 - Near-infrared (NIR) | 0.7-0.8 | 80 |
| Band 7 - Near-infrared (NIR) | Band 7 - Near-infrared (NIR) | Band 4 - Near-infrared (NIR) | 0.8-1.1 | 80 |
| N/A | Band 8 - Thermal-infrared (TIR) | N/A | 10.4-12.6 | 240 |
-
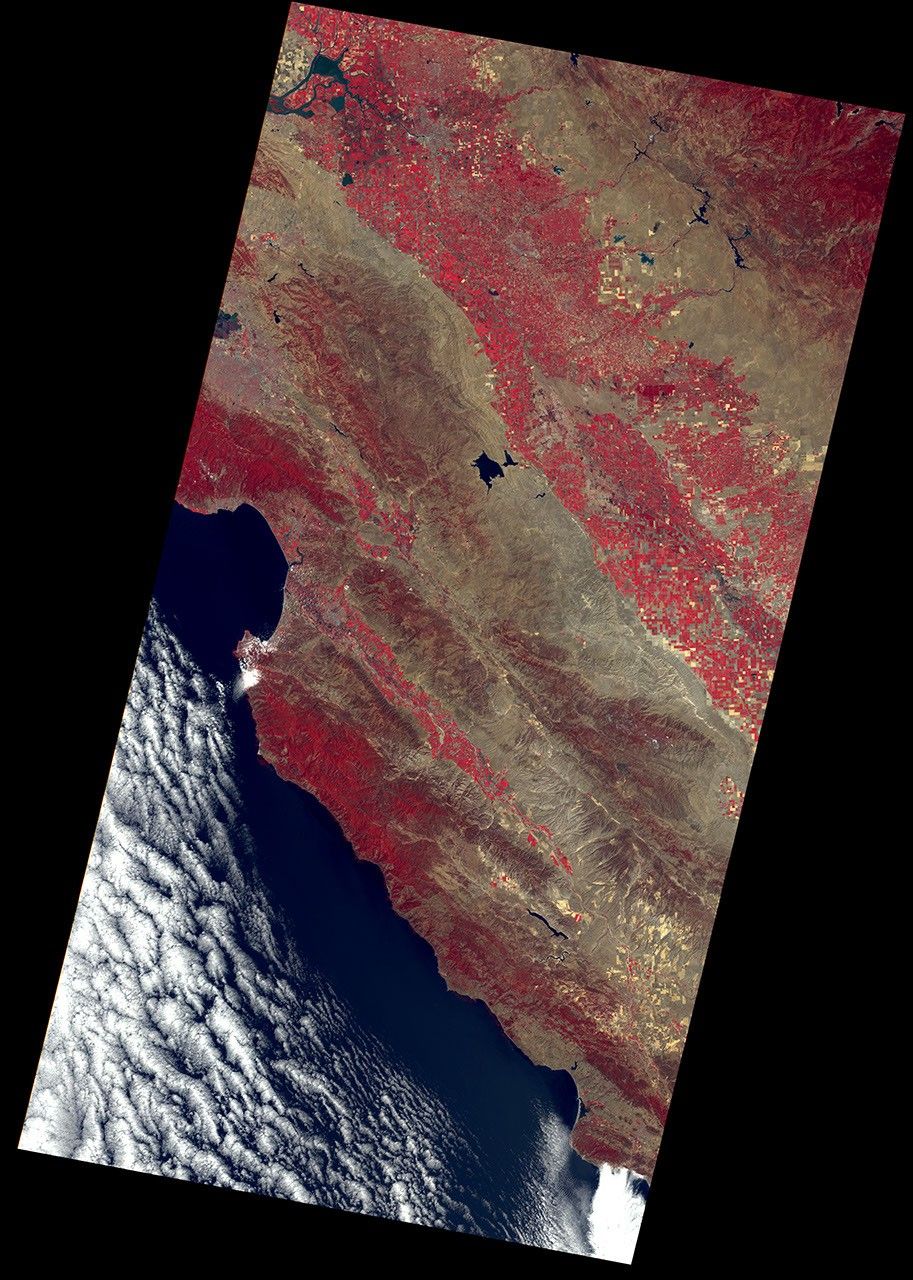
Green (Band 4) & Red (Band 5)
The green and red bands sense wavelengths from 0.5 – 0.6 µm and 0.6 – 0.7 µm, respectively, in the visible portion of the electromagnetic spectrum. Chlorophyll absorbs light in red wavelengths to drive photosynthesis and reflects light in green wavelengths, making these bands valuable for assessing plant health and distinguishing between vegetated and non-vegetated areas. Scientists use these data to identify different plant types, monitor crop growth, and assess land use changes.
-
Near-infrared (Bands 6 & 7)
The two near-infrared bands sense wavelengths from 0.7 – 0.8 µm (band 6) and 0.8 – 1.1 µm (band 7). Healthy vegetation is highly reflective in the near-infrared portion of the electromagnetic spectrum. Data from bands 6 and 7 are used to measure vegetation health, detect plant stress, calculate vegetation density, and monitor agricultural production trends. Band 7 penetrates through atmospheric haze, enabling improved delineation between vegetation and land.
-
Thermal-infrared (Band 8) *Landsat 3 only
Band 8 was designed to detect thermal-infrared energy emitted from the Earth's surface in wavelengths from 10.4 – 12.6 µm. This band was only on Landsat 3 MSS. It failed shortly after launch but demonstrated the potential usefulness of thermal data for applications such as assessing water temperature and identifying heat signatures of land features for geological or environmental studies.
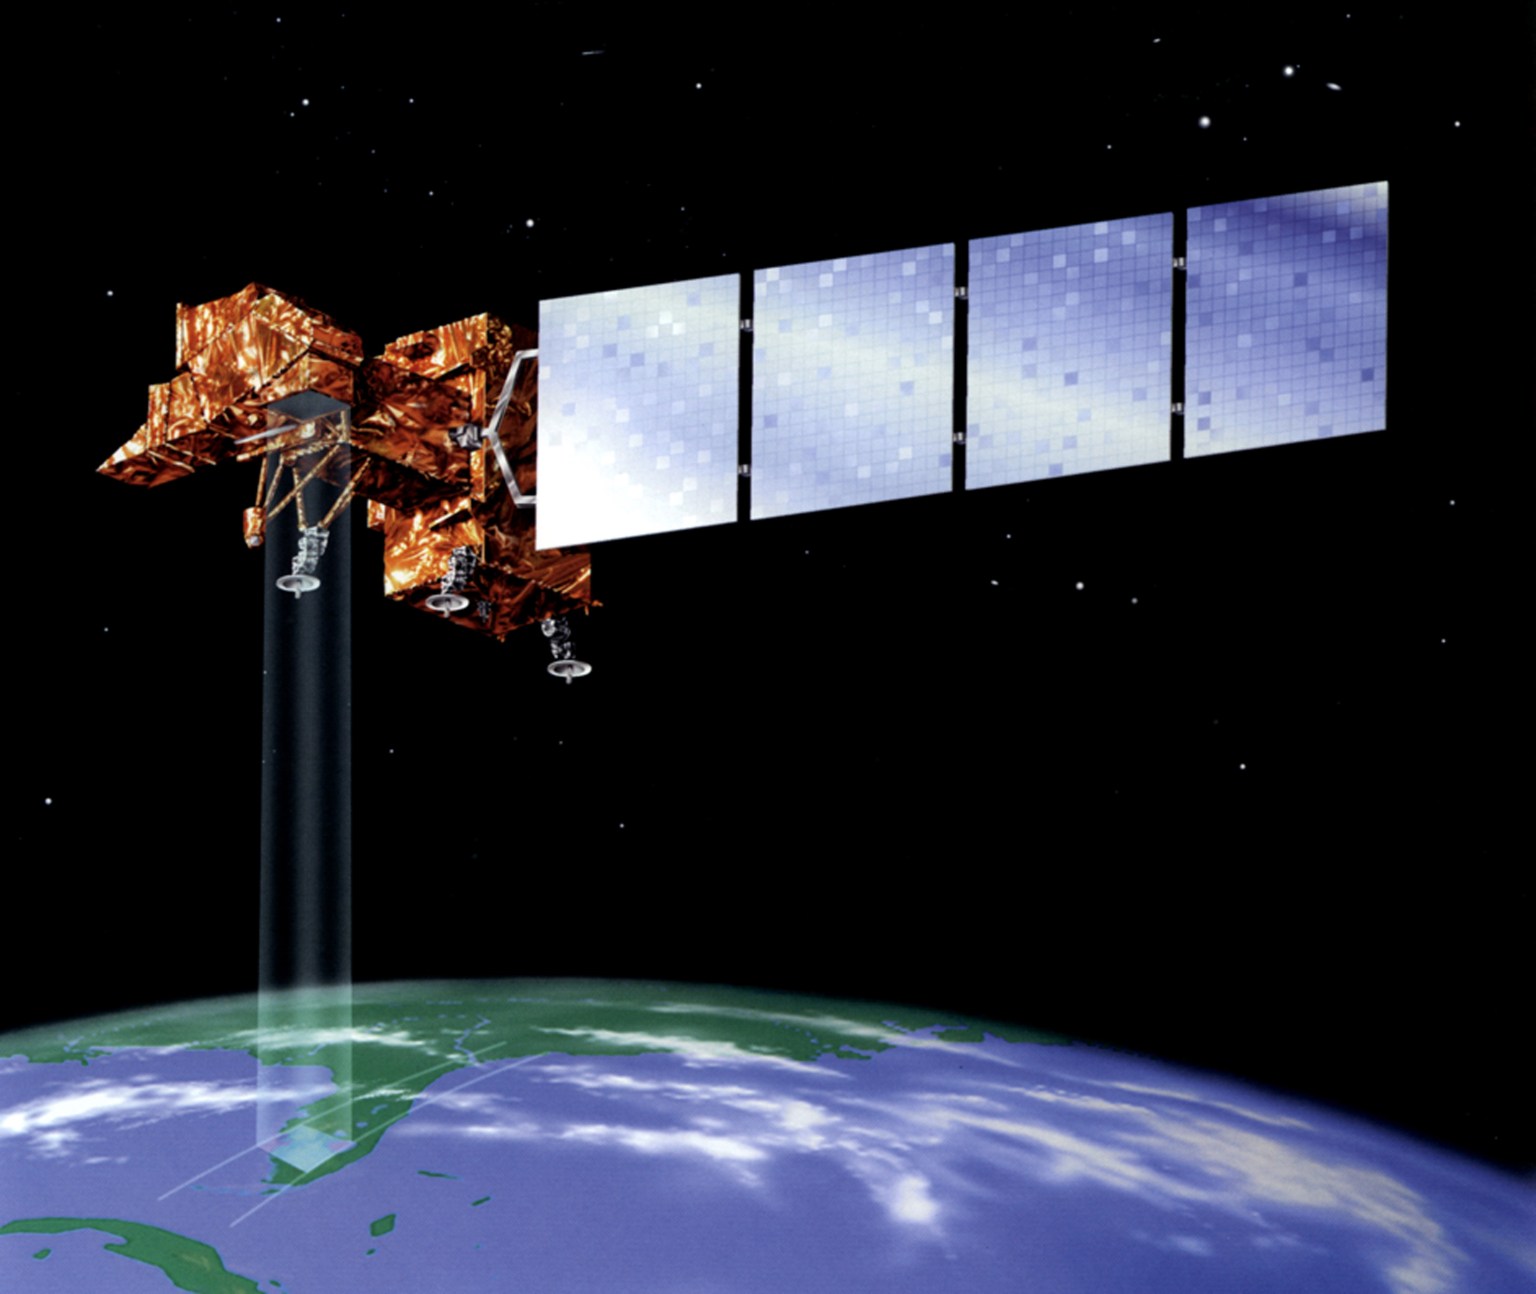
Landsat 4-5 Thematic Mapper (TM)
The TM on Landsats 4-5 introduced a blue band, which enabled researchers to create the first natural-color Landsat images. TM also included refined versions of MSS bands and a new shortwave-infrared band that improved plant identification and mineral mapping.
| Band | Wavelength (µm) | GSD (m) |
|---|---|---|
| Band 1 - Blue | 0.45-0.52 | 30 |
| Band 2 - Green | 0.52-0.60 | 30 |
| Band 3 - Red | 0.63-0.69 | 30 |
| Band 4 - Near Infrared (NIR) | 0.76-0.90 | 30 |
| Band 5 - Shortwave Infrared (SWIR) | 1.55-1.75 | 30 |
| Band 6 - Thermal Infrared (TIR) | 10.40-12.50 | 120 (resampled to 30) |
| Band 7 - Shortwave Infrared (SWIR) 2 | 2.08-2.35 | 30 |
-
Blue (Band 1)
The blue band senses wavelengths from 0.45 – 0.52 µm in the visible portion of the electromagnetic spectrum. This band detects subtle differences in chlorophyll absorption and allows greater penetration of clear water, supporting bathymetric measurements, coastal mapping, reef surveys, and identification of uncharted islands and atolls.
-
Green (Band 2) & Red (Band 3)
The green and red bands sense wavelengths from 0.52 – 0.60 µm and 0.63 – 0.69 µm, respectively, in the visible portion of the electromagnetic spectrum. These refined bands are significantly narrower than their MSS counterparts, enabling more precise measurement of vegetation reflectance. The green band better captures peak vegetation reflectance in the visible part of the spectrum, while the red band provides enhanced contrast for plant identification.
-
Near-infrared (Band 4)
The near-infrared band senses wavelengths from 0.76 – 0.9 µm. Compared to its MSS counterparts, this narrower spectral band reduces atmospheric water vapor interference, enabling more accurate surface measurements. Band 4 is particularly valuable for vegetation studies as plants reflect strongly in this range.
-
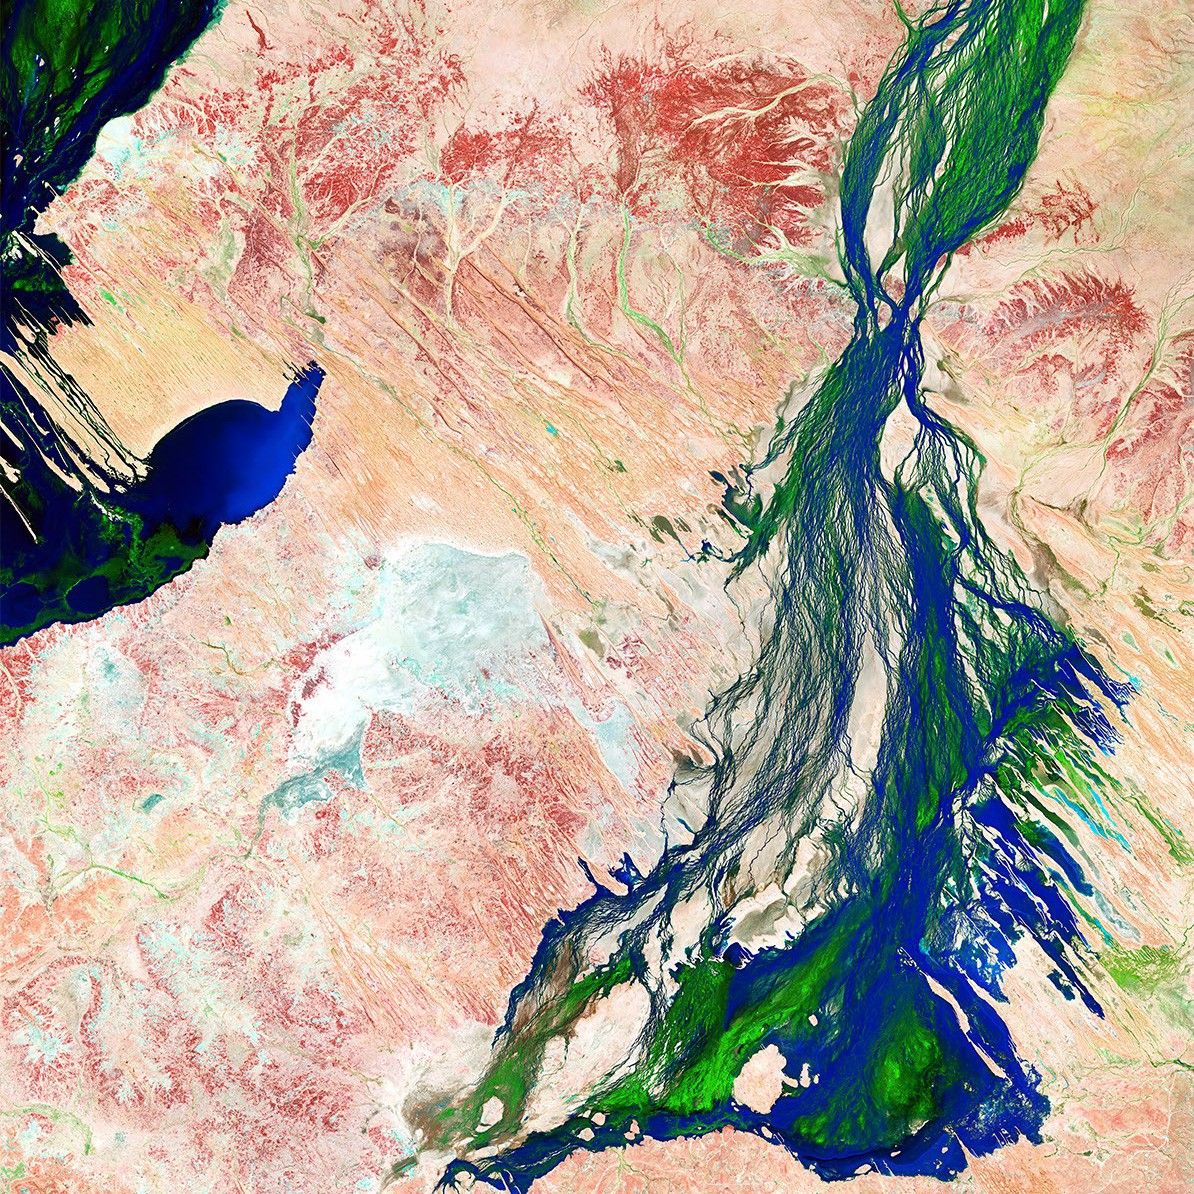
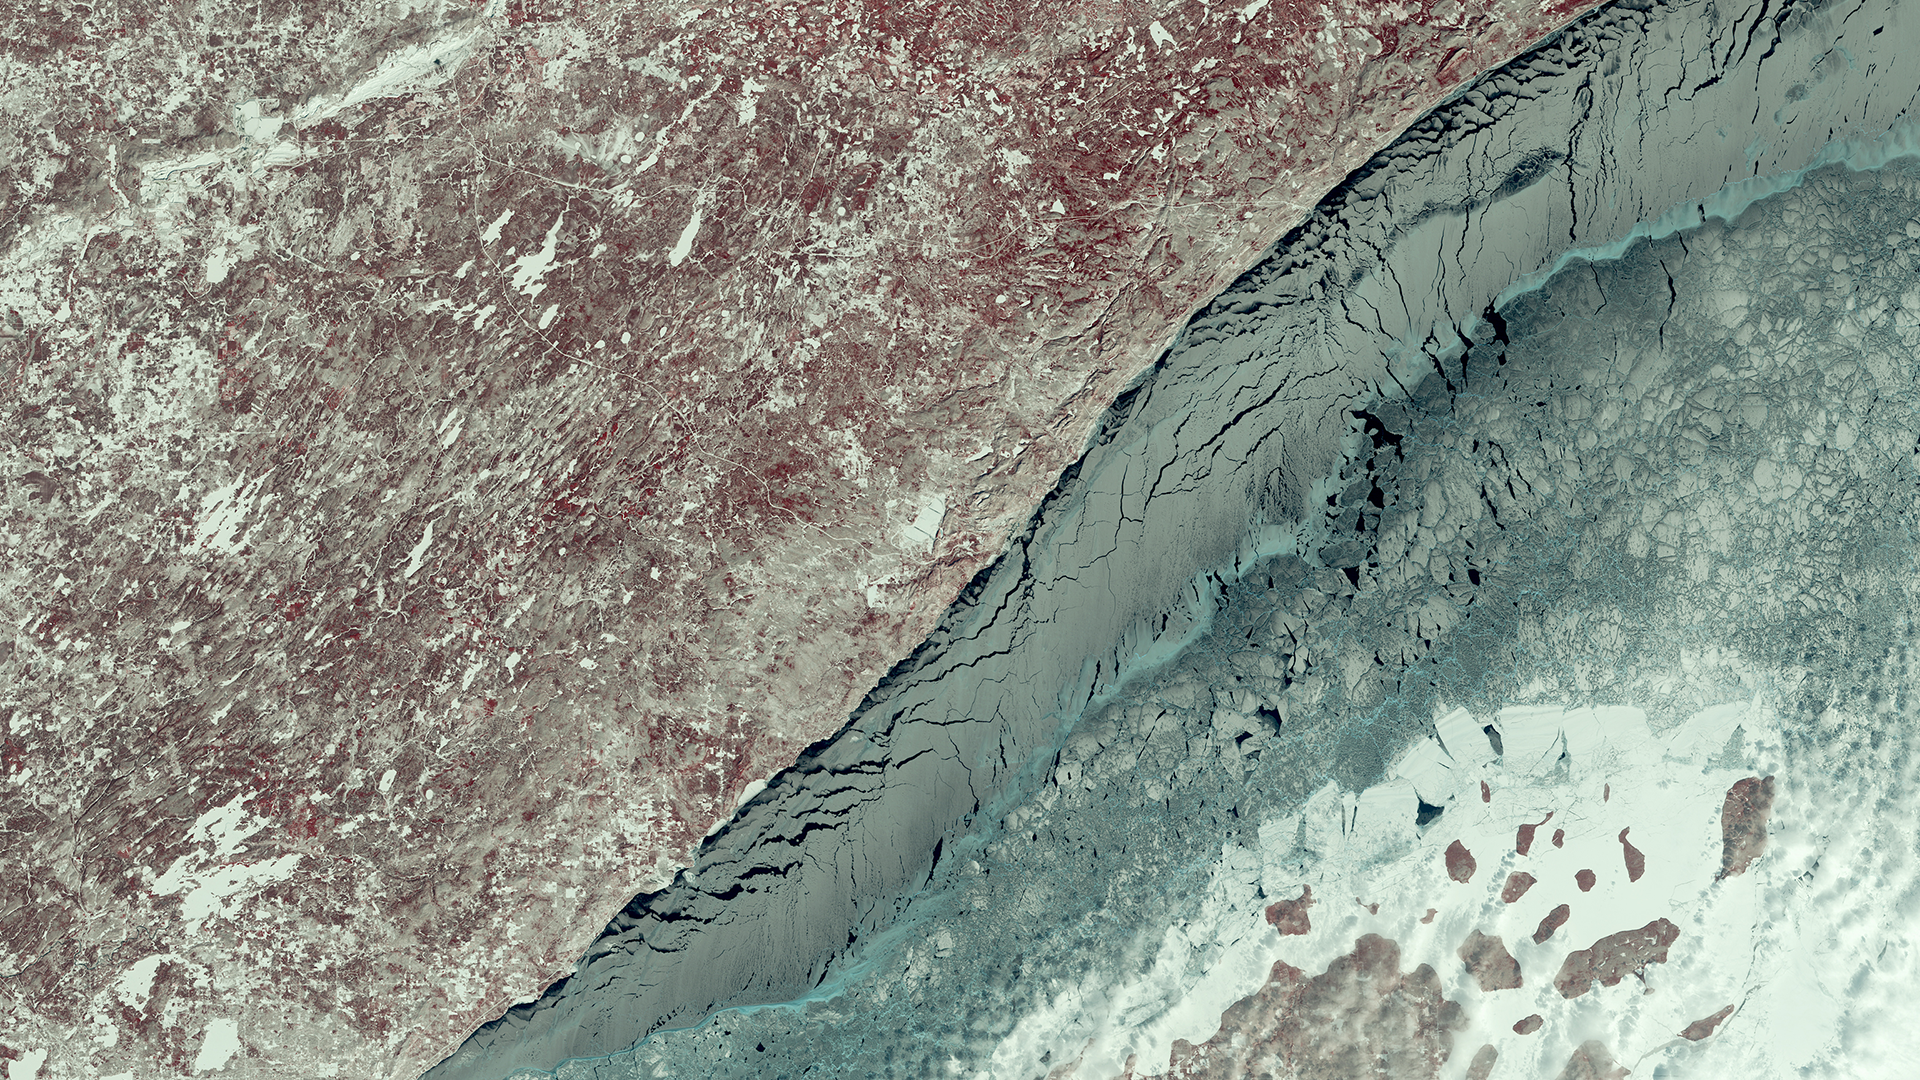
Shortwave-infrared (Bands 5 & 7)
The two shortwave-infrared bands sense wavelengths from 1.55 – 1.75 µm (band 5) and 2.08 – 2.35 µm (band 7). These bands detect leaf water content, allowing plant identification based on leaf succulency. Bands 5 and 7 also distinguish hydrothermal clay minerals from other species, supporting mineral exploration and soil-type mapping in semi-arid regions. Shortwave-infrared wavelengths are less affected by scattering from atmospheric particles like fog, dust, and smoke than visible light, enabling scientists to monitor Earth’s surface during events like wildfires.
-
Thermal-infrared (Band 6)
The thermal-infrared band senses wavelengths from 10.4 – 12.5 µm and measures emitted heat from the surface of the Earth—an important new capability in remote sensing. It enables scientists to estimate soil moisture, assess plant health through temperature variations, and distinguish heat capacities among plant types. Band 6 also supports geological studies by measuring thermal inertia, which is valuable for mineral and petroleum exploration.
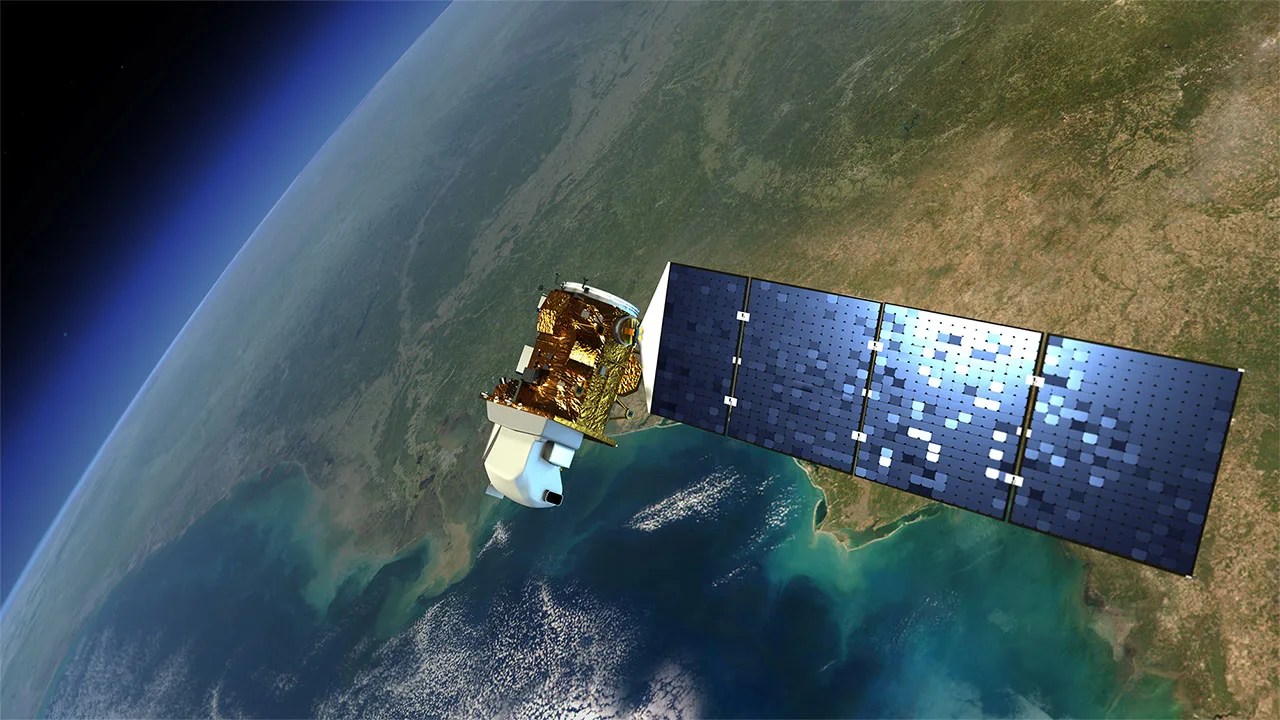
Landsat 7 Enhanced Thematic Mapper Plus (ETM+)
The ETM+ aboard Landsat 7 introduced the panchromatic band, whose 15-meter resolution allows researchers to see the planet in twice as much detail. ETM+ also provided improved thermal-infrared capabilities which continued to demonstrate the value of remotely-sensed thermal measurements.
| Band | Wavelength (µm) | GSD (m) |
|---|---|---|
| Band 1 - Blue | 0.45-0.52 | 30 |
| Band 2 - Green | 0.52-0.60 | 30 |
| Band 3 - Red | 0.63-0.69 | 30 |
| Band 4 - Near-infrared (NIR) | 0.77-0.90 | 30 |
| Band 5 - Shortwave-infrared (SWIR) | 1.55-1.75 | 30 |
| Band 6 - Thermal-infrared (TIR) | 10.40-12.50 | 60 (resampled to 30) |
| Band 7 - Shortwave-infrared (SWIR) 2 | 2.09-2.35 | 30 |
| Band 8 - Panchromatic | 0.52-0.90 | 15 |
-
Thermal-infrared (Band 6)
The detector on the thermal band senses energy from 10.40 – 12.50 µm in both high gain (band 6H) and low gain (band 6L). Gain refers to the detector’s sensitivity. The high-gain band (6H) is very sensitive to subtle temperature differences, which makes it especially useful for monitoring drought conditions but less effective when measuring very hot objects. The low-gain band (6L) can handle a wider range of temperatures, making it effective at monitoring very hot areas such as deserts. The ETM+ thermal band enabled scientists to develop methods for deriving evapotranspiration rates to monitor water use in irrigated agricultural fields and in natural ecosystems.
-
Panchromatic (Band 8)
The panchromatic band captures a broad range of visible light, from 0.52 – 0.90 µm at a higher spatial resolution of 15 meters compared to the other reflective bands, which had 30-meter resolution. Pansharpening is a technique that combines the high-resolution, gray-scale panchromatic band with a lower-resolution, multispectral, three-band color composite to produce a single, high-resolution color image. Band 8 is used for detailed mapping and analyses of urban areas and land cover.

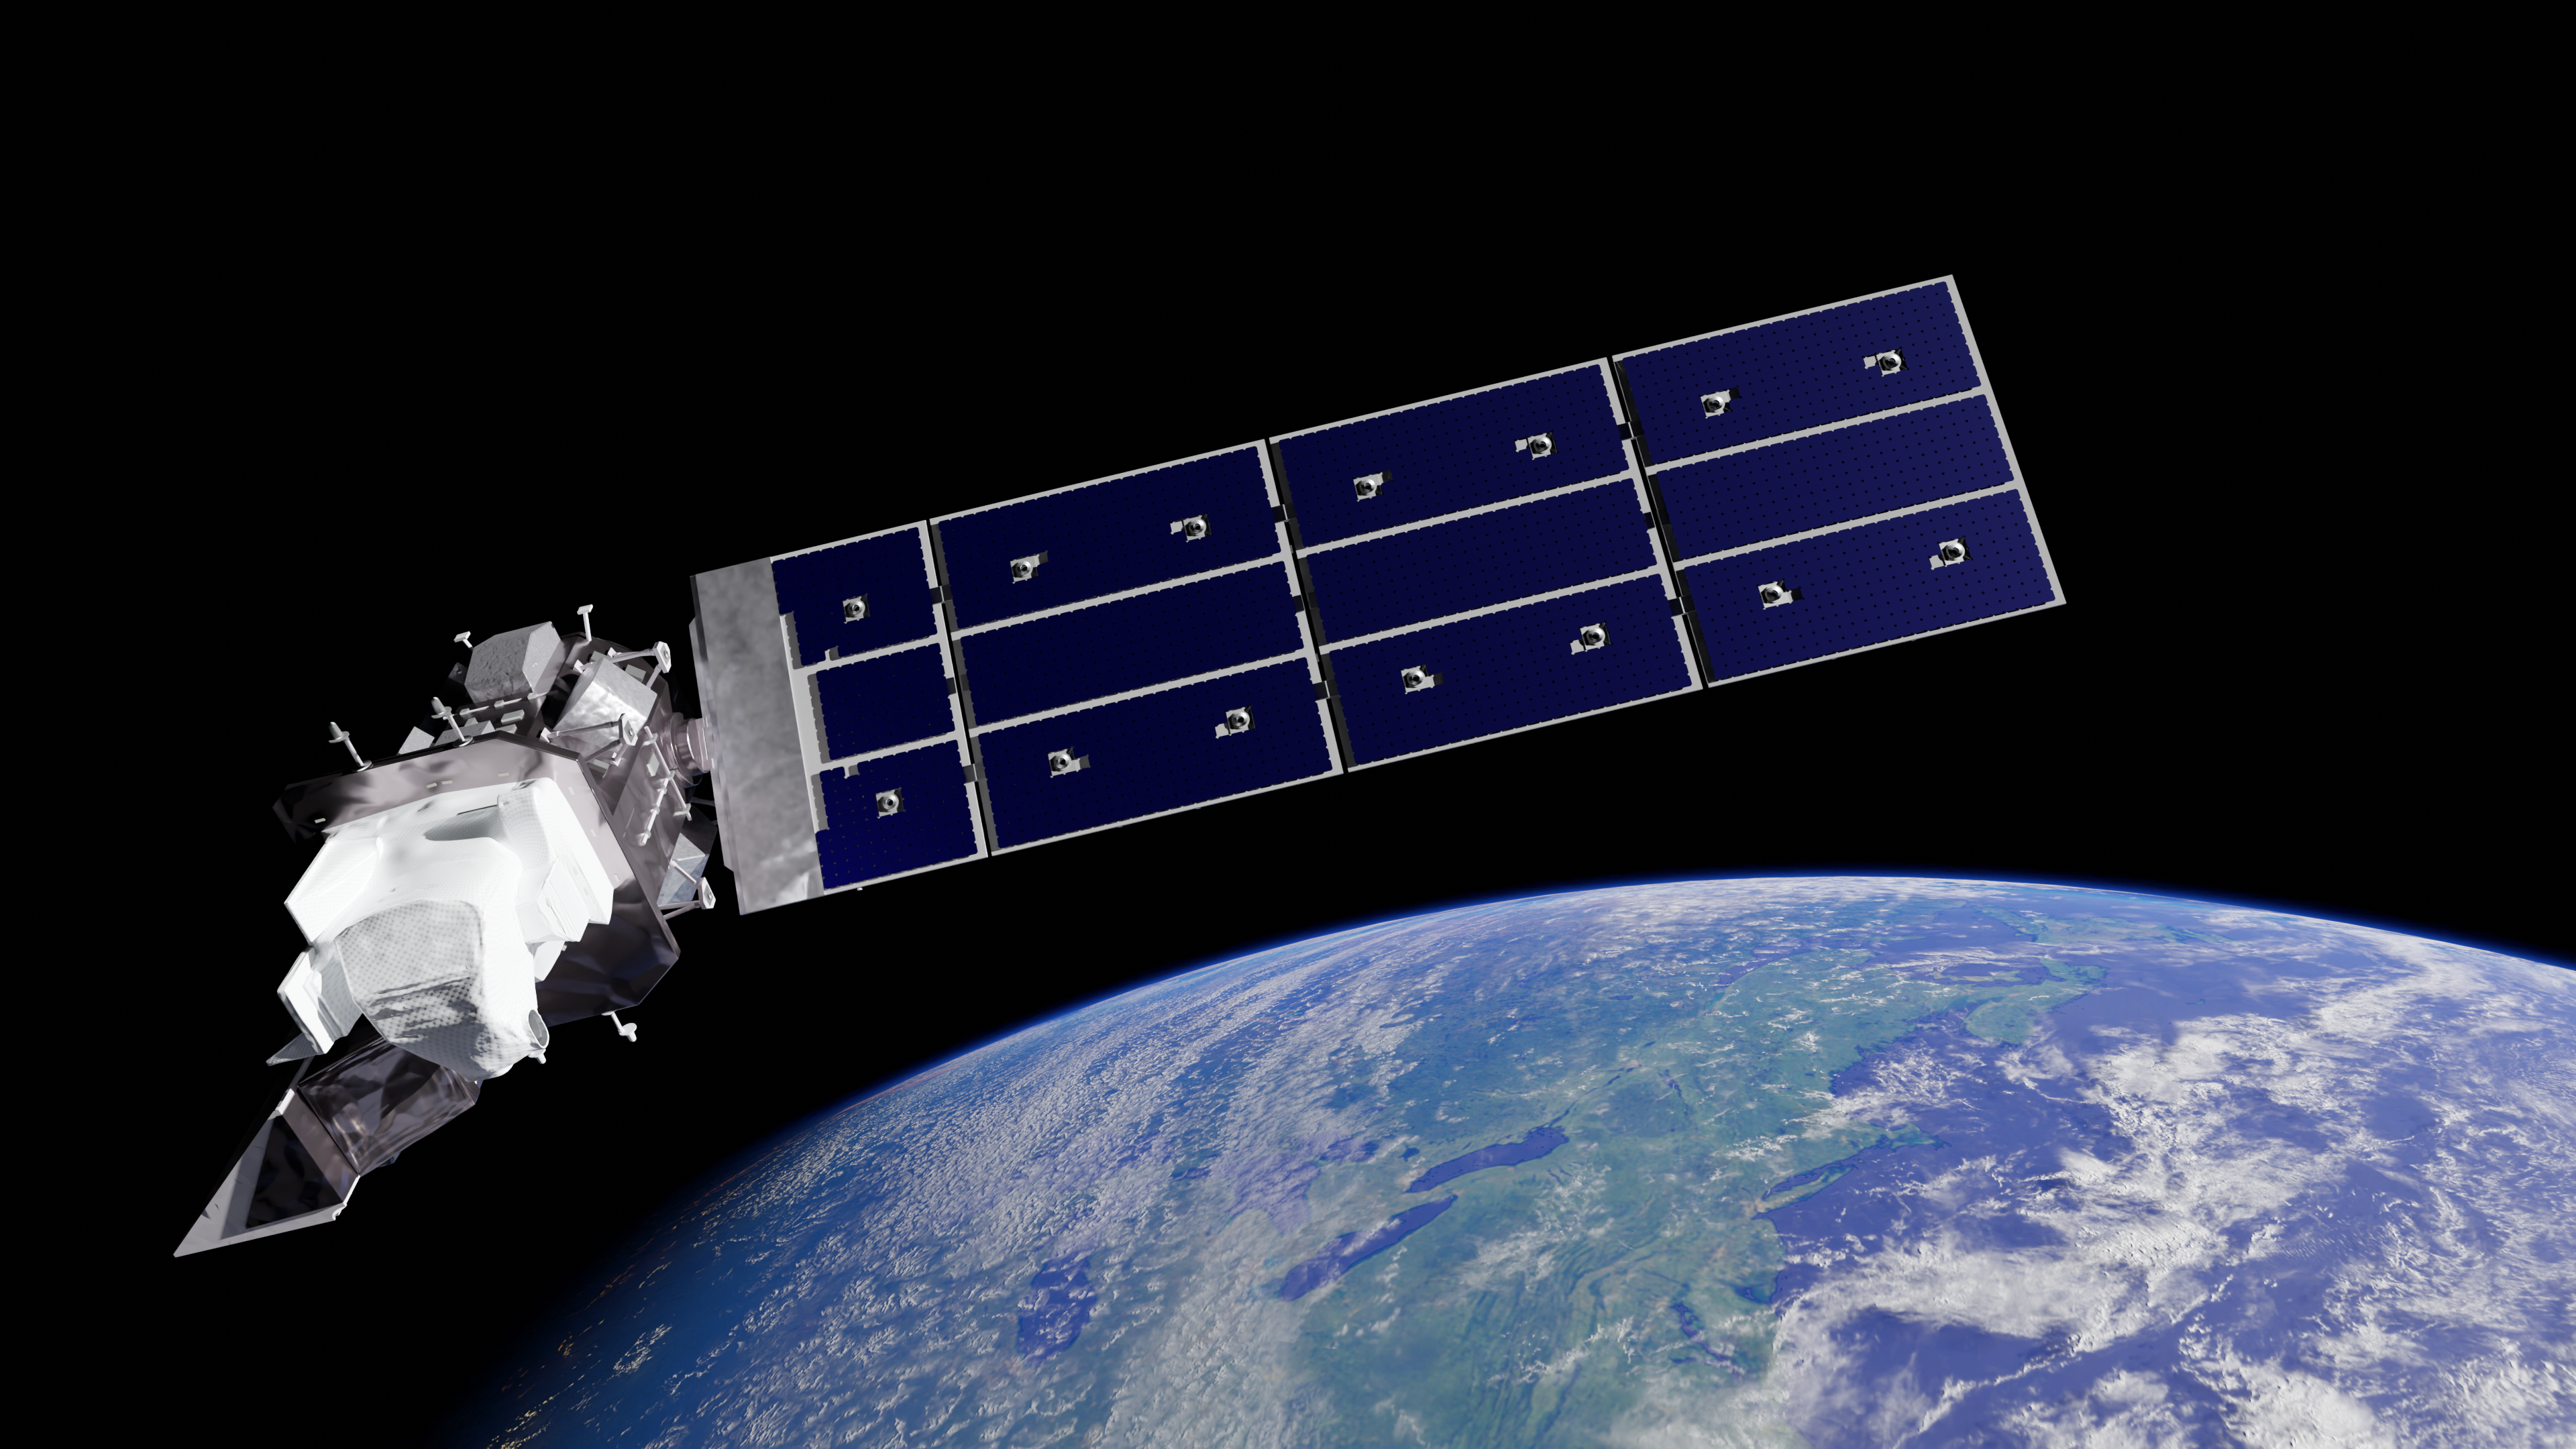
Landsat 8-9 Operational Land Imager (OLI)
The OLI aboard Landsats 8-9 introduced a coastal blue band, which expanded the monitoring of aerosols and coastal ecosystems, and a cirrus band, which allows researchers to identify hard-to-detect cirrus clouds.
| Band | Wavelength (µm) | GSD (m) |
|---|---|---|
| Band 1 - Coastal/Aerosol | 0.43-0.45 | 30 |
| Band 2 - Blue | 0.45-0.51 | 30 |
| Band 3 - Green | 0.53-0.59 | 30 |
| Band 4 - Red | 0.64-0.67 | 30 |
| Band 5 - Near-infrared (NIR) | 0.85-0.88 | 30 |
| Band 6 - Shortwave-infrared (SWIR) 1 | 1.57-1.65 | 30 |
| Band 7 - Shortwave-infrared (SWIR) 2 | 2.11-2.29 | 30 |
| Band 8 - Panchromatic | 0.50-0.68 | 15 |
| Band 9 - Cirrus | 1.36-1.38 | 30 |
-
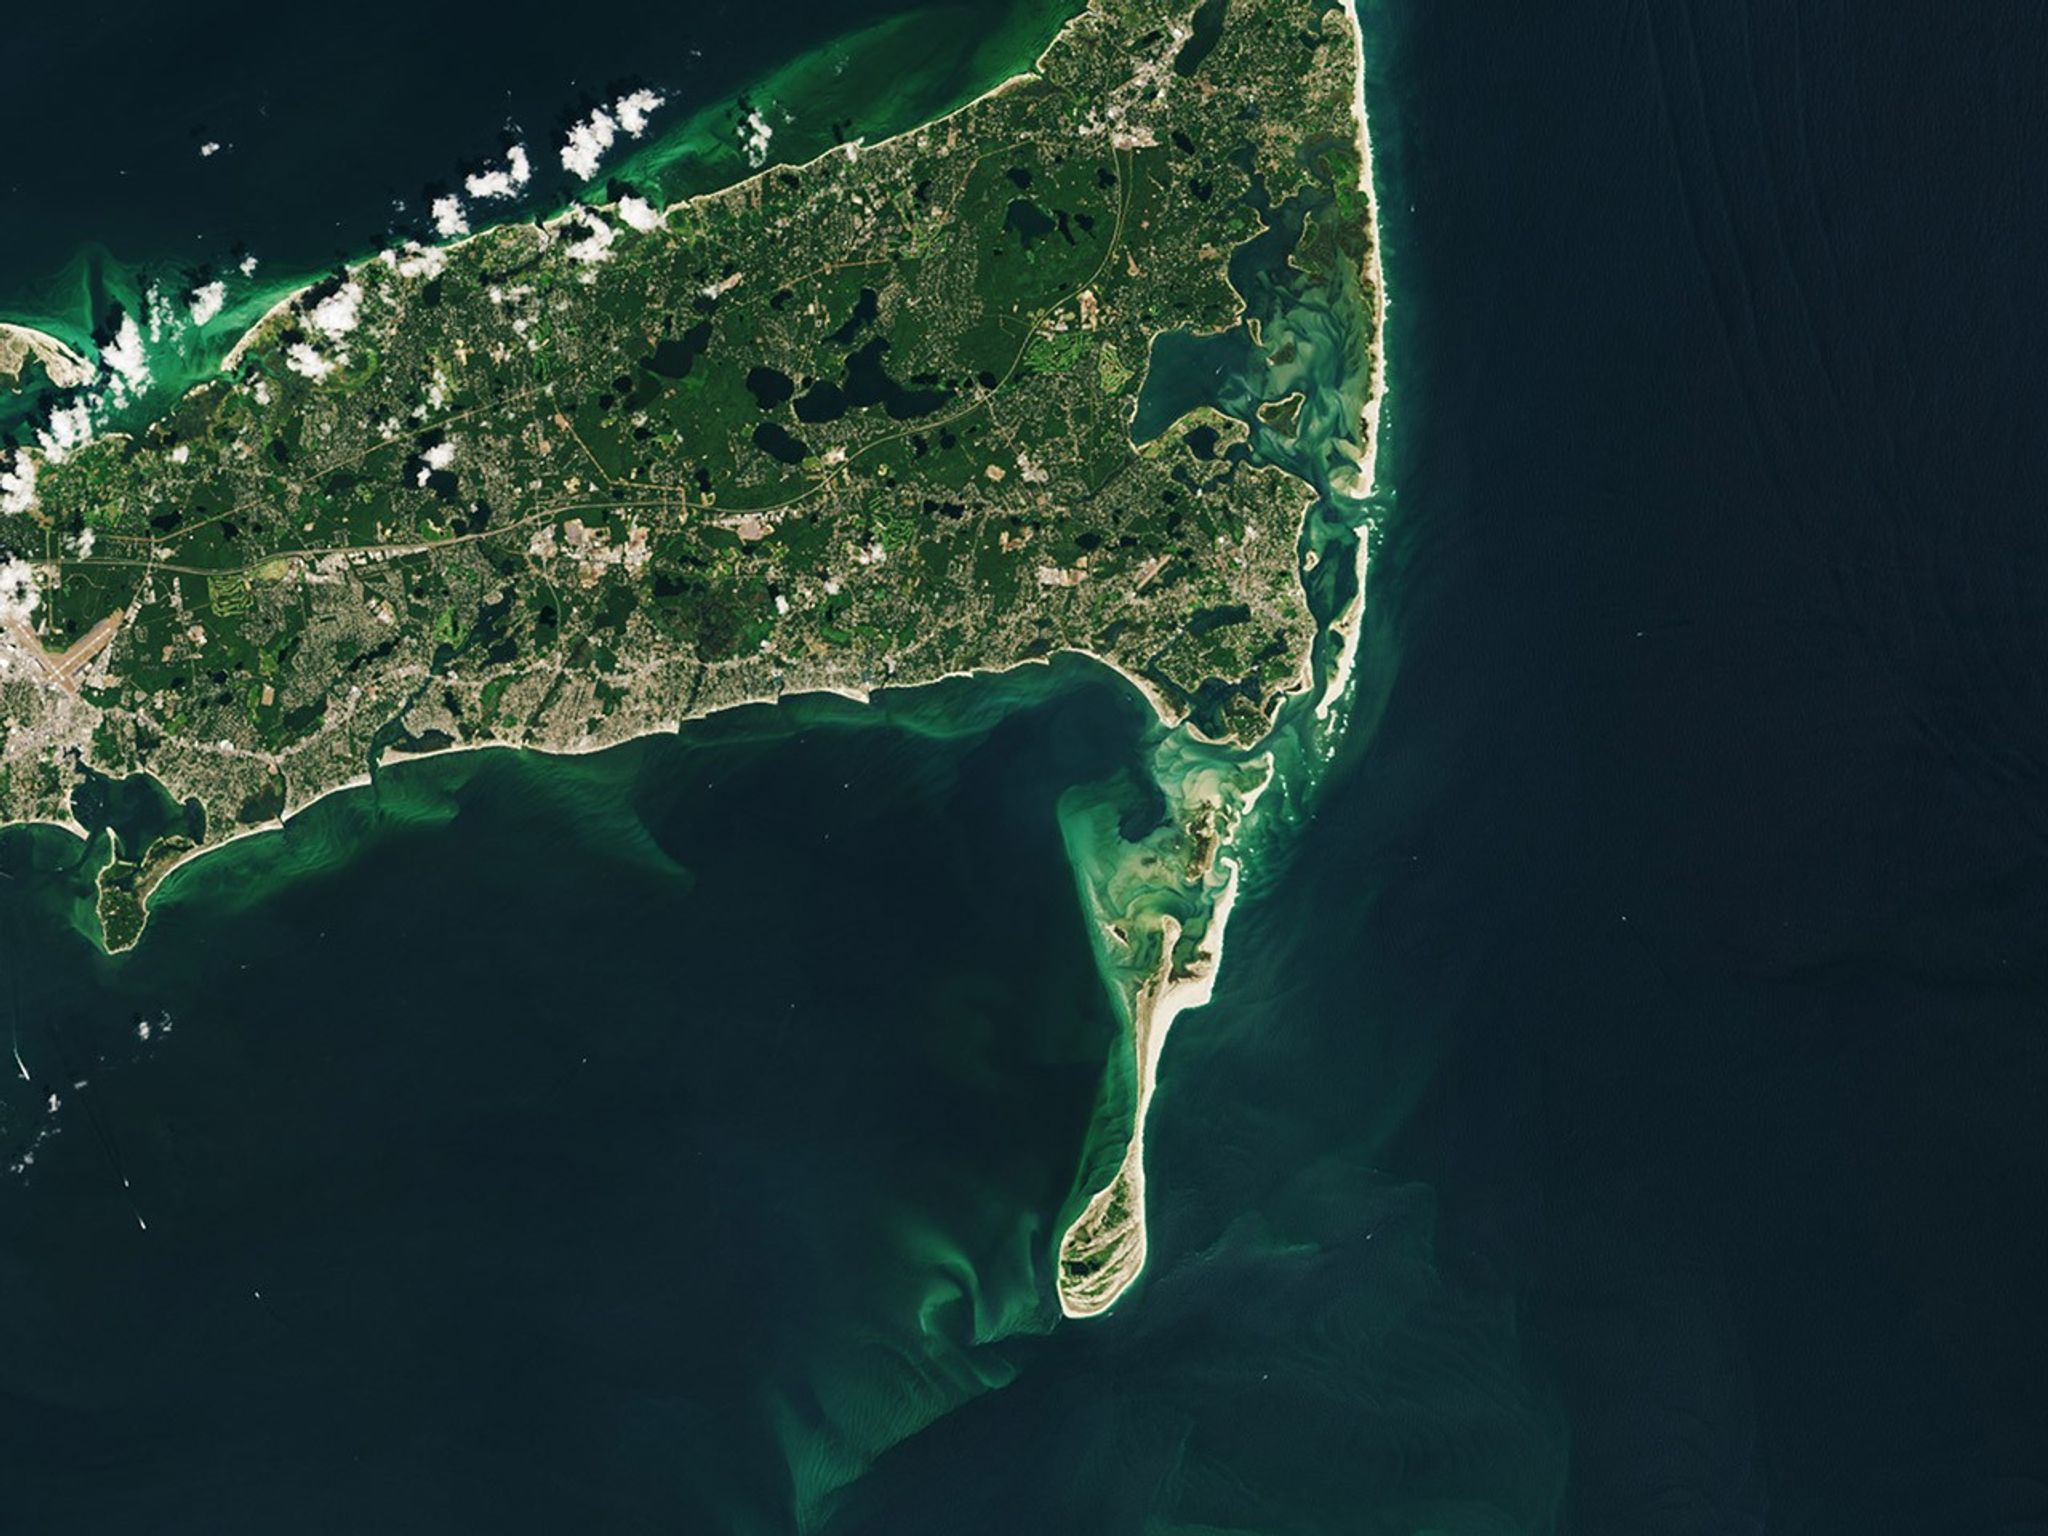
Coastal/Aerosol (Band 1)
The coastal/aerosol band senses wavelengths from 0.433 – 0.453 µm in the blue portion of the electromagnetic spectrum. Scientists use this band to monitor chlorophyll concentrations (ocean color) in coastal and shallow inland waters, helping to assess water quality and detect phytoplankton blooms. Because light at these wavelengths is scattered by small particles in the atmosphere, band 1 is also valuable for detecting aerosols such as dust, smoke, and haze.
-
Cirrus (Band 9)
The cirrus band senses wavelengths from 1.36 – 1.38 µm in the shortwave-infrared portion of the electromagnetic spectrum. These wavelengths are absorbed by water vapor, causing high, thin clouds to reflect sunlight and appear bright while land surfaces appear dark. Scientists use band 9 to detect cirrus clouds which may be difficult to detect in other spectral bands.
Landsat 8-9 Thermal Infrared Sensor (TIRS)
The TIRS aboard Landsats 8-9 was highly requested by data users working on water management. It improved Landsat’s thermal monitoring capabilities while maintaining continuity with previous Landsat missions.
| Band | Wavelength (µm) | GSD (m) |
|---|---|---|
| Band 10 - Thermal-infrared (TIR) 1 | 10.6-11.19 | 100 (resampled to 30) |
| Band 11 - Thermal-infrared (TIR) 2 | 11.50-12.51 | 100 (resampled to 30) |
-
Thermal-infrared (Bands 10 & 11)
The two thermal-infrared bands sense wavelengths from 10.6 – 11.2 µm (band 10) and 11.5 – 12.5 µm (band 11). Bands 10 and 11 detect the radiation emitted by objects on the Earth’s surface, enabling scientists to measure and track land surface temperature. These data are crucial for monitoring land and water usage, studying urban heat islands, assessing crop and vegetation health, understanding global energy balance, and tracking natural events like wildfires and volcanic eruptions.

Selected Publications
Barsi, J., Lee, K., Kvaran, G., Markham, B., & Pedelty, J. (2014). The spectral response of the Landsat-8 Operational Land Imager. Remote Sensing, 6(10), 10232–10251. https://doi.org/10.3390/rs61010232
Ormsby, J. P. (1982). The use of Landsat-3 thermal data to help differentiate land covers. Remote Sensing of Environment, 12(2), 97–105. https://doi.org/10.1016/0034-4257(82)90029-3
Qiu, S., Zhu, Z., & Woodcock, C. E. (2020). Cirrus clouds that adversely affect Landsat 8 images: What are they and how to detect them? Remote Sensing of Environment, 246, 111884. https://doi.org/10.1016/j.rse.2020.111884
Wulder, M. A., Roy, D. P., Radeloff, V. C., Loveland, T. R., Anderson, M. C., Johnson, D. M., Healey, S., Zhu, Z., Scambos, T. A., Pahlevan, N., Hansen, M., Gorelick, N., Crawford, C. J., Masek, J. G., Hermosilla, T., White, J. C., Belward, A. S., Schaaf, C., Woodcock, C. E., & Huntington, J. L. (2022). Fifty years of Landsat science and impacts. Remote Sensing of Environment, 280, 113195. https://doi.org/10.1016/j.rse.2007.07.004