


Disaster Management
When disaster strikes, Landsat offers a critical bird’s-eye view to help prepare communities, assess damage, and coordinate response efforts.
Landsat's Role in Responding to Disasters
In 2022, the Emergency Events Database (EM-DAT) reported 387 natural hazards and disasters worldwide, resulting in the loss of over 30,000 lives and affecting more than 185 million individuals. Economic losses totaled around US$223.8 billion. Fires, floods, heat waves, drought, hurricanes, tornadoes, and other natural disasters can be particularly tragic and costly when critical facilities such as power plants, airports, roads, and hospitals are threatened. When a disaster strikes, remote sensing is often the only way to get a big-picture view of what is happening on the ground.
With its consistent, reliable, repeated observations of Earth’s changing surface, Landsat keeps a record of Earth’s land surfaces before and after disasters, serving as an essential tool for assessing risk, mapping the extent of damage, and planning post-disaster recovery. Landsat produces 185-kilometer-wide images with 30-meter resolution in visible and infrared wavelengths of light, making it possible to map impacts on the landscape in ways otherwise not visible to human sight. For example, Landsat sensors enable us to see the heat from fires both during and after the burns, and the lava flows from volcanic eruptions even when gaseous substances obscure the view to human eyes.
Designed, built, and launched by NASA, Landsat satellites have recorded global ecosystem conditions every year since 1972. The U.S. Geological Survey provides this valuable data to the public at no cost. Landsat observations continue into the future with the Landsat 9 satellite launched on Sept. 27, 2021.

Landsat and Natural Disasters PDF
Landsat Data for Local and Global Decision-making
- Mitigating damage from fire
- Quantifying the extent of floods
- Tracking rock avalanches and glacial lake growth
- Observing severe drought
- Mapping the impacts of volcanic eruptions
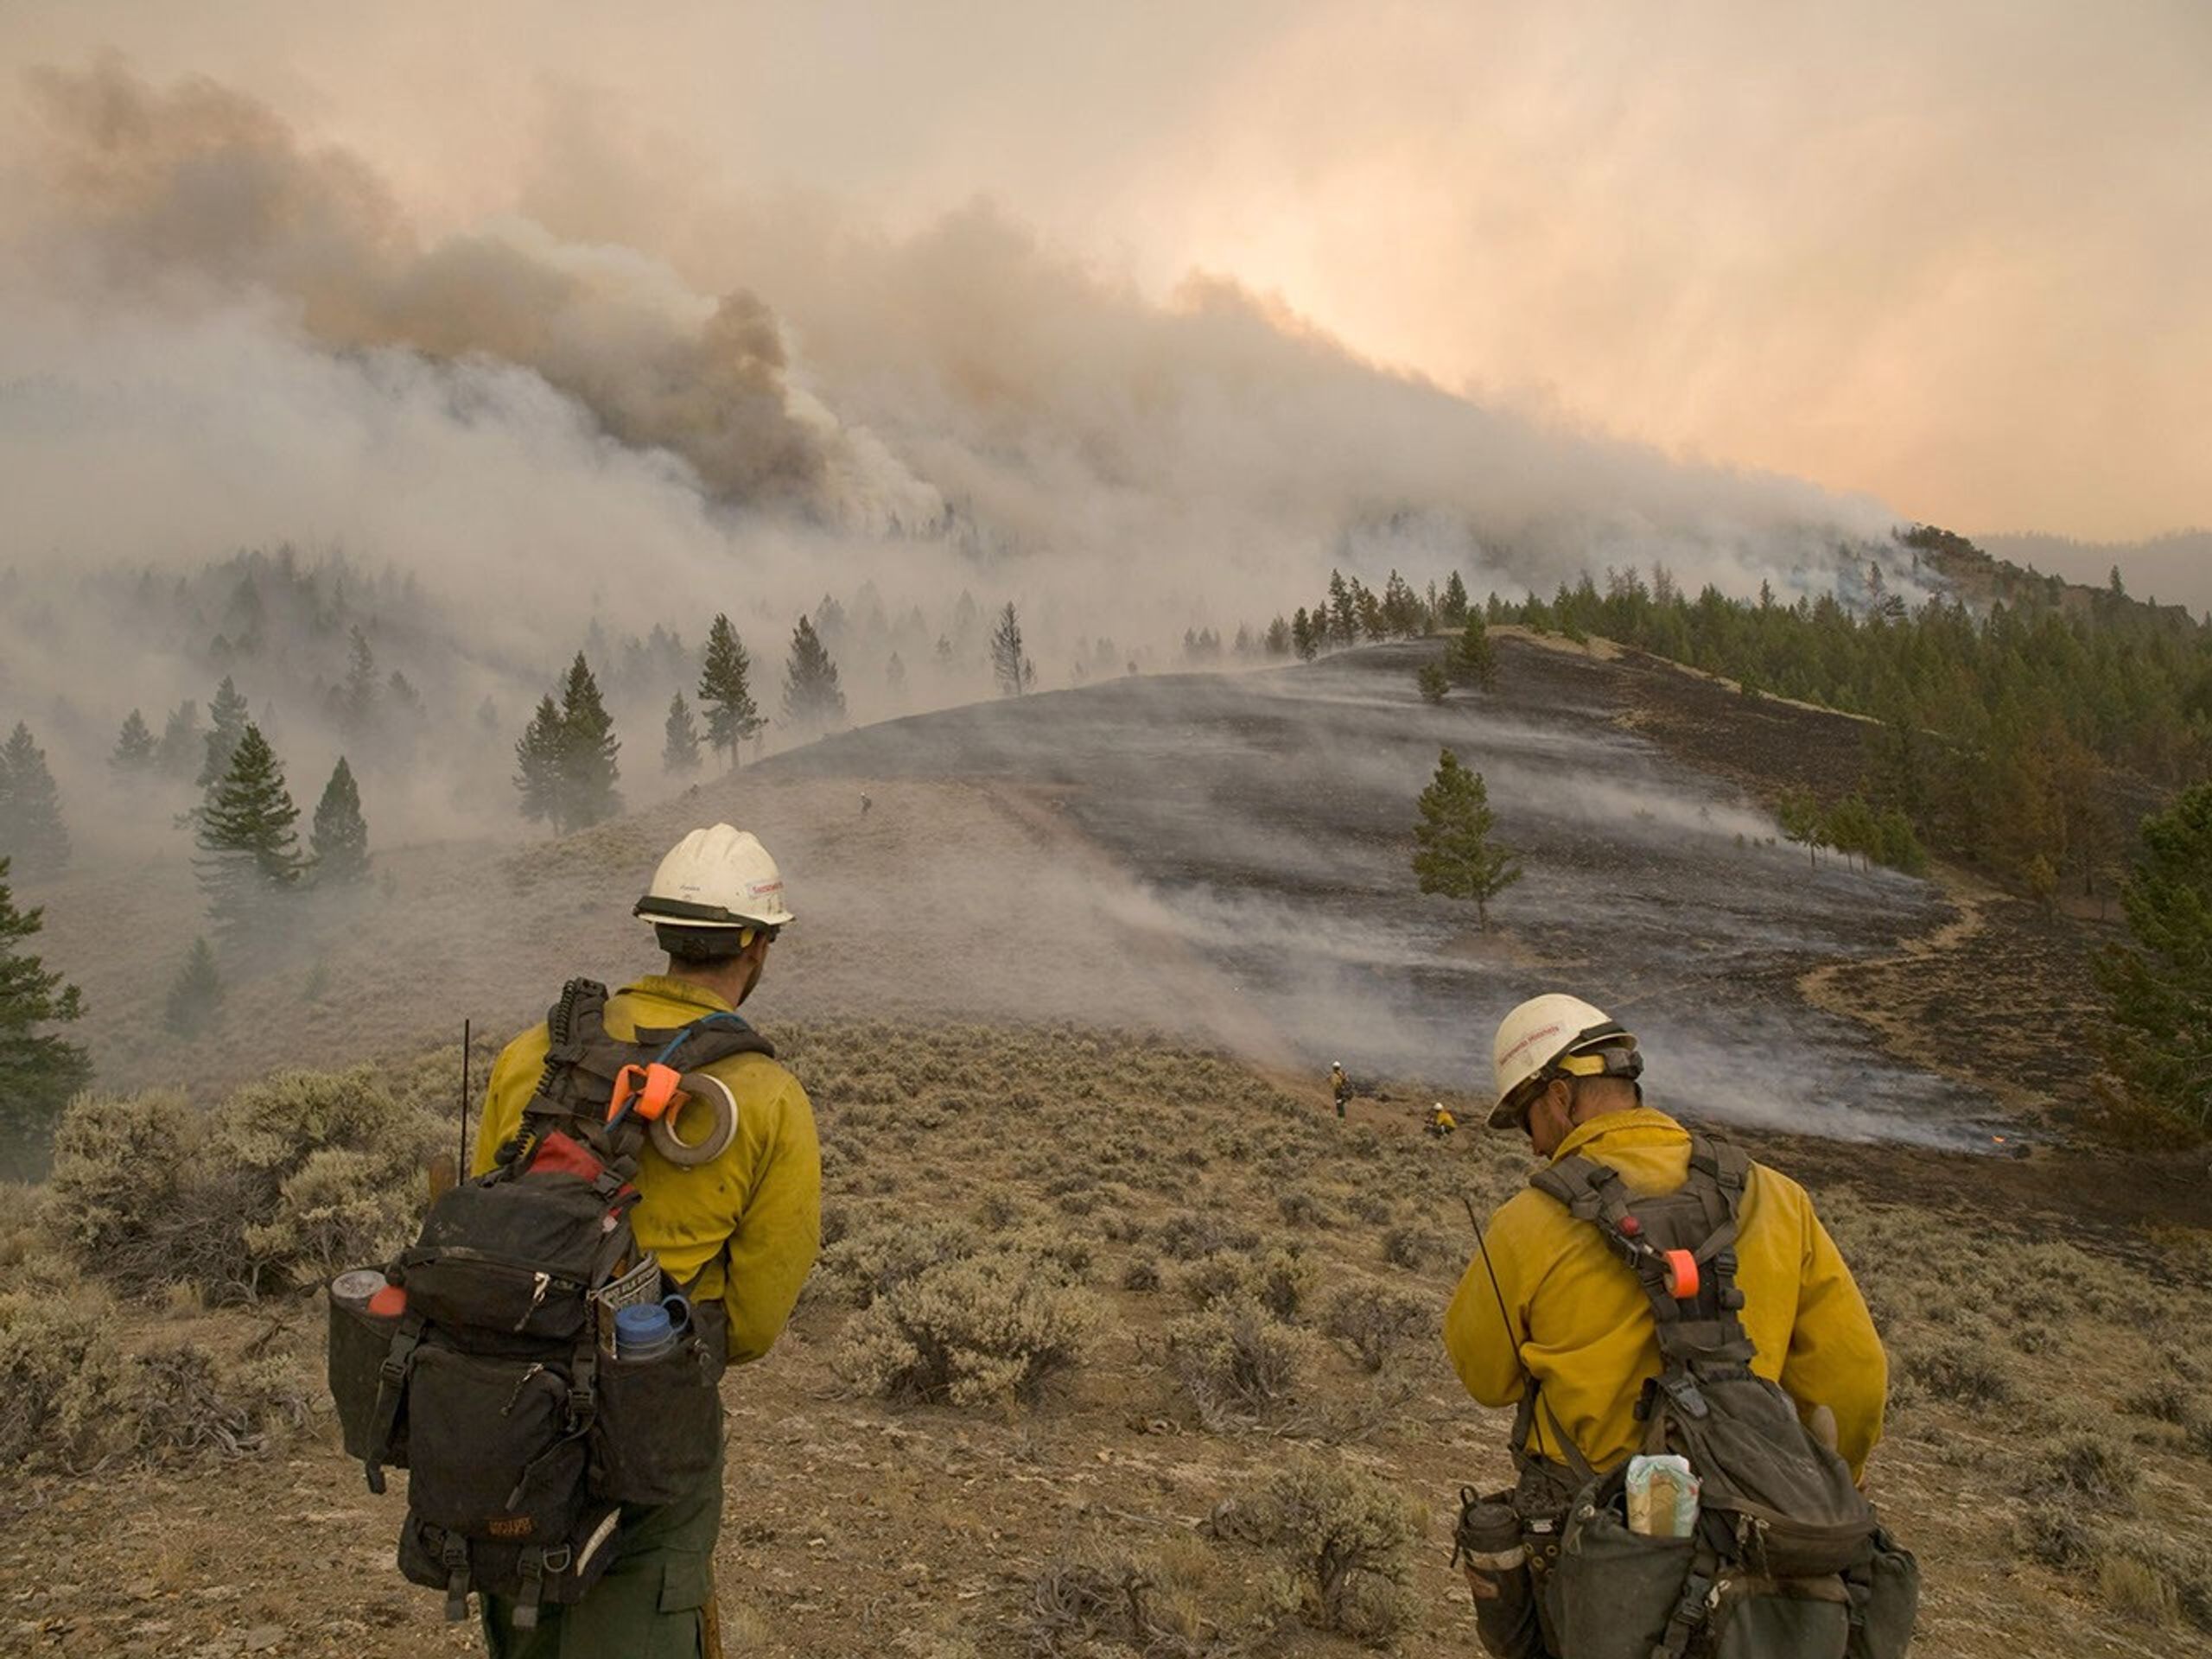
Mitigating Damage from Fire
Landsat data enable natural resource managers to assess the severity and extent of large fires for planning recovery efforts. For example, the U.S. Forest Service’s Burned Area Emergency Response team uses Landsat data to map vegetation, water and soil changes after a fire. With these maps the staff can identify the areas that have been burned most severely, and treat them to mitigate increased runoff and erosion.
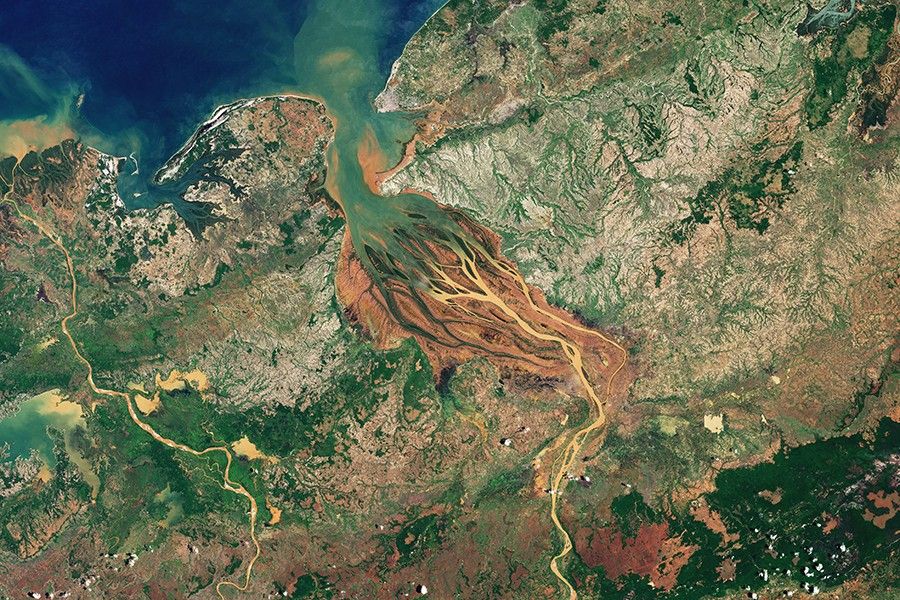
Quantifying the Reach of Floods
Landsat data is regularly contributed to the International Disaster Charter to enable timely disaster response, including flood mapping. By using Landsat to map historic flooding patterns, USGS hydrologists can better predict future flood hazards, and the joint-agency SERVIR program relies heavily on Landsat for both historic flood analysis and near-real-time flood monitoring.
Tracking rock avalanches and glacial lake growth
In 2020, a Landsat-based study showed that the volume of glacial lakes had increased by 50% globally, since 1990. This information feeds into assessments of hazard potential for communities downstream. Glacial lake outburst floods have been responsible for thousands of deaths and the destruction of entire villages. Landsat data has also shown an increase of rock avalanches in Alaska’s Glacier Bay National Park as temperatures warm.
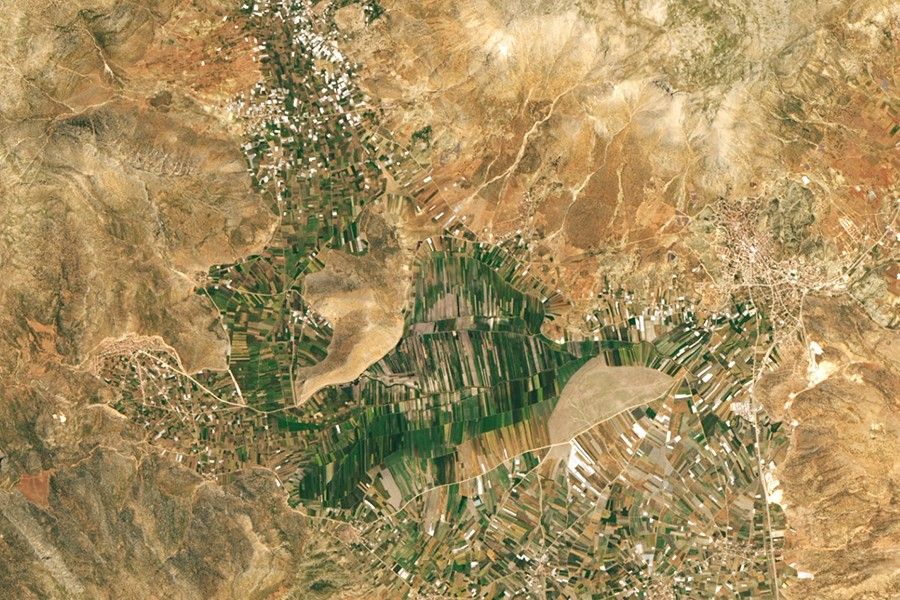
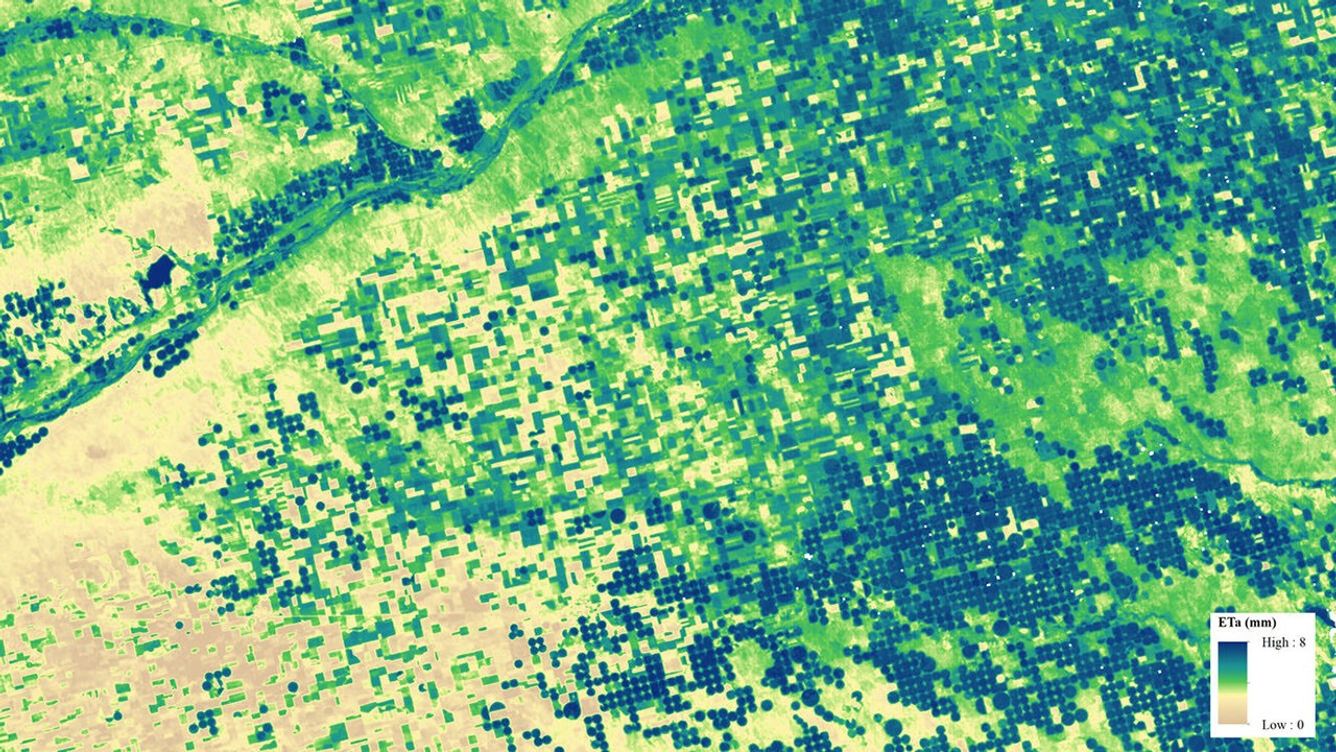
Observing Severe Drought
Droughts are now considered the most severe natural hazard worldwide. Landsat data shows the impact of drought on vegetation at a scale that enables water managers to better allocate limited water resources. As climate change exacerbates drought conditions, successful water allocation has become a key adaptation strategy. From Australia's Murray-Darling Basin to the Western U.S., Landsat's ability to detect light in visible, near-infrared, shortwave-infrared and thermal infrared wavelengths provides key insights for drought mitigation.
Mapping the Results of Volcanic Eruptions
The International Disaster Charter routinely ingests Landsat volcano imagery from around the world for hazard monitoring. Additionally, Landsat’s long data archive, enables researchers like the U.S. Forest Service’s Sean Healey to monitor forest recovery in the blast zone of places like Mount St. Helens. Healey remarks, “The really unique part about the Landsat record is the fact that it goes back to the ‘70s. I can’t imagine what it would be like to describe what this volcano did without having a time series of Landsat. There is no other asset in the sky that can show us what Landsat does in terms of the effect of this eruption and also the effect of recovery following the eruption.”
Related Resources
- Burned Area Emergency Response
- Mapping Past Floods to Help Predict Future Ones
- SERVIR Global
- Global Survey Using Landsat Shows Dramatic Growth of Glacial Lakes
- OpenET
Latest News
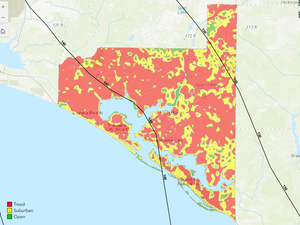
Landsat-based National Land Cover Database (NLCD) helps predict hurricane wind risk to homes and other structures.
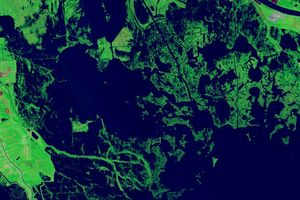
Landsat images show that in the past 40 years alone, Louisiana’s coastal wetlands have undergone substantial changes.
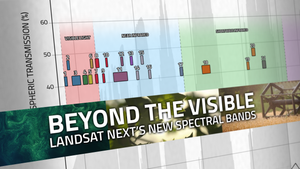
With Landsat Next’s 26 new spectral bands, we’ll be able to see our planet like never before. Landsat Next’s enhanced…