


2014 Temperatures From A Regional Perspective
NASA and NOAA announced today that 2014 brought the warmest global temperatures in the modern instrumental record. But what did the year look like on a more regional scale?
According to the Met Office, the United Kingdom experienced it warmest year since 1659. Despite the record-breaking temperatures, however, no month was extremely warm. Instead, each month (with the exception of August) was consistently warm. The UK was not alone. Eighteen other countries in Europe experienced their hottest year on record, according to Vox.
The contiguous United States, meanwhile, only experienced the 34th warmest year since 1895, according to a NOAA analysis. The Midwest and the Mississippi Valley were particularly cool, while unusually warm conditions gripped the West. California, for instance, went through its hottest year on record. Meanwhile, temperatures in Alaska were unusually warm; in Anchorage, temperatures never dropped below 0 degrees Fahrenheit.
James Hansen, a retired NASA scientist, underscored this point in an update on his Columbia University website: “Residents of the eastern two-thirds of the United States and Canada might be surprised that 2014 was the warmest year, as they happened to reside in an area with the largest negative temperature anomaly on the planet, except for a region in Antarctica.”
According to Australia’s Bureau of Meteorology, 2014 was the third warmest year on record in that country. “Much of Australia experienced temperatures very much above average in 2014, with mean temperatures 0.91°C above the long-term average,” said the bureau’s assistant director of climate information services.
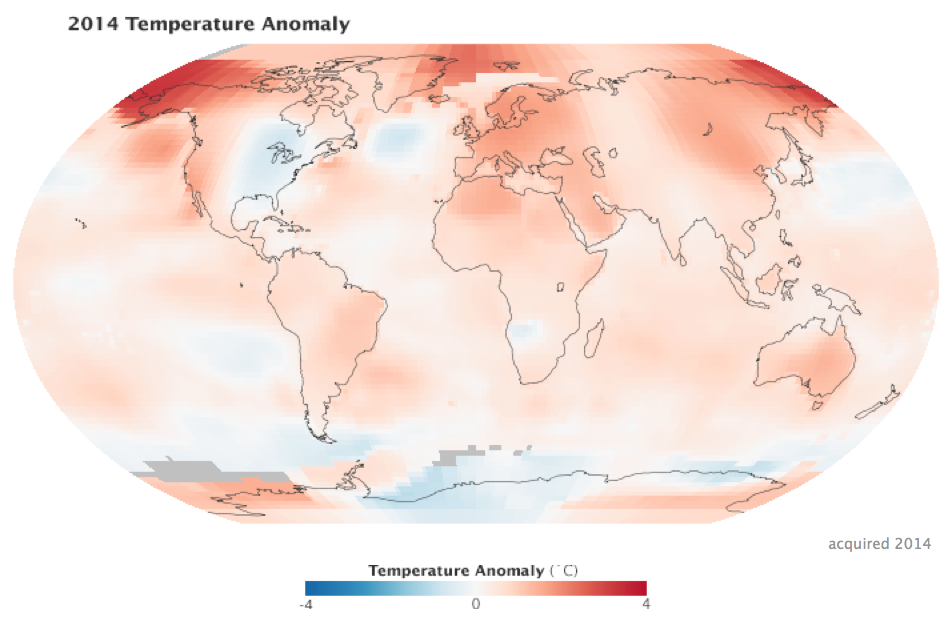
The map at the top of this page depicts global temperature anomalies in 2014. It does not show absolute temperatures, but instead shows how much warmer or cooler the Earth was compared to a baseline average from 1951 to 1980. Areas that experienced unusually warm temperatures are shown in red; unusually cool temperatures are shown in blue.