9 min read

CubeSats are small. Very small. So small, in fact, they can be held in the palm of your hand. They range in size from a pint of ice cream, to a loaf of bread, to a large cereal box. Inside each of these small satellites you’ll find electronics, instrument components, and radios for communication just like in other satellites. But these tiny satellites are different and NASA’s Earth Science Division is using them to advance what is possible.
NASA is continually developing new technologies to improve our knowledge about Earth – technologies that are smaller than ever before, components that could improve our measurements, on-board data processing systems that streamline data retrievals, or new methods for gathering observations. Each new technology is thoroughly tested in a lab, sometimes on aircraft, or even at remote sites across the world. But the space environment is different than Earth. To know how something is going to operate in space, testing in space is the best option.
Sending something unproven to orbit has traditionally been a risky endeavor, but CubeSats have helped to change that. The diminutive satellites typically take less than two years to build. Most American rocket launches contain CubeSats as a secondary payload, greatly reducing the cost of launching. These hitchhikers can be deployed from the rocket or can be sent to the International Space Station and later deployed from there.
Because of the quick development time and easy access to space, CubeSats have become the perfect platform for demonstrating how a new technological advancement will perform in orbit. All of this helps to ensure that NASA’s Earth-observing missions will reliably be able to collect cutting-edge data.
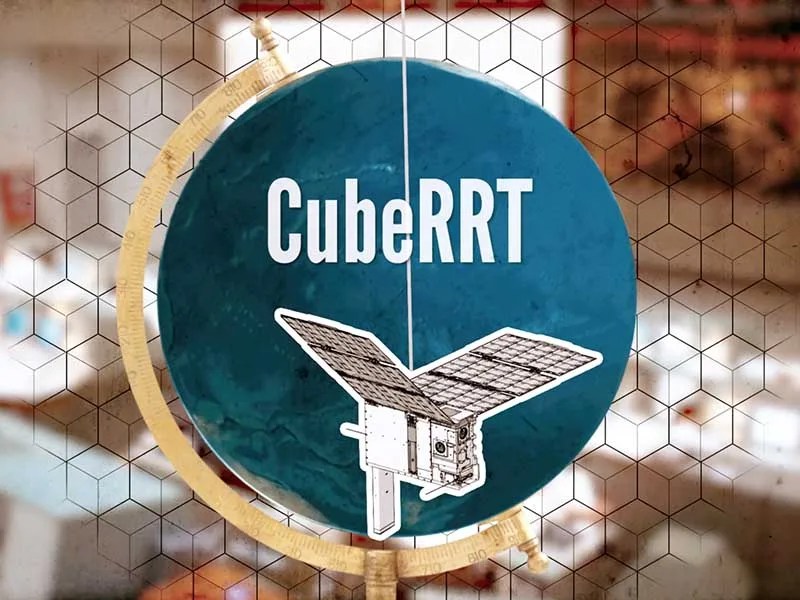
When a satellite the size of a cereal box launched on May 21, 2018, its goal was to test a small component designed to detect and filter radio frequency interference (RFI), eventually benefiting future satellite missions.
Radio frequency interference (RFI) is everywhere. Sources include cellphones, radio and TV transmissions, satellite broadcasts and other sources. You may recognize it as that annoying static when you can’t seem to get your favorite radio station to come in clearly because another station is nearby on the dial.
The same interference that causes radio static also affects the quality of data that instruments like microwave radiometers collect. As the number of RFI-causing devices increases globally, NASA’s satellite instruments – specifically, microwave radiometers that gather data on soil moisture, meteorology, climate and more – will be more challenged in collecting high-quality data.
That’s where CubeSat Radiometer Radio frequency interference Technology (CubeRRT) came in. The small satellite tested a new technology to detect and filter any RFI the satellite encounters in real-time from space. This will reduce the amount of data that needs to be transmitted back to Earth – increasing the quality of important weather and climate measurements.
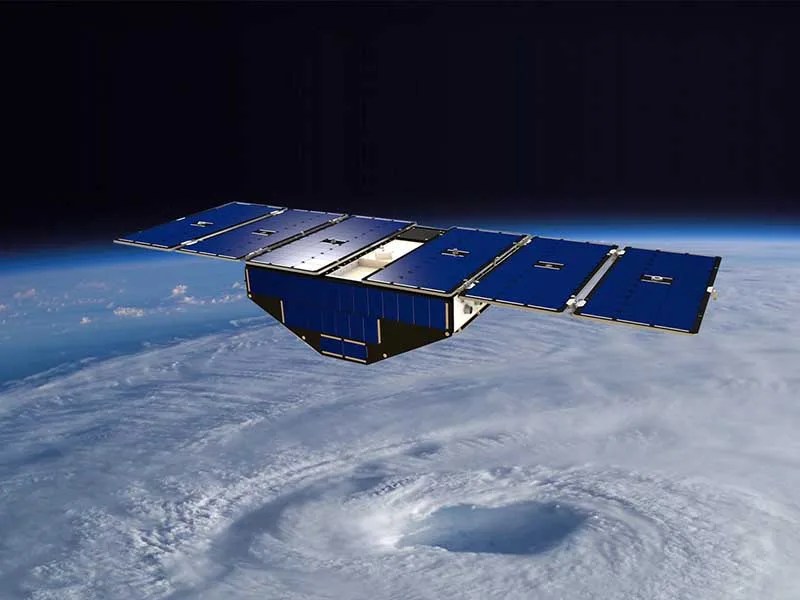
NASA's Cyclone Global Navigation Satellite System (CYGNSS) keeps an unprecedented watch over the hurricane season from low-Earth orbit. The constellation of microsatellite spacecraft, built and operated by Southwest Research Institute (SwRI), gathers data to help the weather forecasting community improve existing storm prediction models.
Flying in formation, the CYGNSS small satellites continuously monitor surface winds over the oceans across Earth's tropical hurricane-belt latitudes. Each satellite is capable of capturing four wind measurements per second, adding as many as 32 wind measurements per second for the entire constellation.
Radar from weather satellites has difficulty measuring through heavy clouds near the center of a hurricane. CYGNSS, however, fills that crucial gap. The microsatellites work by receiving GPS satellite signals, which can penetrate even the heaviest cloud cover straight into the eyewall to gather data about a storm’s intense inner core.
The GPS and microsatellite technology used for CYGNSS has enabled observations from before and after flooding from hurricanes, and near-surface soil moisture over the Amazon Basin.
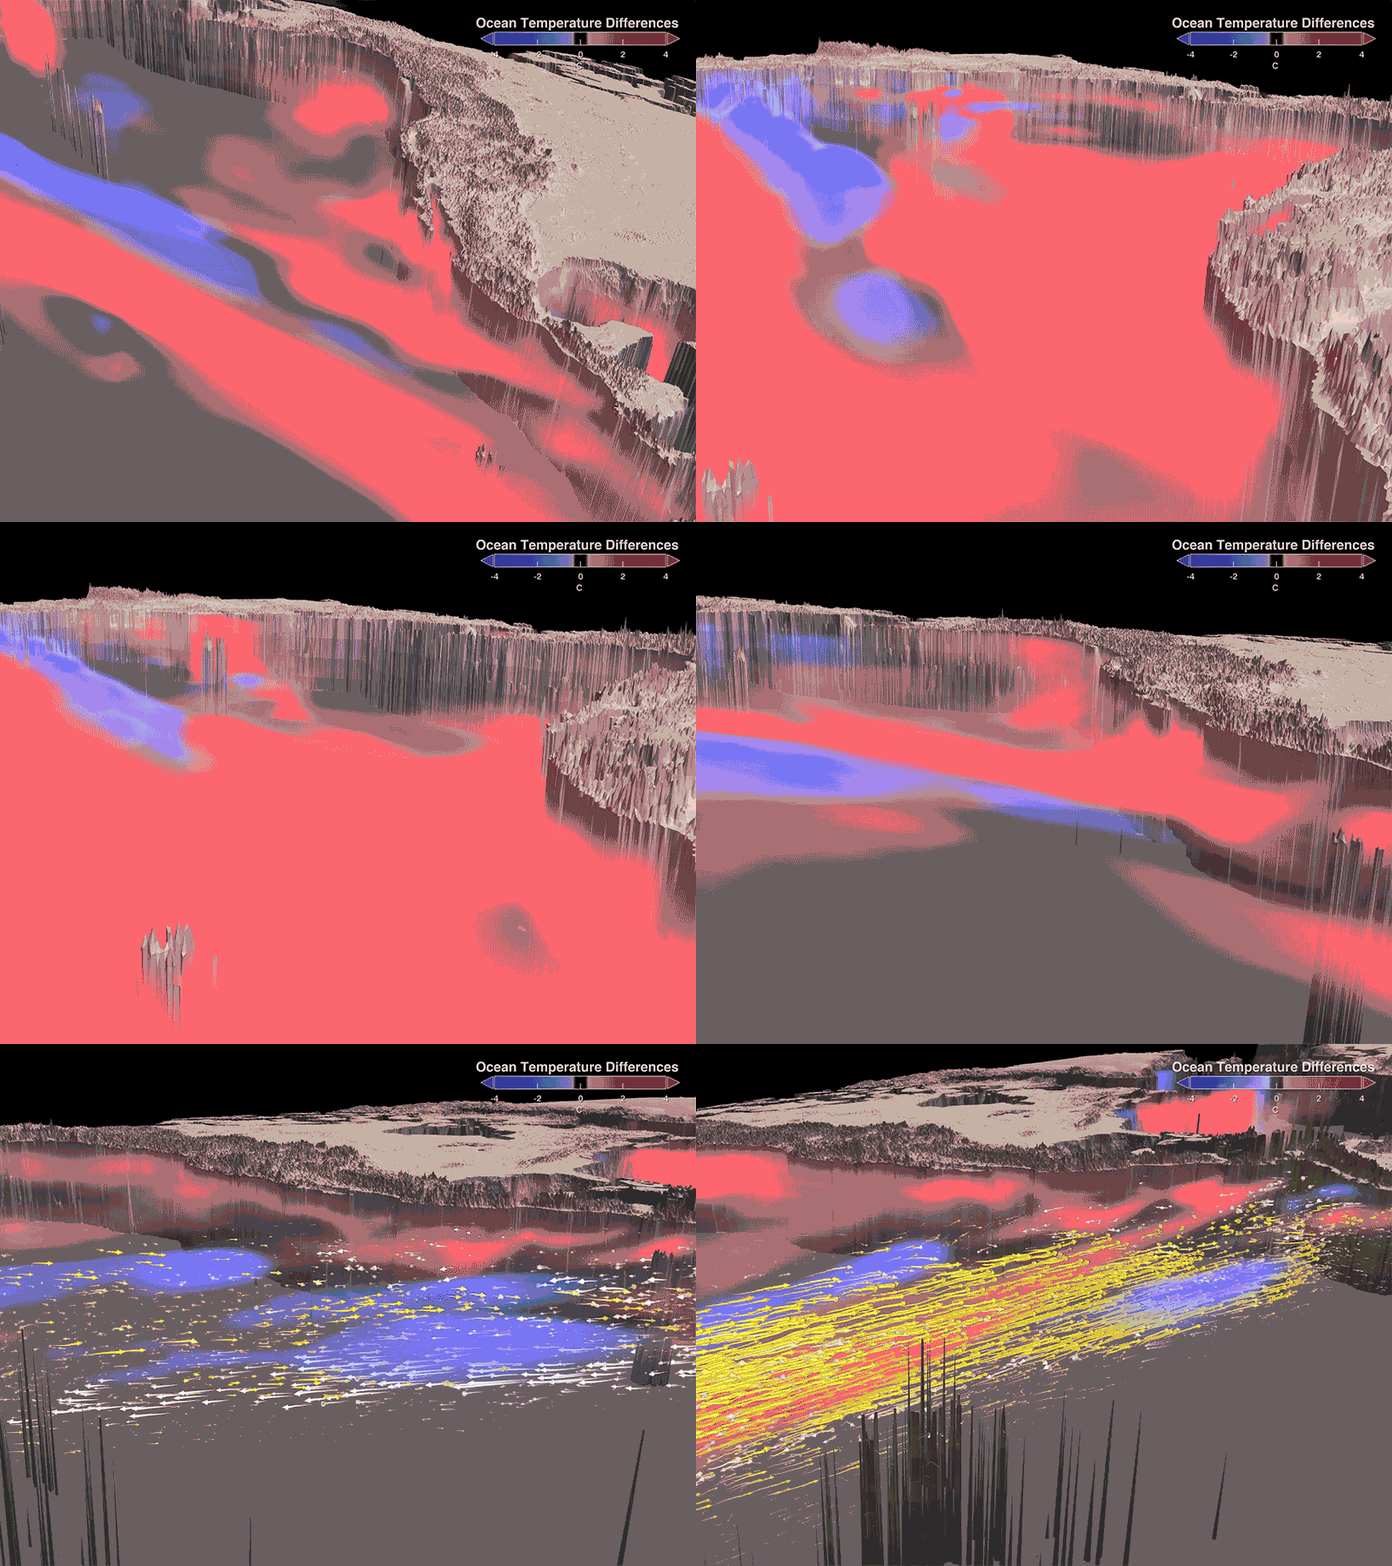
Visualizations like this one, showing the 2015-16 El Niño, are made possible by combining data from NASA spacecraft and the computing power able to process vast amounts of data.
Typical desktop computers have four to eight processor cores; the supercomputer used to process this visualization has 90,000 processor cores. This Discover supercomputer, part of the NASA Center for Climate Simulation at Goddard Space Flight Center, is currently capable of 3.5 petaflops (that’s 3,500 trillion) of operations a second.
Discover is expanding to 108,000 processor cores. With the upgrades, Discover will have a combined peak performance of over 5 petaflops per second. These improvements will not only allow researchers to keep up with the increasing amount of Earth observing data to better understand our dynamic planet, but NASA visualizers will also have the information necessary to convey the science.
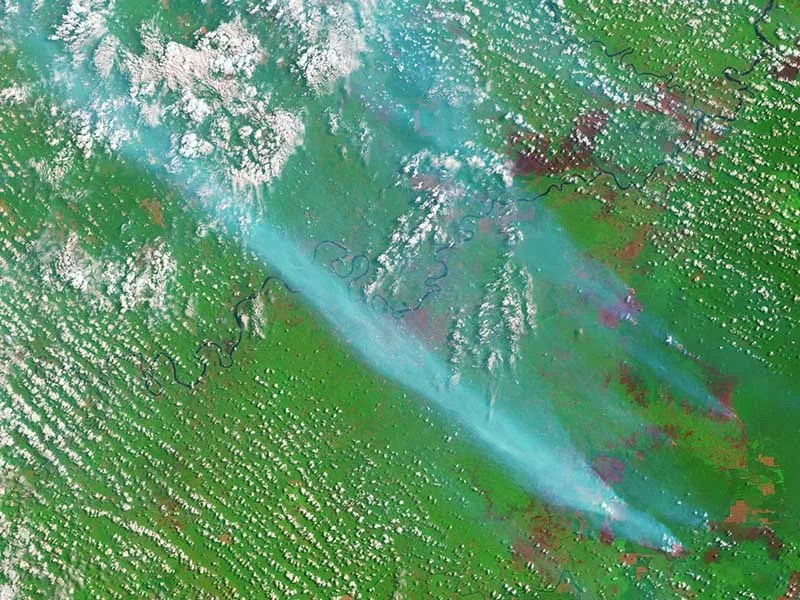
Researchers have “taught” a computer to help them better understand the impacts of forest fires. A team from NASA’s Ames Research Center, in California’s Silicon Valley, and the University of Minnesota is applying artificial intelligence (AI) techniques to satellite data to map the effects of tropical forest fires — like the 2015 Sumatra fire in this photo.
Using machine learning, an approach to AI, the researchers developed a method that trains a computer to distinguish burned from unburned pixels in NASA satellite imagery of tropical forests. With that information, it can produce a map of fire activity.
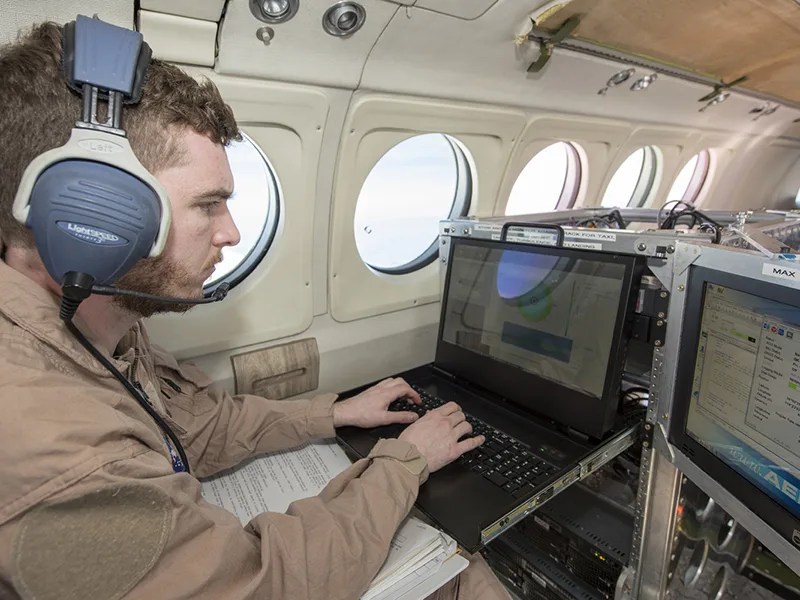
NASA scientists are hard at work trying to unlock mysteries of Earth’s ocean surface currents and winds using a new radar instrument called DopplerScatt.
Ocean currents and winds form a never-ending feedback loop: winds blow over the ocean's surface, creating currents. At the same time, the hot or cold water in these currents influences the wind's speed. Understanding the relationship between the two phenomena is crucial to understanding Earth's changing climate. Gathering data on this interaction can also help people track oil spills, plan shipping routes and understand ocean productivity in relation to fisheries.
DopplerScatt, developed by NASA's Jet Propulsion Laboratory in Pasadena, California, provides a new capability to measure both winds and currents simultaneously.
Flying aboard a B200 King Air aircraft, DopplerScatt is a spinning radar that "pings" the ocean's surface, allowing it to take measurements from multiple directions at once.
Like a highway patrol officer's speed gun, the DopplerScatt instrument calculates the Doppler effect of a radar signal bouncing off an object. As that object moves closer or farther away, it detects these changes and figures out its speed and trajectory. Those measurements are combined with data from a scatterometer, which detects the reflection of the radar signal from the ocean's surface. The more "scattering" the radar observes, the rougher the waves. From the roughness and orientation of the waves, wind speed and direction can be calculated.
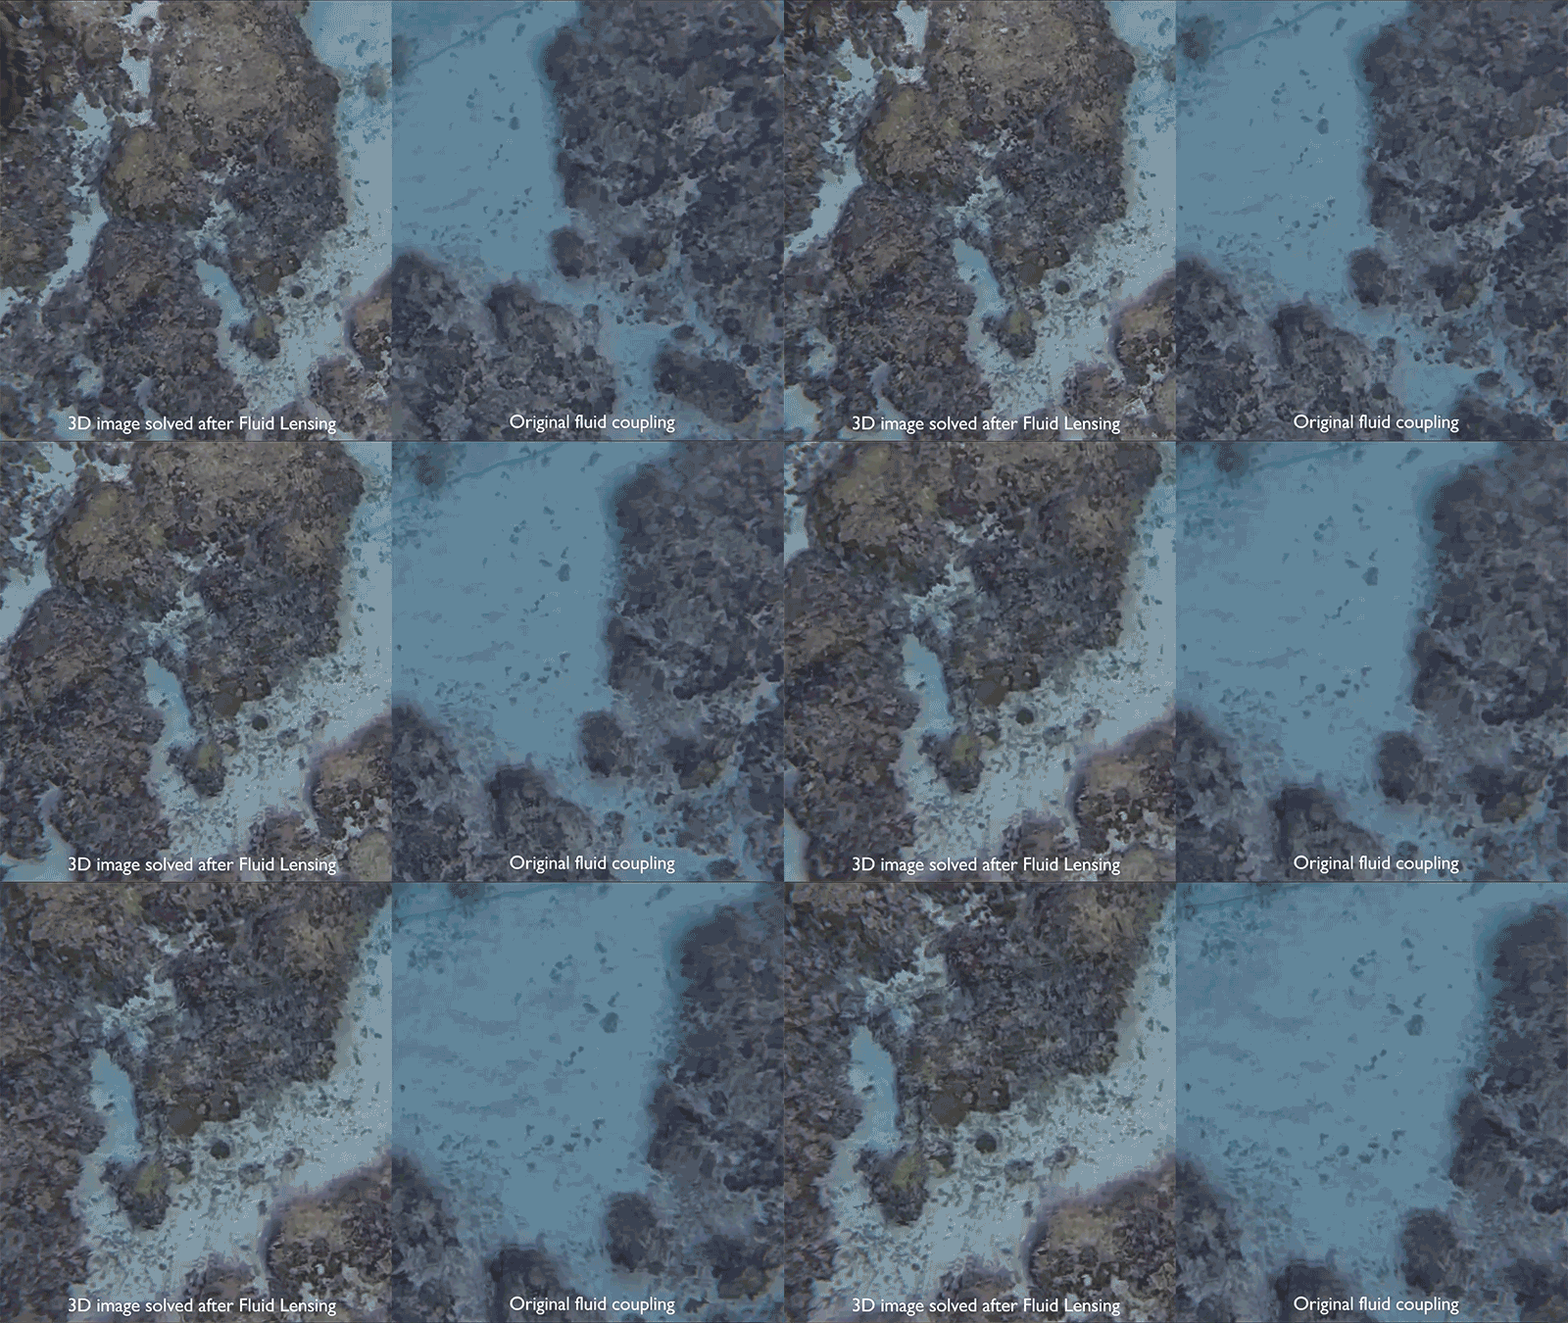
Sometimes it takes a new technology to solve an old problem. A NASA camera carrying new software peers beneath waves to bring ecosystems into focus. Fluid Cam, the imaging instrument that carries the new lensing software, is small enough to fly on a drone.
Fluid lensing strips away distortion from ocean waves and other movement to better show coral reefs beneath the surface. Someday, this technique could be flown on an orbiting satellite to gather image data on the world’s reefs.
Eventually the same technology could be used to bring other worlds into focus.
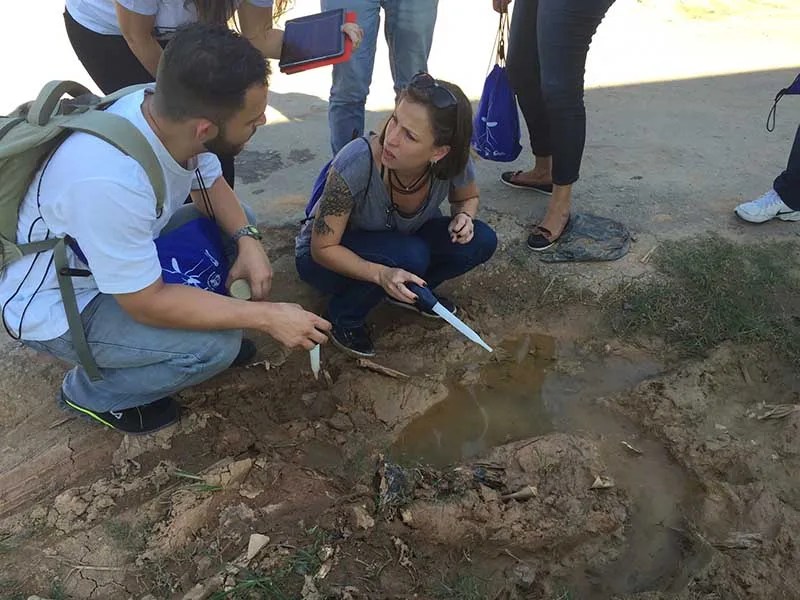
With GLOBE Observer, your observations can help scientists track changes in clouds, water, plants and other life in support of climate research. Scientists also use your data to verify NASA satellite data. And by submitting your observations, you can help students of all ages do real scientific research as part of the GLOBE Program. To participate, just download the app, go outside and follow the prompts to get started!
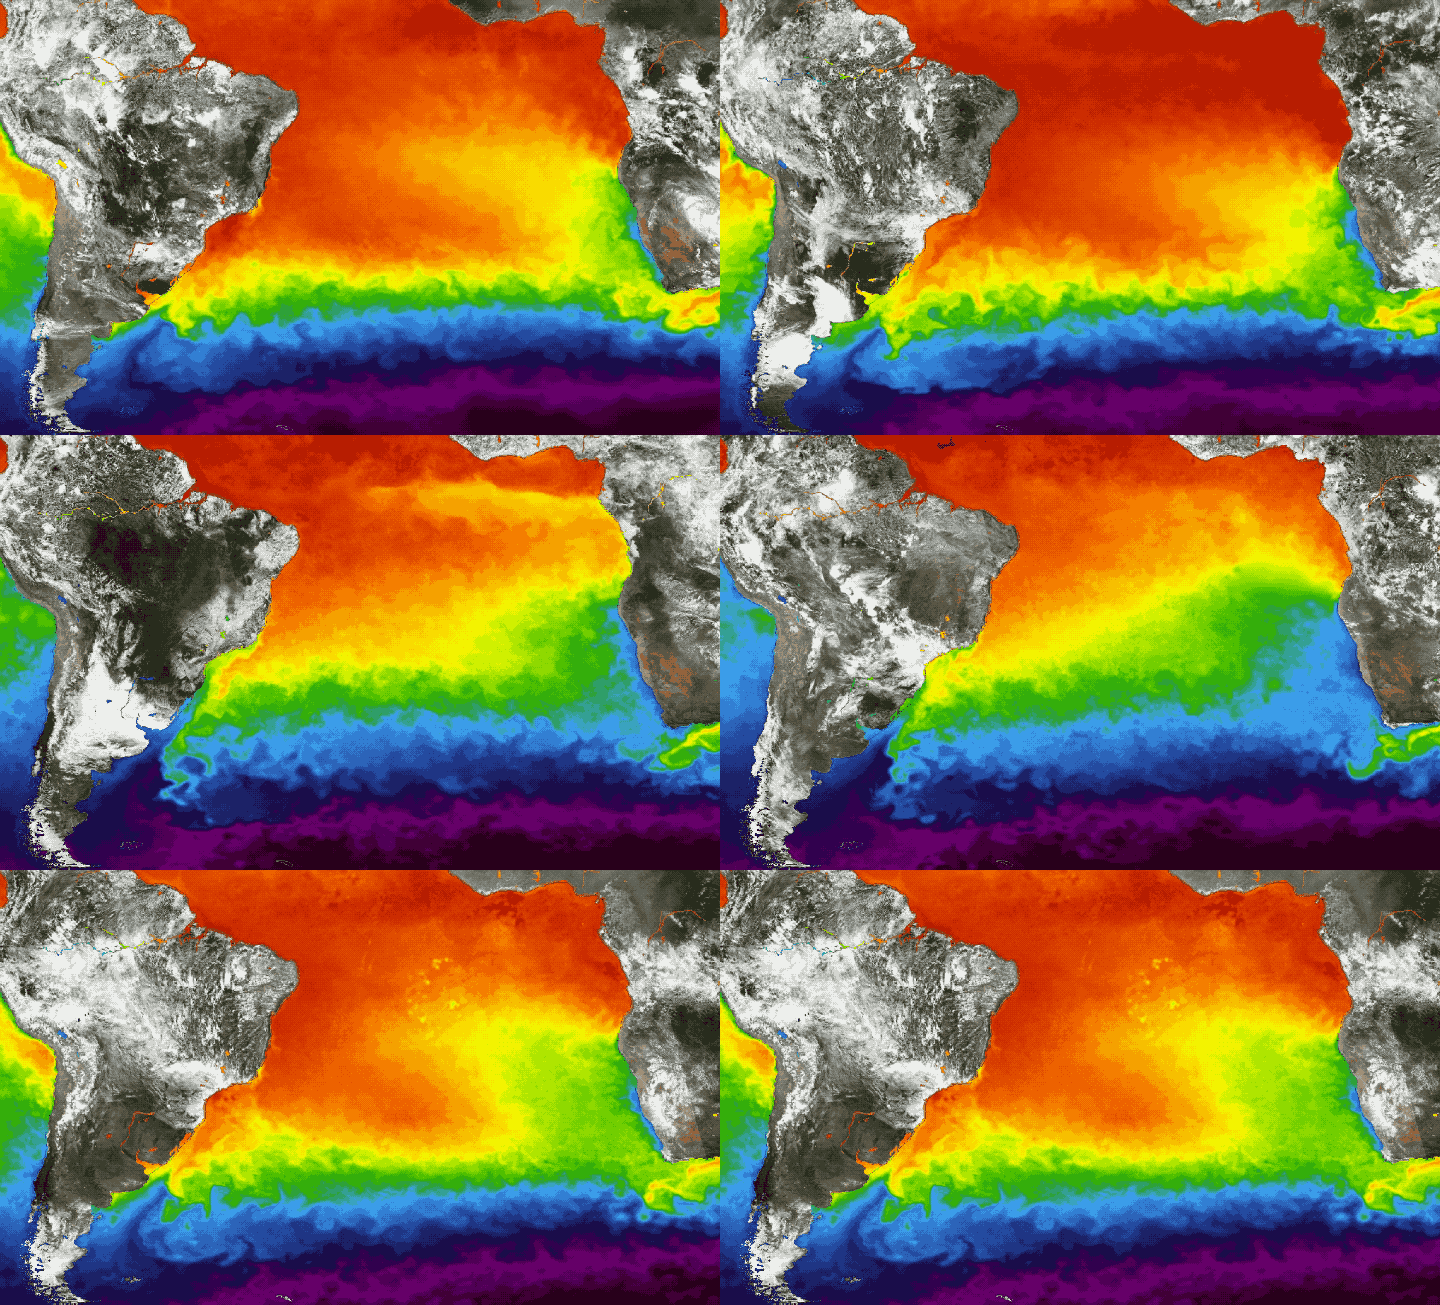
NASA’s Worldview lets you explore Earth as it looks right now or as it looked almost 20 years ago. Through an easy-to-use map interface, you can watch tropical storms developing over the Pacific Ocean; track the movement of icebergs after they calve from glaciers and ice shelves; see wildfires spread and grow as they burn vegetation in its path. Pan-and-zoom to your region of the world to see not only what it looks like today, but to investigate changes over time. Worldview's nighttime lights layers provides a truly unique perspective of our planet at night.
What else can you do with Worldview? Add imagery layers by discipline, natural hazard or key word to learn more about what’s happening on this dynamic planet. View Earth’s frozen regions with the Arctic and Antarctic views. Take a look at current natural events like tropical storms, volcanic eruptions, wildfires and icebergs at the touch of a button. See a view you like? Take a snapshot and share it. Want to track the spread of a wildfire? You can even create an animated gif to see change over time.
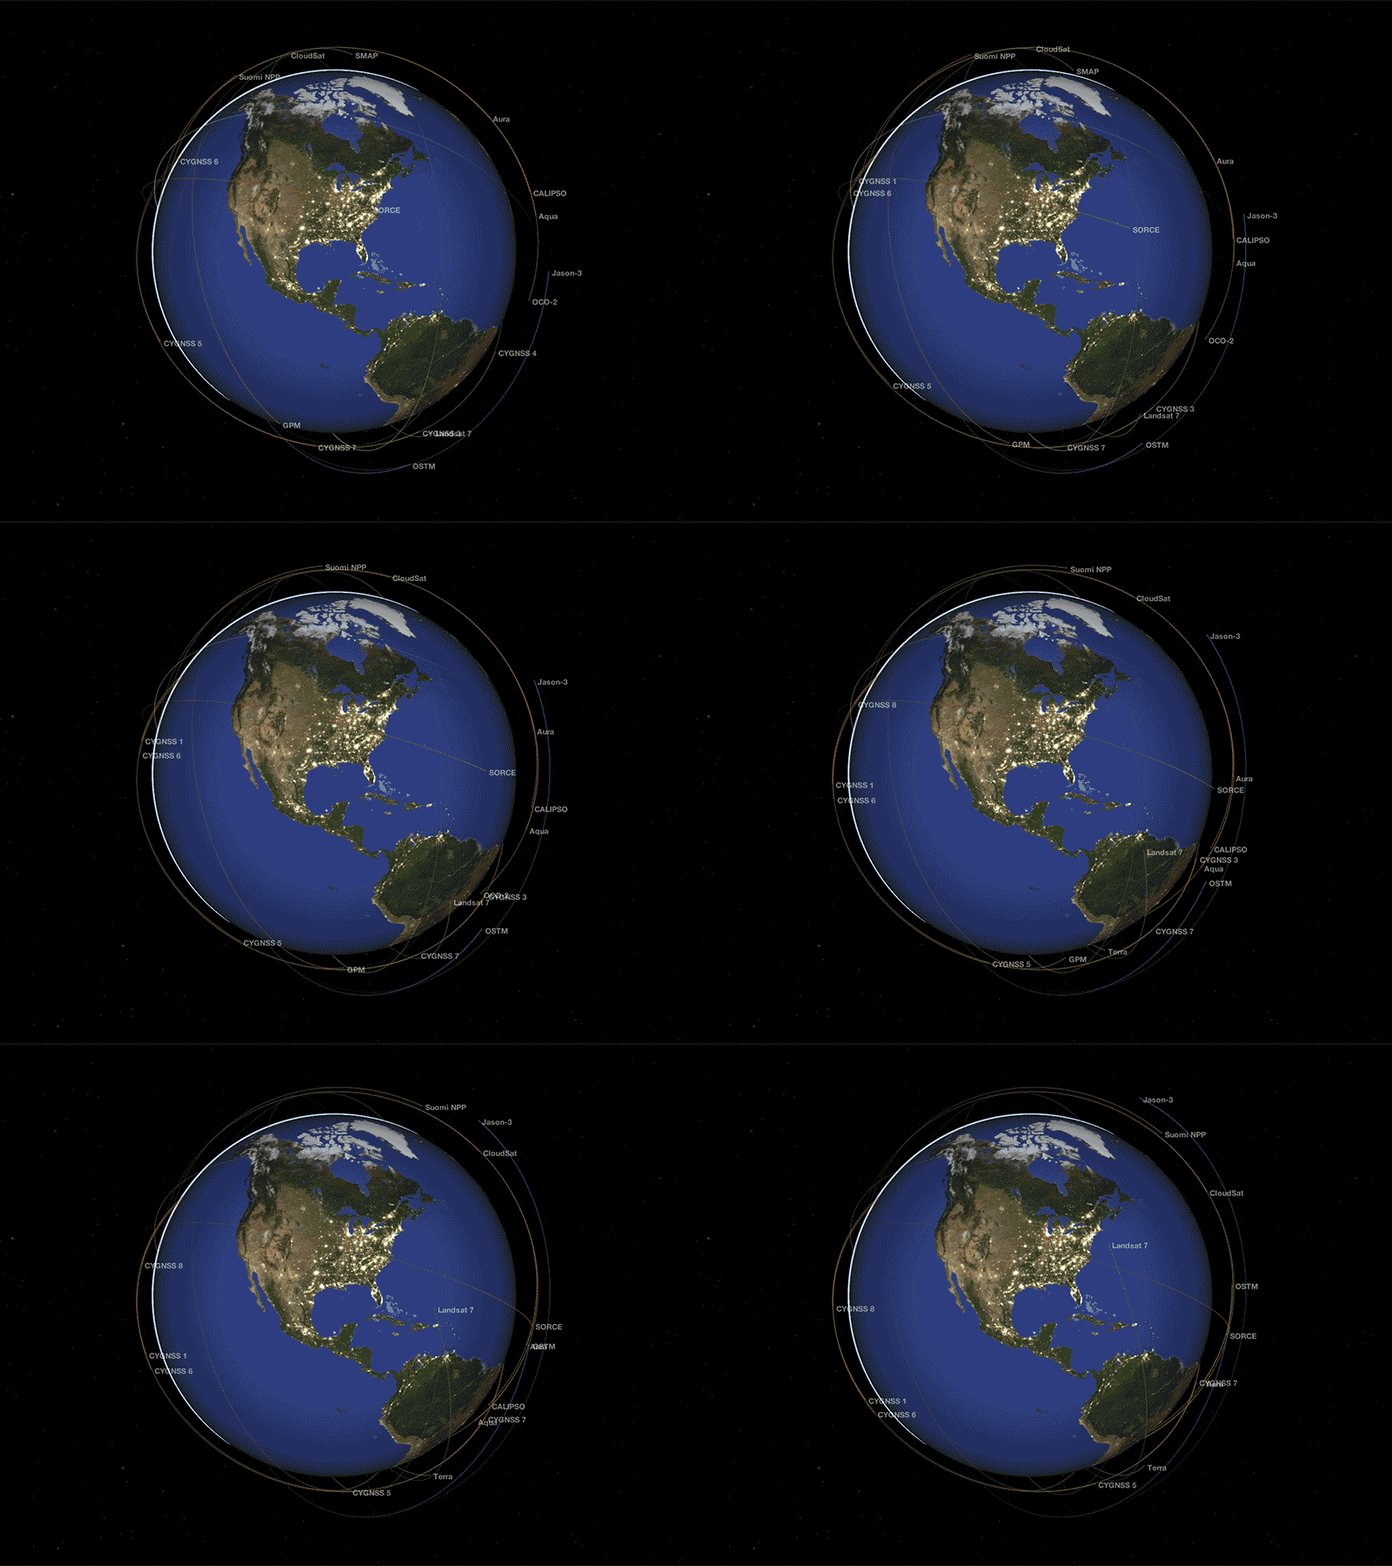
Fly along with NASA's fleet of Earth science missions and observe our home planet from a global perspective in an immersive, 3-D environment.
Monitor Earth’s vital signs, such as sea level height, atmospheric carbon dioxide concentration and Antarctic ozone. Trace the movement of water around the globe using the gravity map from NASA's GRACE satellites. Spot volcanic eruptions and forest fires using the carbon monoxide vital sign. Check out the hottest and coldest locations on Earth with the global surface temperature map.
“Eyes on the Earth” displays the location of all of NASA's operating Earth-observing missions in real time and lets you compare them in size. Get a sneak peek at upcoming missions and learn how NASA is planning to study our Earth in the future.
With the “Latest Events” feature, you can explore geo-located satellite images of recent Earth events, including algal blooms, super storms and wildfires.
Download the app at http://eyes.nasa.gov.


