By Kathryn Hansen
NASA Earth Science News Team
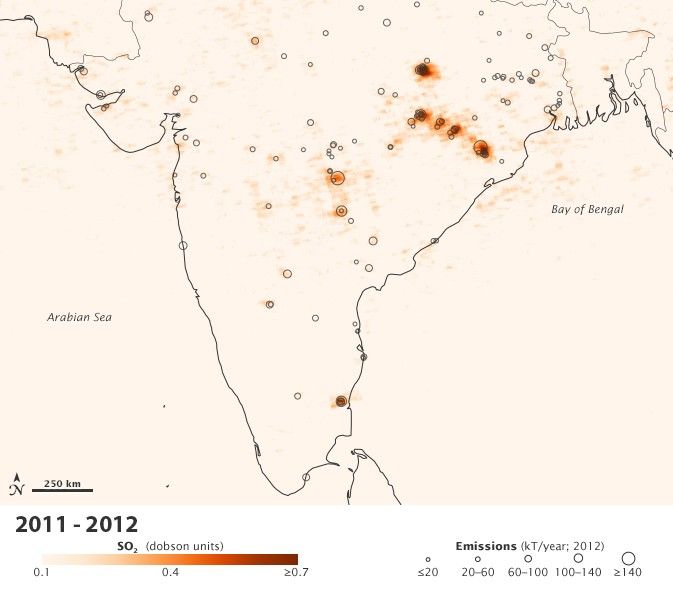
Power plant emissions of sulfur dioxide – an atmospheric pollutant with both health and climate impacts – have increased across India in recent years, according to a new analysis of data from a NASA satellite.
The analysis of data captured by an instrument on NASA's Aura satellite found that emissions of sulfur dioxide from Indian power plants have increased by more than 60 percent between 2005 and 2012, according to new research led by Zifeng Lu of Argonne National Laboratory in Lemont, Ill. The study was published online Dec. 5 in the journal Environmental Science & Technology.
India surpassed the United States in 2010 to become the world's second largest emitter of sulfur dioxide, after China, according to emission estimates previously published by Lu and scientists from universities and the U.S. Environmental Protection Agency. That same research showed that about half of India's emissions come from the coal-fired power sector.
While atmospheric sulfur dioxide is produced in nature primarily by volcanoes, humans emit it to the atmosphere from the combustion of fuels with significant amounts of sulfur-containing impurities and from the smelting of metals such as copper and nickel. The gas contributes to the formation of acid rain and in high concentrations can cause respiratory problems. It's also a precursor for one type of suspended particles, sulfate aerosols, which can affect the microphysical and optical properties of clouds, an effect that remains difficult to measure and a large cause of uncertainty in climate models.
India's Central Pollution Control Board noted in a 2012 report that the national mean concentration of sulfur dioxide has declined from 2001-2010, an estimate based on data from 361 ground-based monitoring stations. However, most of the stations are located in urban areas, where regulations have indeed reduced pollution locally. Only about 70 stations in India collect measurements in the industrial areas near the source of power plant emissions.
"It's an issue of monitoring locations," Lu said. "We should know air quality not only in populated cities, but also in industrial areas, where coal-fired power plants truly dominate national sulfur dioxide emissions. On the one hand, local residents are still influenced by these emissions; on the other hand, long-lifetime, sulfur-containing air pollutants such as sulfate can be transported long distances to affect public health and the environment at a regional scale."
The scientists' look at India's sulfur dioxide emissions came two years after researchers developed a method to observe power plant emissions using measurements captured by an instrument on NASA's Aura satellite, launched in 2004. The Ozone Monitoring Instrument (OMI) measures ozone and other key air quality components including sulfur dioxide and nitrogen dioxide, and collects data over the same locations at the same local time daily. OMI is a contribution of the Netherlands's Agency for Aerospace Programs in collaboration with the Finnish Meteorological Institute to the Aura mission.
With the eight-year record of repeat measurements, the researchers averaged measurements of sulfur from 65 power plants in 23 regions. Over time, a pattern emerged that allowed scientists to distinguish relatively constant power plant emissions from the more variable background concentrations of sulfur dioxide.
Researchers used OMI measurements and the same technique in a 2011 study to show that average sulfur dioxide emissions from large U.S. coal-fired power plants fell by nearly half from 2005-2007 to 2008-2010. In that study, three-year averages were needed to confidently tease out power plant emissions from variable background concentrations. However, India's lower latitude provides more favorable satellite observing conditions, allowing scientists to track the emissions year by year.
Results from the satellite analysis are in line with results of a ground-based inventory, which shows a 71 percent emission increase from 2005-2012. Lu and colleagues developed the ground-based inventory for previous work that used power plant- and unit-level information to calculate nitrogen oxide emissions. The researchers adapted the technique for application to sulfur dioxide emissions, and considered factors from boiler size to coal type to emission control technology.
"This paper confirms that a technique shown to work in the United States can be applied for other countries where emissions [from ground-based measurements] are not well known," said co-author Nickolay Krotkov of NASA's Goddard Space Flight Center in Greenbelt, Md.
Related Links:
NASA satellite confirms sharp decline in pollution from U.S. coal power plants


