8 min read
Imagine Earth without an atmosphere - without clouds, wind or air. Earth's atmosphere protects, transports, and reacts to life on Earth. Without our ozone layer, the surface of Earth would be subject to harsh radiation coming from the sun. Without good quality air, public health and ecosystems suffer. And changes in the makeup of the atmosphere - such as to carbon dioxide, methane, nitrous oxide, cloud cover, water vapor and aerosols – all contribute to climate change.
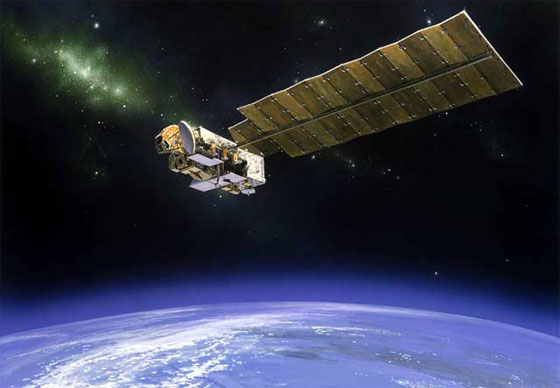
Five years ago, NASA launched a satellite into space to study changes in our life-sustaining atmosphere. Named after the Latin word for breeze, Aura orbits our planet round the clock, using four instruments to monitor the composition and dynamics of our atmosphere. Take a look at some of its greatest findings so far.
On ozone watch
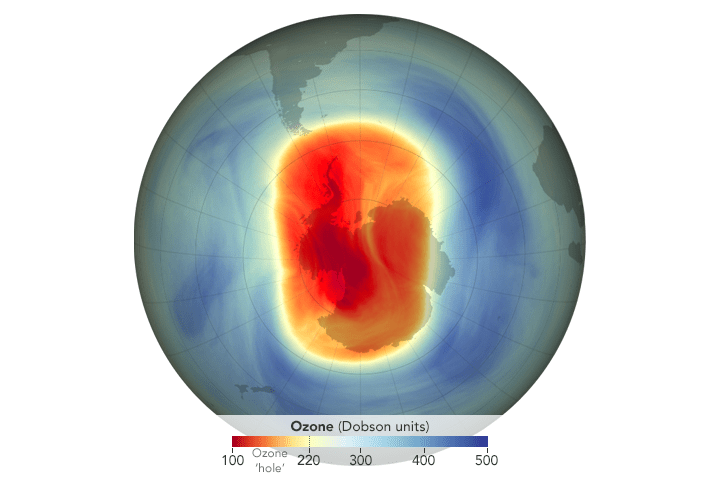
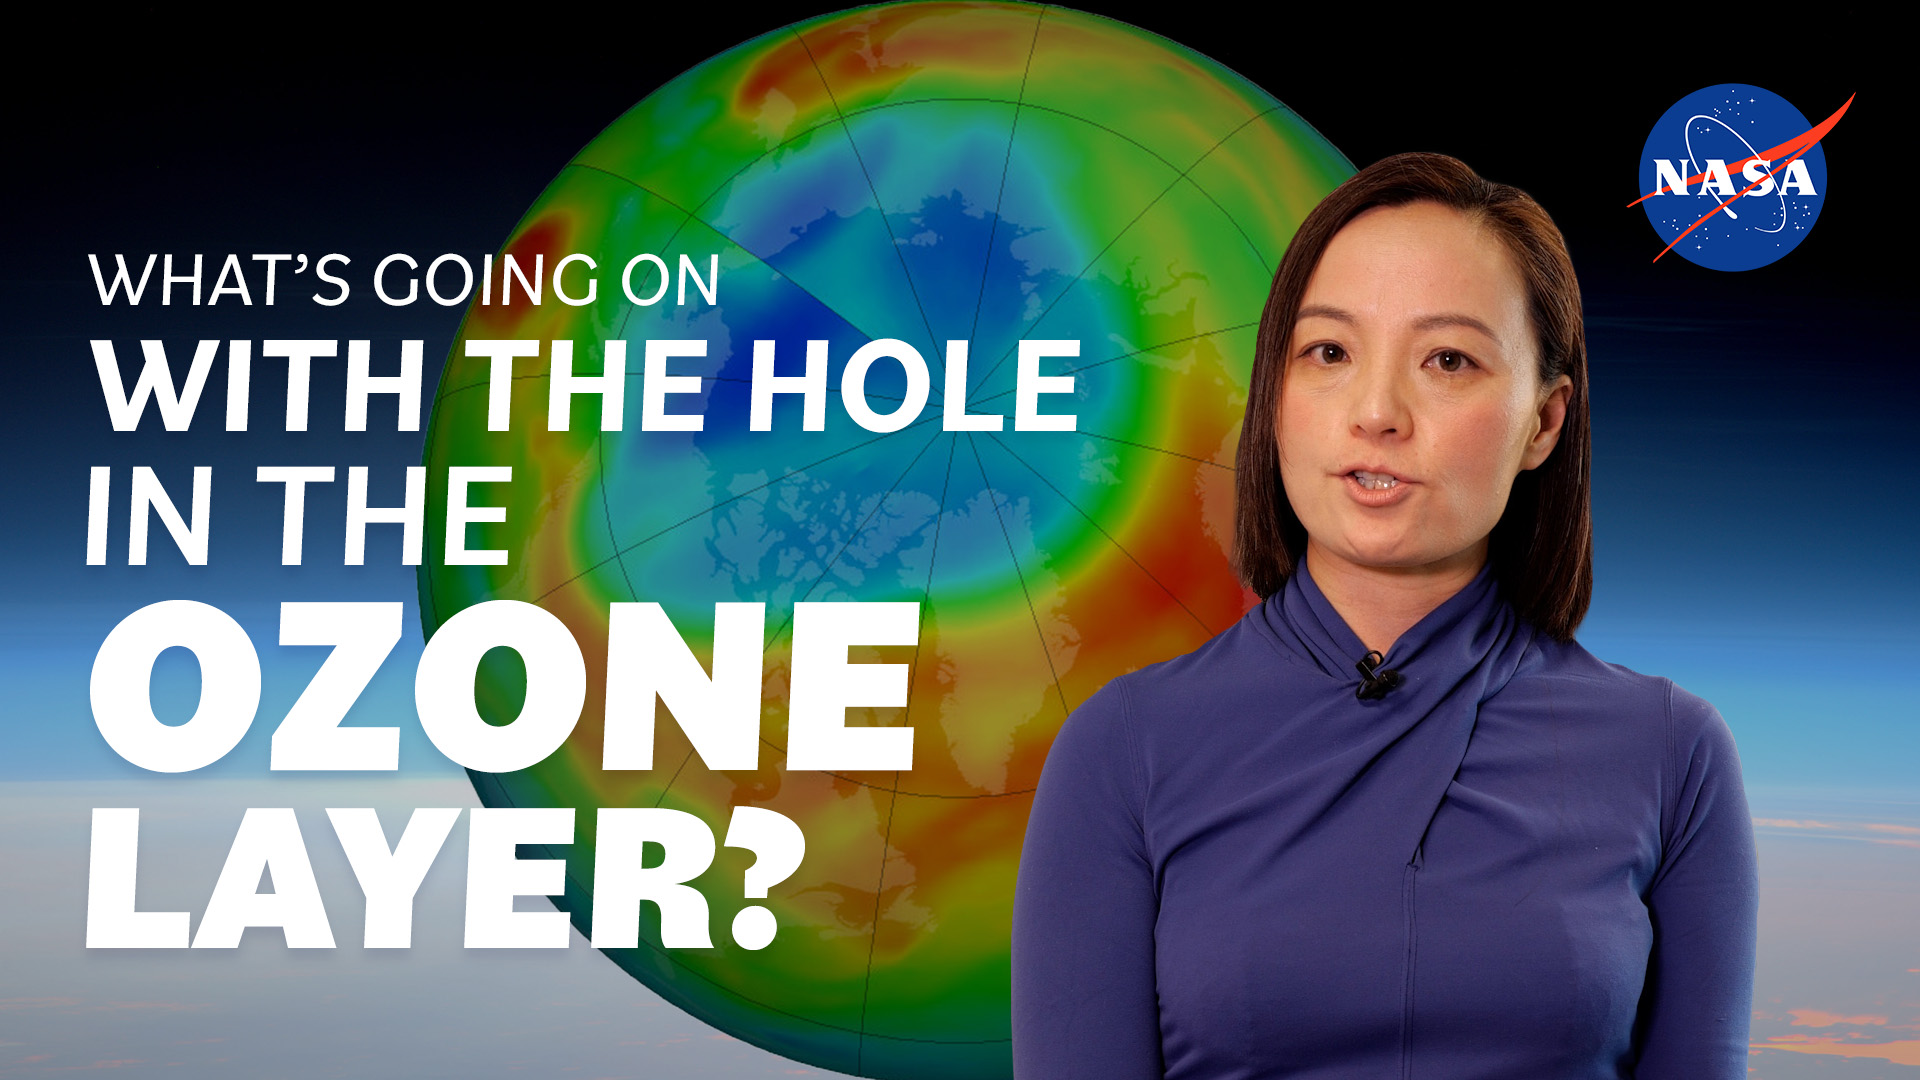
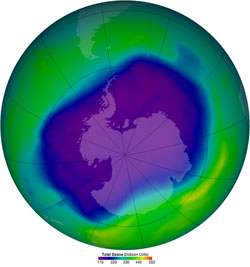
Where the ozone goes, everyone knows. This is thanks, in part, to two instruments onboard Aura that track ozone in our atmosphere: the Ozone Monitoring Instrument (OMI) and the Microwave Limb Sounder (MLS). The ozone layer protects life on Earth by absorbing ultraviolet radiation from the sun. In the 1980s, scientists noticed that at the start of spring in the Southern hemisphere, a region of heavily-depleted ozone was appearing over the South Pole and Antarctica - this is now known as the "ozone hole," even though it's not strictly a hole. We have since discovered that chlorofluorocarbons (CFCs) used in refrigerators, air conditioners and aerosol cans in years gone by, as well as other chlorine- and bromine-containing compounds, are to blame for hacking away at the ozone layer - most notably over Antarctica, but also over the rest of the world. Armed with OMI and MLS data, NASA is helping to keep up a 24/7 ozone hole watch. The information collected provides clues as to exactly how chlorine-based compounds break down ozone and how long it will take for the ozone layer to recover.
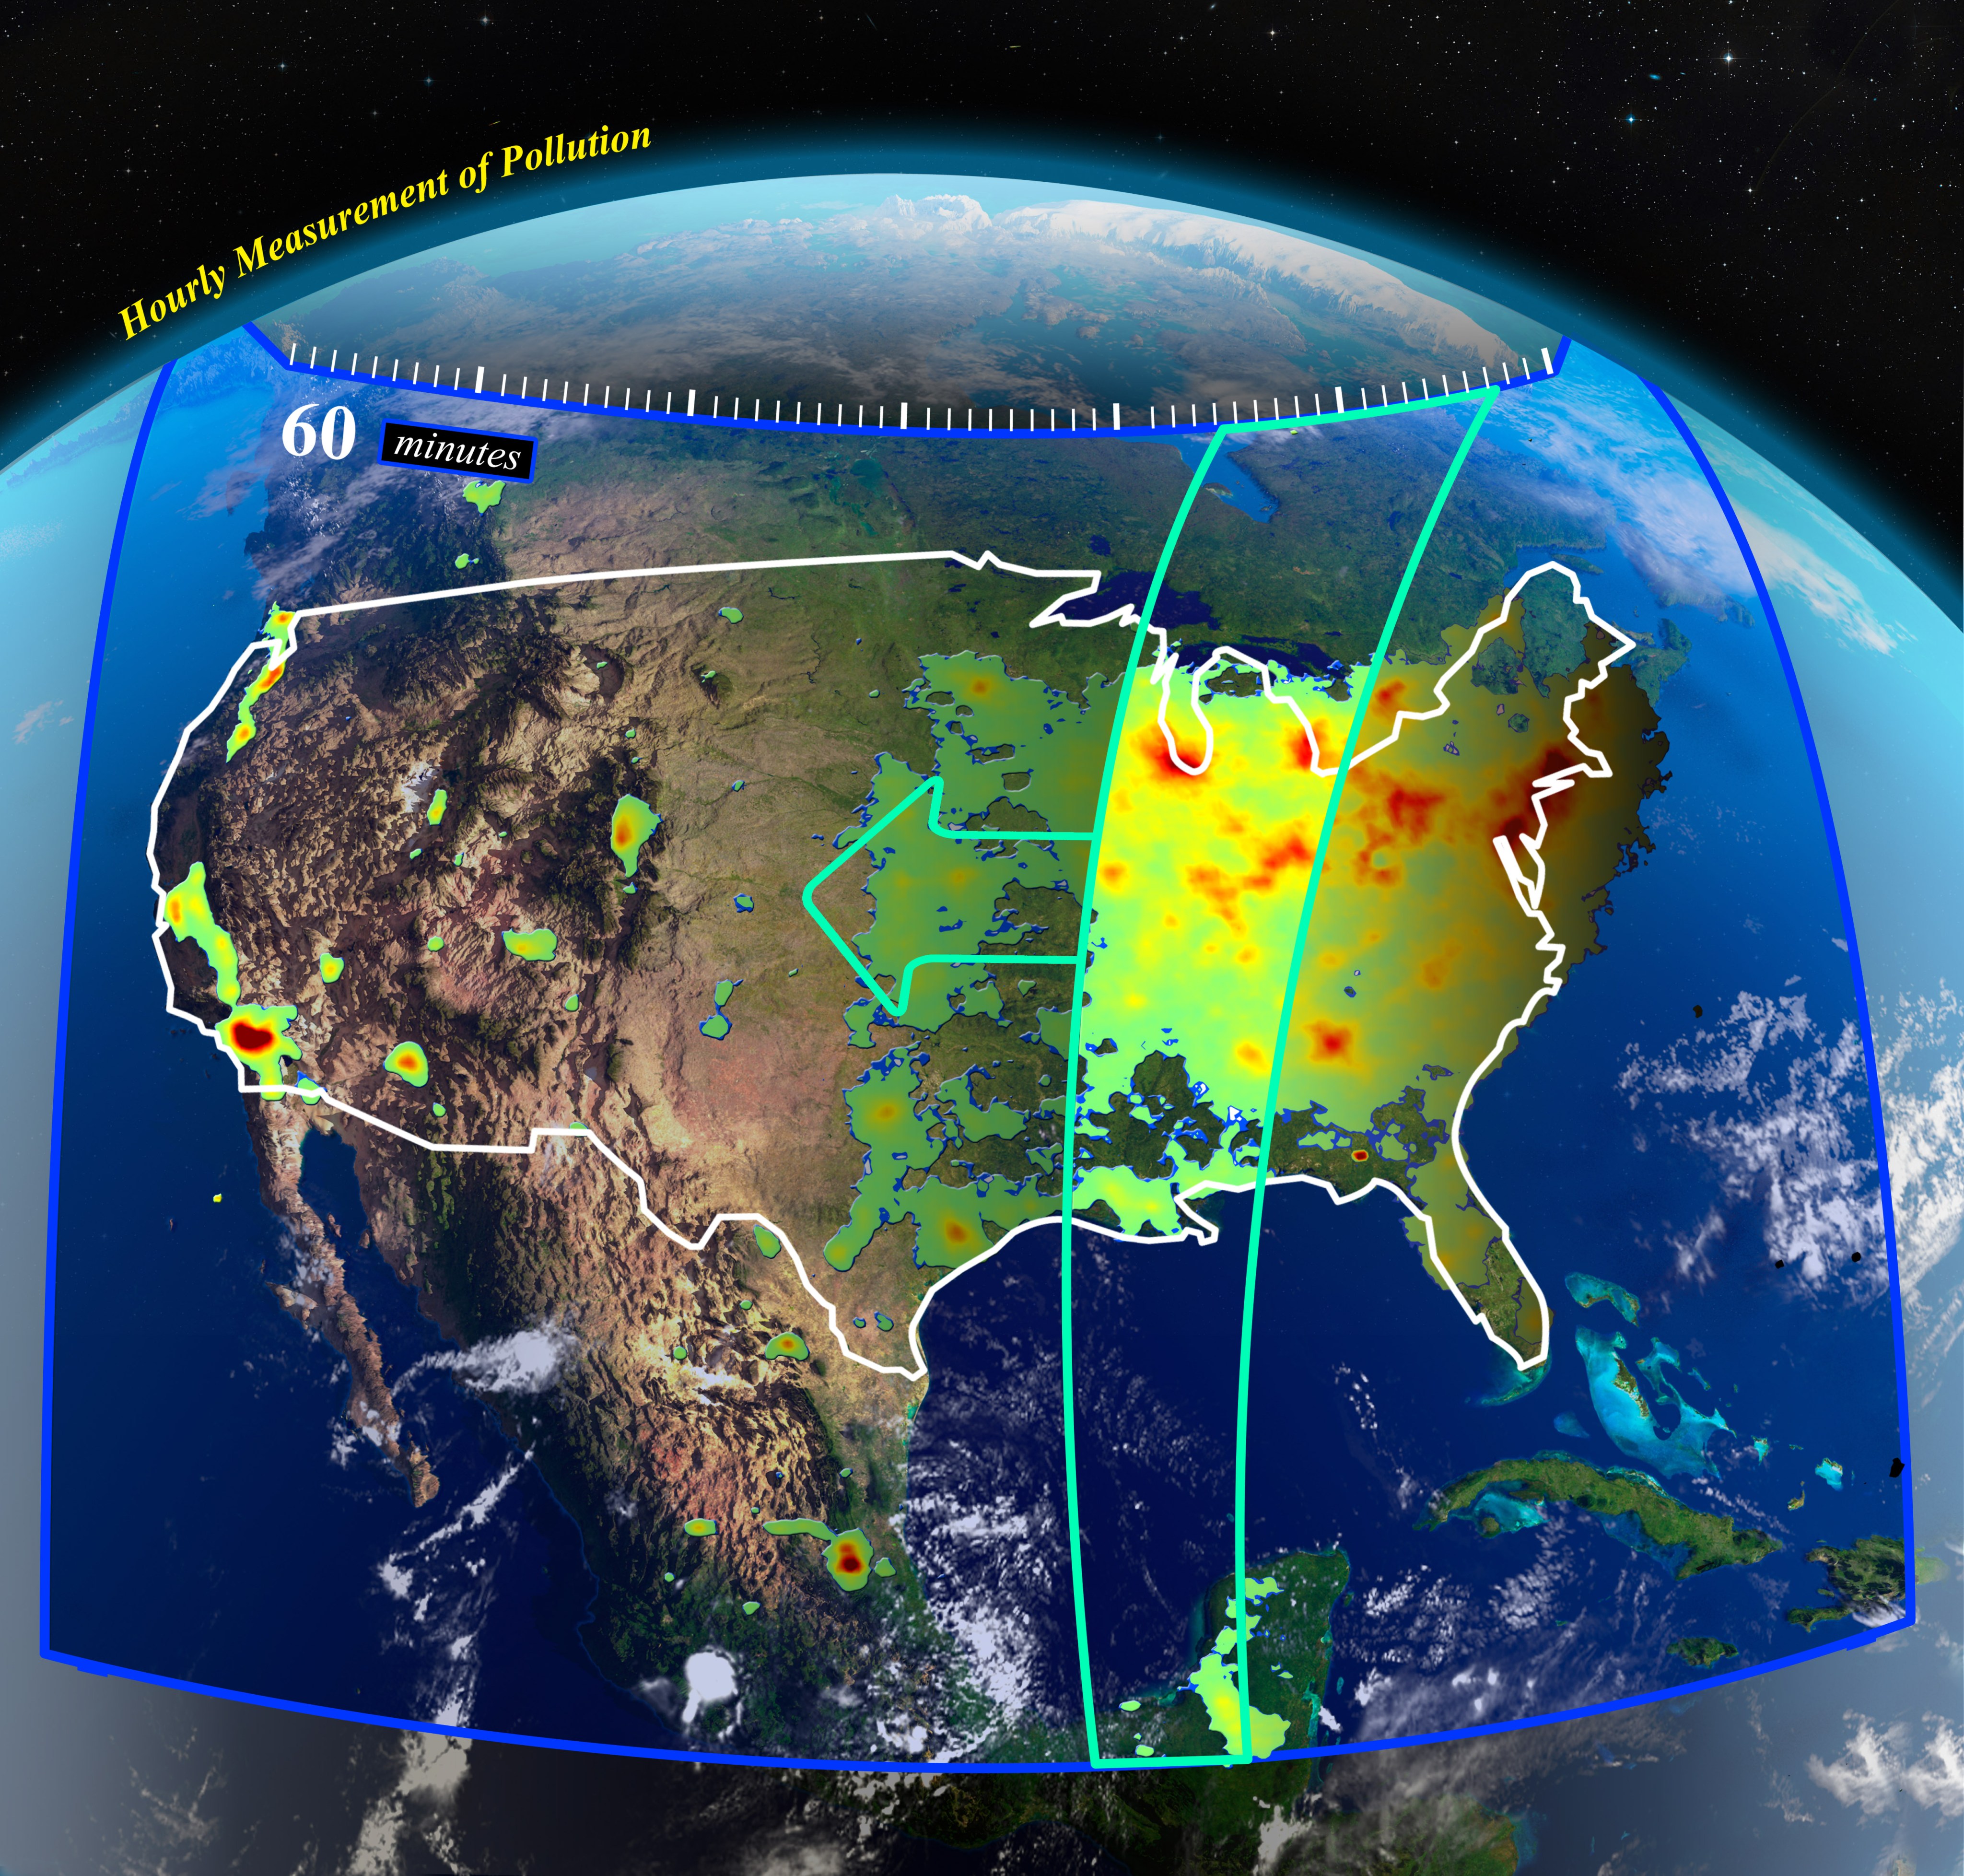
While the ozone layer - which is found in the stratosphere (10 to 50 km, or 6 to 31 miles, up) - is good for us, ozone in the troposphere - the lowest layer of the atmosphere (7 to 20 km, or 4 to 23 miles, up) - is generally bad. This type of ozone is mostly man-made and is an end product of air pollution from internal combustion engines and power plants. It is a major component of smog and tends to peak during summertime when temperatures are highest. In 2006, OMI and MLS produced the first global tropospheric (lower-atmosphere) ozone maps, which showed summertime pollution streaming from the U.S., Europe and China and being produced by the burning of wood and other biomass in Earth's equatorial zone.
Jumping new hurdles
NASA scientists have a tendency to come up with weird and wacky acronyms, and the four instruments onboard Aura are no exception. Aura's HIRDLS (High-Resolution Dynamics Limb Sounder) mission measures the temperature of the stratosphere and detects ozone, water vapor, other trace gases and aerosols at these altitudes. One of its key characteristics is its ability to resolve small changes in the atmosphere (on the scale of 1 km or 0.6 miles) with high precision.
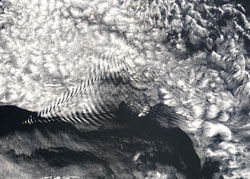
By analzying vertical variations in temperature, HIRDLS has been able to identify and study atmospheric gravity waves in unprecedented detail. Gravity waves, which are like waves on the surface of the ocean, are produced in fluids - in this case in Earth's atmosphere - and are important for transferring momentum from the lower atmosphere to the upper atmosphere. They are generally small-scale and had not been systematically observed until HIRDLS came along. HIRDLS has picked up atmospheric gravity waves with short vertical (about 4-km or 2.4-mile) and horizontal (about 500-km or 300-mile) wavelengths that cannot be picked up by other techniques. The data are being used to improve our understanding of what drives winds in the atmosphere and how it circulates, which is crucial for predicting not only the weather, but also future climate change.
The acid test
Atmospheric scientists are interested in tracking sulfur dioxide for a couple of reasons: it poses a risk to public health and it can also affect Earth's climate. When sulfur dioxide reacts with water vapor, it creates sulfate ions - the precursors to sulfuric acid - which are highly reflective. Powerful volcanic eruptions can inject sulfate aerosols into the stratosphere, beyond the reach of cleansing rainfall. There, the sulfates can linger for months or years, cooling the climate by reflecting incoming sunlight.
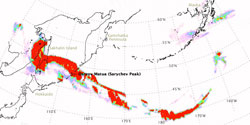
In June 2009, Sarychev Peak Volcano on Matua Island in the northwest Pacific erupted. OMI was there to track the intense sulfur dioxide emissions, which stretched westward from the volcano as far as Sakhalin Island and mainland Russia and eastward as far as Alaska. Data suggest that the volcanic plume reached altitudes of 10 to 15 km (6 to 9 miles), and perhaps as high as 21 km (13 miles). Over the past five years, OMI has also tracked sulfur dioxide clouds produced by the eruptions of numerous other volcanoes, and these are being used to redirect the flight paths of aircraft to safety.
While volcanoes are important, most atmospheric sulfur dioxide comes from man-made activities - the burning of coal and other fossil fuels. Copper smelters in Peru, for example, which separate copper from copper ore (copper sulfide), are some of the biggest sources of sulfur dioxide. Not only a powerful irritant to the respiratory tract, eyes and skin, sulfur dioxide also leads to acid rain. OMI enables scientists to compare the different lifetimes and dispersals of sulfur dioxide plumes from volcanoes and industrial sources and is helping us to better understand their impact on our climate.
Feedback loop
While carbon dioxide is commonly touted as a strong greenhouse gas because of its ability to trap heat near the surface of Earth, moisture in the atmosphere (water vapor) is, in fact, a more powerful greenhouse gas than carbon dioxide. As the planet heats up, more water is expected to evaporate from oceans, lakes and rivers, increasing the amount of water vapor in the atmosphere. This water vapor can, in turn, trap more heat near Earth’s surface - a process that is known as positive feedback. Scientists think that as temperatures rise, water vapor could have a strong feedback effect on climate change.
In 2006, the MLS instrument discovered that the amount of water vapor in the troposphere increased as the amount of ice contained in nearby clouds increased. What's more, cloud ice occurred more often over warm ocean waters than over cold ones. The results suggested that warmer oceans cause stronger heat convection in thunderstorms and cause more water and ice to be lofted up into the upper troposphere. Researchers found a break point at about 80 F (27 C); when the sea surface temperature rises above this, levels of both water vapor and cloud ice sharply increase. The extra water then acts as a greenhouse gas, blocking some of the heat radiation from escaping into space. In addition, the extra ice clouds also affect Earth’s heat balance by trapping heat and reflecting sunlight. What this underscores is that warmer oceans can lead to more trapping of radiation, and ultimately even warmer oceans - a positive feedback.
Weighing in
Earth's water is stored in ice and snow, lakes and rivers, the atmosphere and the ocean. The process by which it circulates from the ocean to the atmopshere to the land and back again to the ocean is known as the water cycle. But how can we track exactly where and how water is carried in our atmosphere? One trick is to use isotopes of water to trace the history of different packets of air, which is just what the Tropospheric Emission Spectrometer (TES) onboard Aura has done.

Isotopes refer to atoms of a particular chemical element (say, hydrogen) that have different masses; their atomic nuclei contain the same number of protons but different numbers of neutrons. Regular water molecules are made up of two atoms of hydrogen and one of oxygen, and have the chemical formula H2O. In "semi-heavy" water, one of the hydrogen atoms is replaced with a heavy hydrogen isotope called deuterium and is instead labeled HDO.
It turns out that when water changes phase (such as from a liquid to a gas), the relative amount of water isotopes also changes. Lighter isotopes evaporate more readily than heavier isotopes, whereas heavier isotopes condense more readily than lighter ones. By monitoring the ratio of "normal" water to semi-heavy water, it becomes possible to distinguish between water vapor that comes directly from evaporating ocean water versus water vapor that has gone through a more circuitous route in the atmosphere.
Evidence from TES suggests that over the tropics (near the equator), 20 to 50 percent of rainfall re-evaporates before it reaches the ground. What's more, the water lofted up into the air by thunderstorms over land comes from both evaporation from plants in large forests and evaporation over nearby oceans. The balance between these two different sources is important, because it tells us how vegetation interacts with the climate and helps maintain regional rainfall levels.
Dr. Amber JenkinsNASA Global Climate ChangeNASA/Jet Propulsion Laboratory

