8 min read
A Monitoring Station off the Coast of Spain Is Giving Scientists a Front-Row Seat to Understanding the Region’s Long-Term Climate Change
Climate scientists will tell you a key challenge in studying climate change is the relative dearth of long-term monitoring sites around the world. The oldest continuously operating station — the Mauna Loa Observatory on Hawaii’s Big Island, which monitors carbon dioxide and other key constituents of our atmosphere that drive climate change — has only been in operation since the late 1950s.
This obstacle is even more profound in the world’s coastal areas. In the global open ocean, the international Argo program’s approximately 4,000 drifting floats have observed currents, temperature, salinity and other ocean conditions since the early 2000s. But near coastlines, the situation is different. While coastal weather stations are plentiful, their focus is to produce weather forecasts for commercial and recreational ocean users, which aren’t necessarily useful for studying climate. The relative lack of long-term records of surface and deep ocean conditions near coastlines has limited our ability to make accurate oceanographic forecasts.
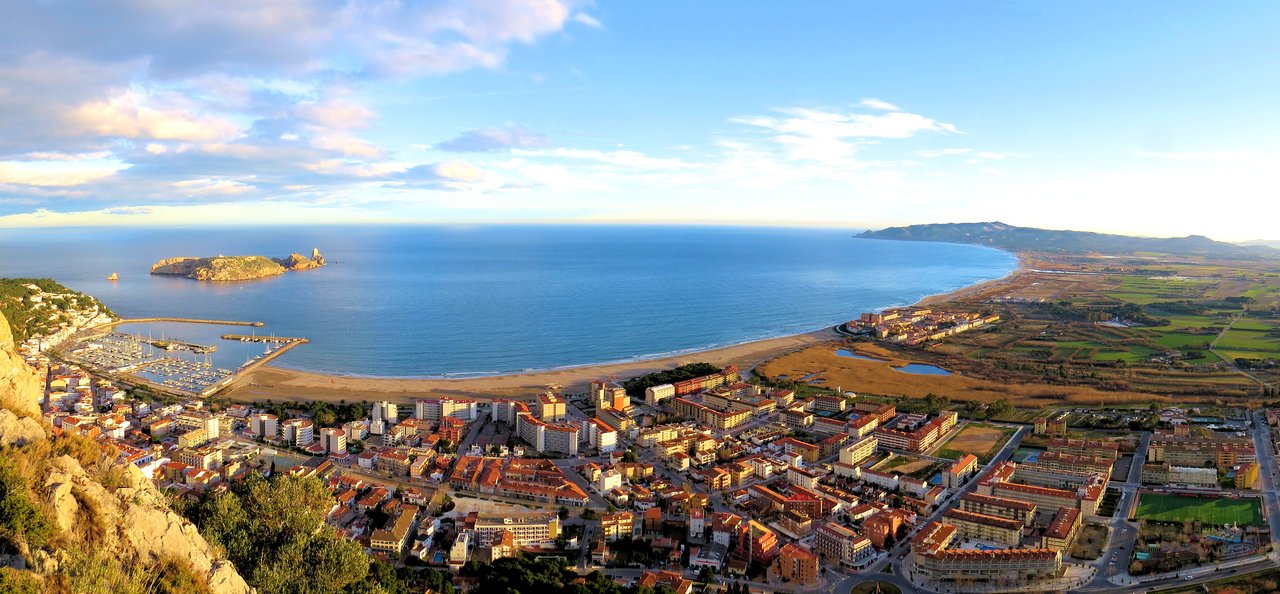
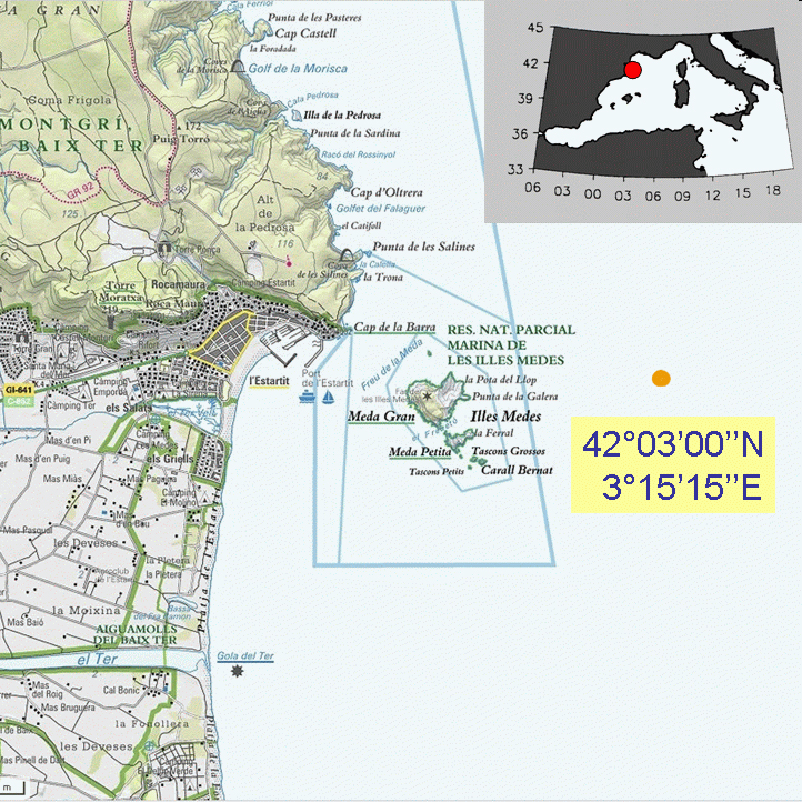
A meteorological and oceanographic coastal station in the small Spanish coastal town of L’Estartit is a notable exception. Located in the Catalan Costa Brava region of the northwest Mediterranean Sea, the L’Estartit station has collected inland data on air temperature, precipitation, atmospheric pressure and humidity since 1969, and has also made oceanographic observations at least weekly since 1973. This makes L’Estartit the longest available uninterrupted oceanographic data time series in the Mediterranean. A new NASA-funded study presents a detailed analysis of the site, revealing climate trends for its Mediterranean coastal environment spanning nearly a half century.
“The long-term data set from L’Estartit is a treasure trove that’s useful for assessing the regional impacts of climate change and how it’s evolved over time." - JPL oceanographer Jorge Vazquez
The study, led by Jordi Salat of the Institut de Ciències del Mar (CSIC) in Barcelona, provides estimates of annual trends in sea and atmospheric temperature and sea level, along with seasonal trends. It also compares data from the site with previous and other estimates of climate trends in the region. Co-authors include Josep Pascual, also with CSIC; oceanographers Jorge Vazquez and Mike Chin of NASA’s Jet Propulsion Laboratory in Southern California; and Mar Flexas of Caltech, also in Southern California.
The existence of the L’Estartit station reflects the results of decades of scientific research dating back to the 20th century. This body of work has established the vital role the ocean plays, in conjunction with our atmosphere, in shaping Earth’s global weather and climate. While sea level and sea state have been monitored regularly for some time, other measurements of oceanic conditions haven’t been as well-chronicled. In order to reconstruct the climate history of the ocean, scientists have typically relied on data from coastal tide gauges and stationary mooring stations, along with oceanographic cruises that weren’t generally part of any coordinated monitoring program.
By the 1980s, however, as Earth’s global climate warming trend became evident, scientists began to establish international programs to conduct long-term studies of the ocean. As a result, in recent years, scientists have increasingly acknowledged the value of having the oceanographic equivalent of weather forecasts. Maintaining regular, long-term records of air temperature, water temperatures at the surface and at various depths, winds, sea level, salinity, and other key oceanographic parameters gives scientists valuable information on long-term average values, how variable our climate is and on long-term changes and trends. Moreover, they help scientists better evaluate how humans are contributing to climate change.
Over the past 20 to 30 years, new technologies have given scientists the ability to monitor the ocean all the way from the sea surface to the ocean floor. These include satellites, drifters, gliders, moorings, buoys, Argo profilers and ship data. These data are used as inputs to computer models to estimate the state of the ocean, make ocean forecasts and estimate climate trends.
Maintained by voluntary observer Josep Pascual in collaboration with CSIC and the authority of the marine protected area, the L’Estartit station is well positioned to monitor the Mediterranean, a region of our planet that’s significantly impacted by climate change. It lies at the southern end of a relatively narrow offshore continental shelf and along the coastal side of the Northern Current, the main along-slope ocean current in the northwestern Mediterranean.

You can think of the Mediterranean as sort of a miniature ocean, since most of the processes that take place in the global ocean also take place here, albeit at different time scales in some instances. Its relatively small size also makes it more accessible to monitoring than many other regions of the global ocean. Because it’s located in Earth’s mid latitudes, it experiences significant seasonal variations, which affect the way it exchanges heat with the atmosphere.
The L’Estartit site collects a broad array of oceanographic data. In addition to the data mentioned previously, the site began continuous measurements of potential daily evaporation in 1976; and has measured sea state, along with wind speed and direction, since 1988. With the installation of a tide gauge in the harbor in 1990, continuous sea level data have been collected. Also added in the 1990s were conductivity-temperature-depth (CTD) profiles and water samples to analyze the temperature and salinity of the water column.
L’Estartit’s long-term data record makes it possible for scientists to calculate trends for a variety of atmospheric and oceanic climate attributes, including air temperature, sea surface and sub-surface temperature to a depth of 80 meters (262 feet), air pressure, relative humidity, relative cloudiness, wind, salinity, changes in ocean stratification, estimates of favorable conditions for evaporation, sea level and precipitation.
“The long-term data set from L’Estartit is a treasure trove that’s useful for assessing the regional impacts of climate change and how it’s evolved over time,” said Vazquez. “The data can be used as reference for other areas in the Mediterranean. The strong agreement between the site’s measurements of sea surface temperatures and satellite data of sea surface temperatures demonstrates how L’Estartit can serve as both a long-term ground truth site to validate satellite observations and as a regional monitoring site for climate change.”
Vazquez says data from the site have been used in numerous climate research studies and have also been used to document a variety of extreme events, from cold spells and heat waves to storms.
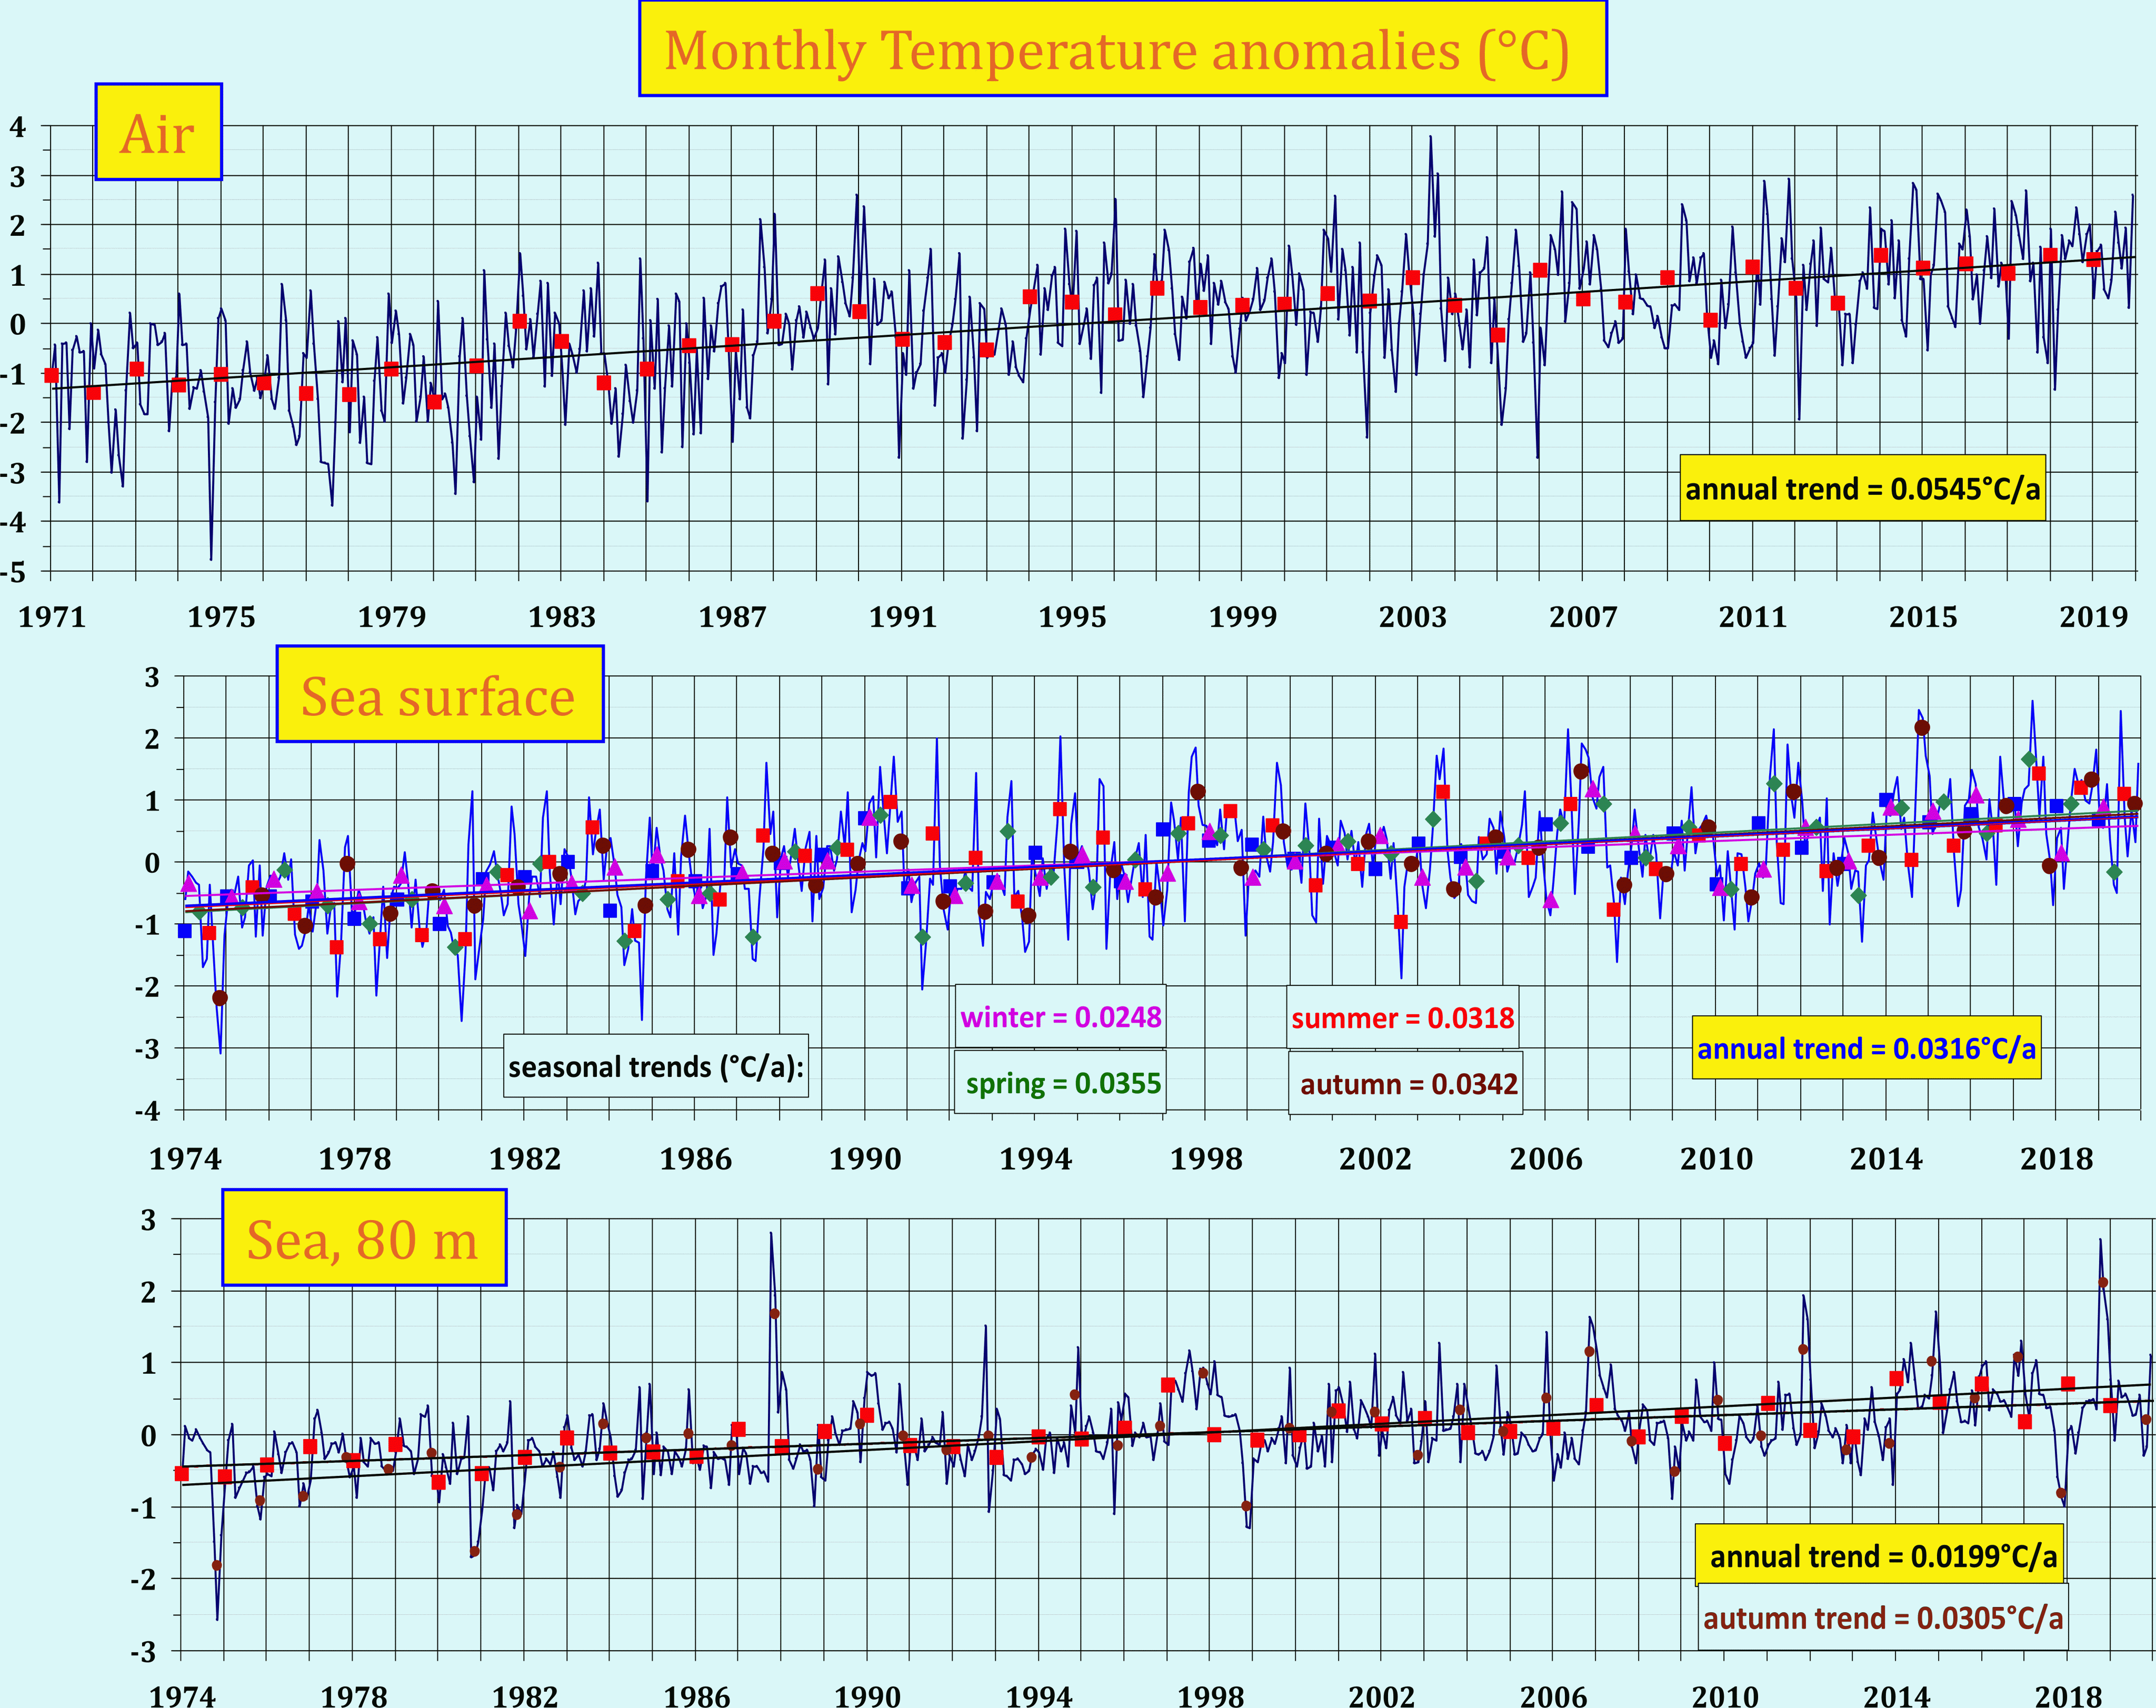
The researchers’ analysis of the nearly 50-year data set reveals numerous climate trends. For example, air temperature has increased by an average of 0.05 degrees Celsius (0.09 degrees Fahrenheit) per year during this time. Sea surface temperature has increased by an average of 0.03 degrees Celsius (0.05 degrees Fahrenheit) per year, while the temperature of the ocean at a depth of 80 meters (262 feet) has increased by an average of 0.02 degrees Celsius (0.04 degrees Fahrenheit) per year.
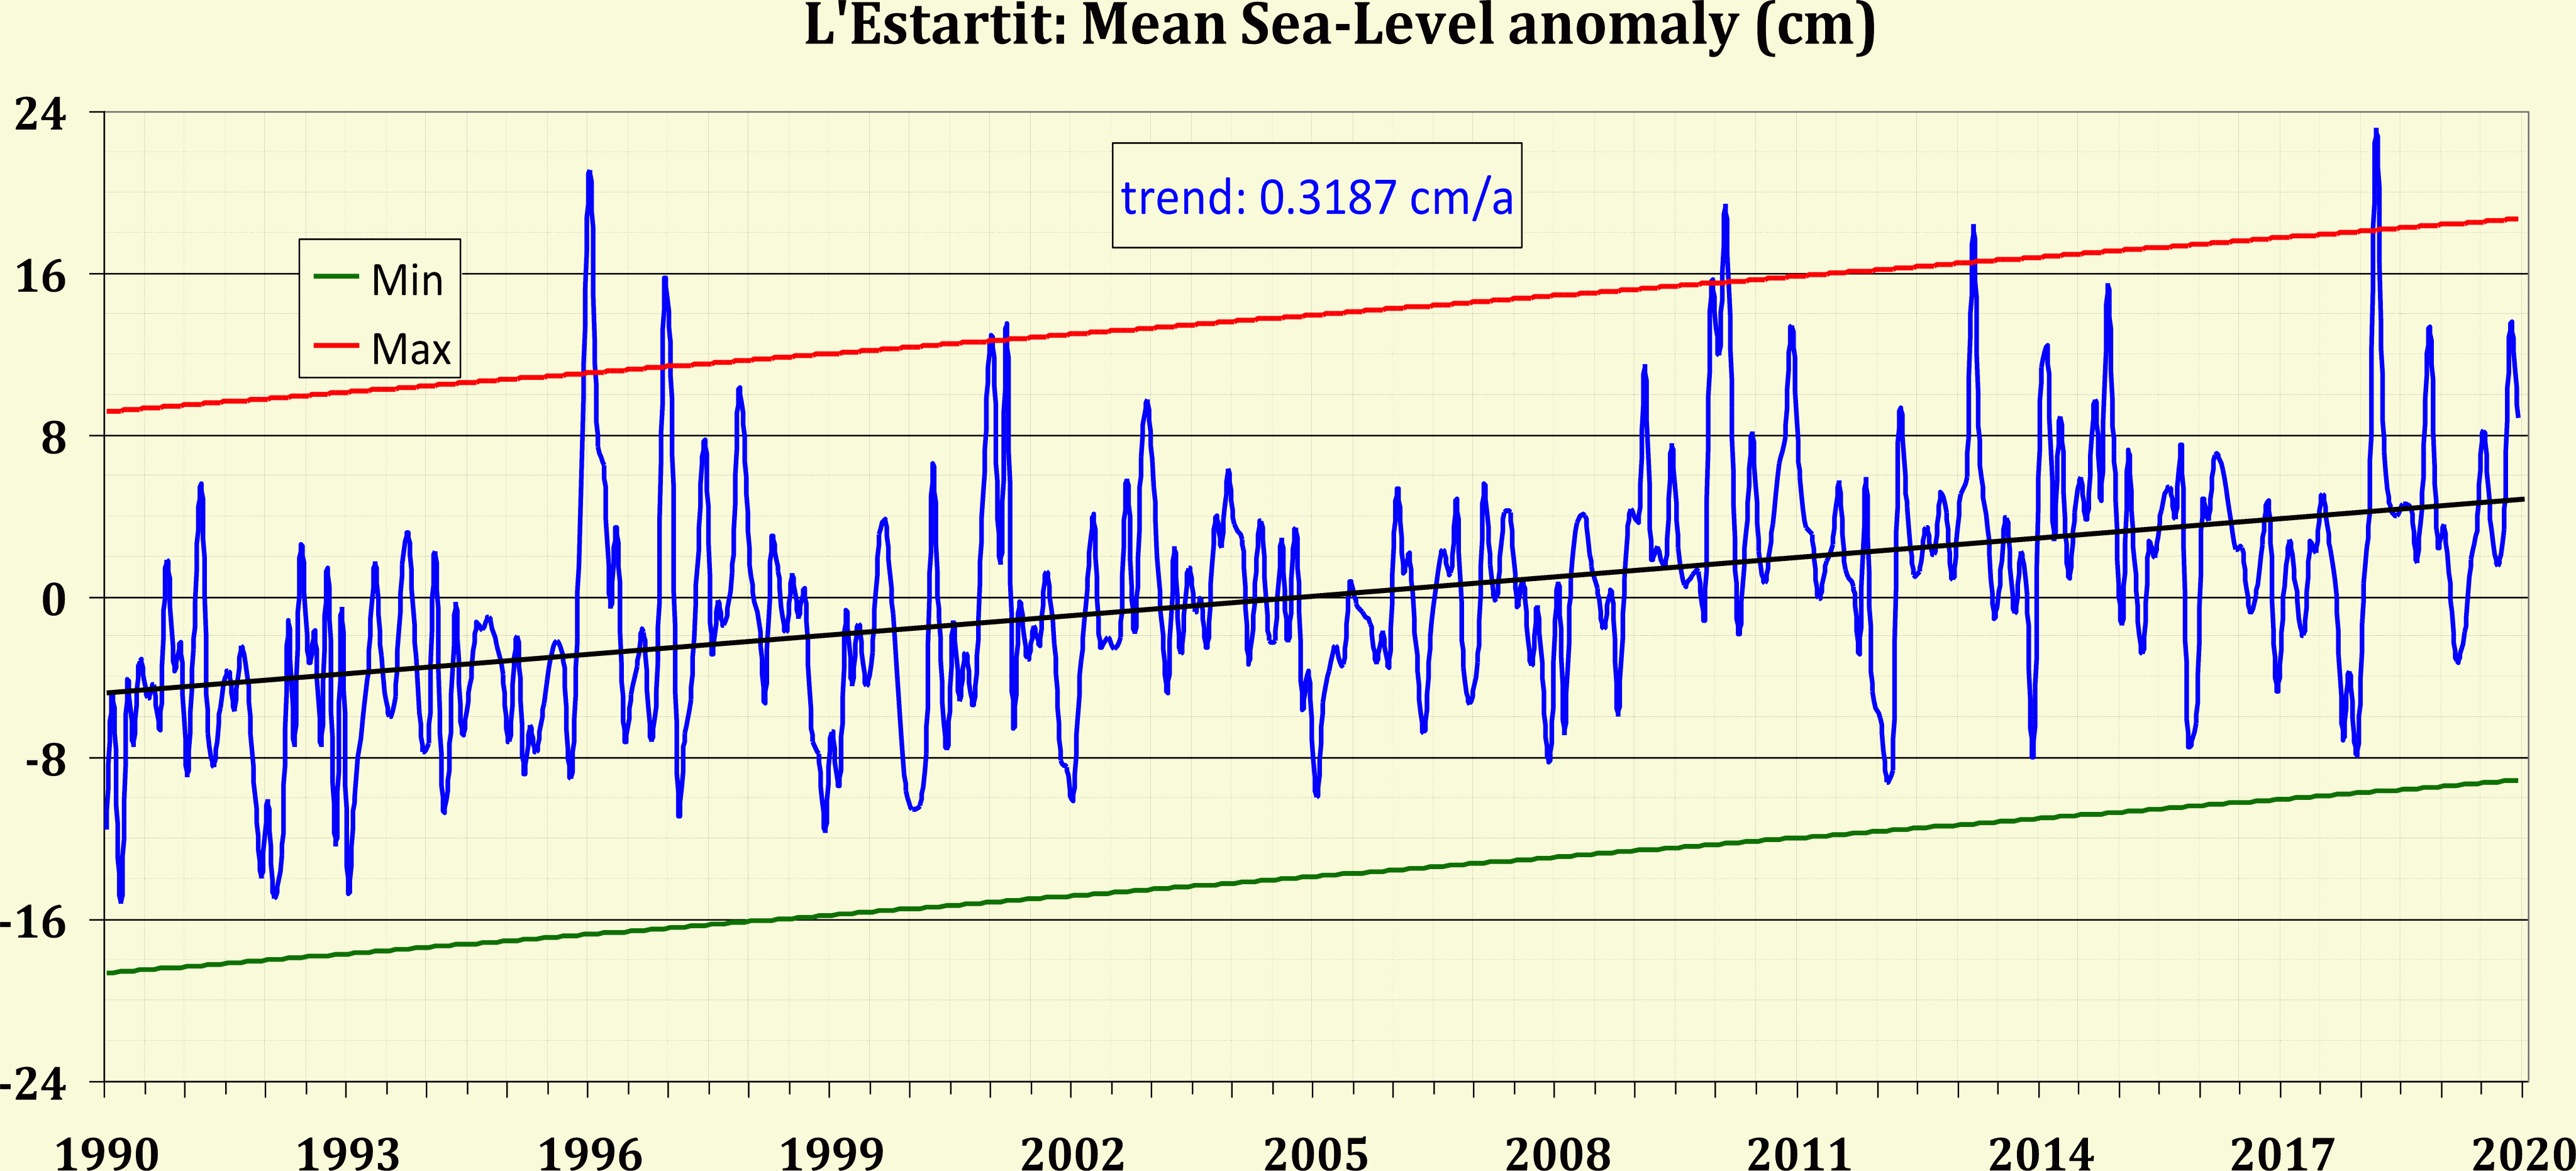
While sea level in the Mediterranean decreased from the 1960s to the 1990s due to changes in the North Atlantic Oscillation (a multi-decadal cyclical fluctuation of atmospheric pressure over the North Atlantic Ocean that strongly influences winter weather in Europe, Greenland, northeastern North America, North Africa and northern Asia), it’s been on the rise since the mid-1990s. The L’Estartit data show that sea level at that site is currently rising at a rate of 3.1 millimeters (0.12 inches) per year.
The researchers found that some of the long-term climate trends they observed were more pronounced during some seasons than in others. For example, trends in air temperature and sea surface temperature were significantly stronger during spring, while the trend for ocean temperature at 80 meters was greatest during autumn. Among their other findings, they noted a small increase in the number of days per year that experience summer-like sea conditions. They also found an almost two day per year drop in conditions favorable for marine evaporation, which may be related to an observed decrease in springtime coastal precipitation.
Vazquez says the good statistical comparison between sea surface temperature values and trends from the L’Estartit data set and data from available satellite products is encouraging. “The long-term consistency of the direct measurements with our satellite data gives scientists the opportunity to validate climate trends across multiple decades,” he said. “Data from L’Estartit should serve as a wake-up call to the global climate science community to immediately begin similar initiatives and ensure their continuity over time.”
The L’Estartit data are available to the public free of charge. The digitized data are accessible at http://meteolestartit.cat/. The remote sensing data used in the study may be retrieved through NASA’s Physical Oceanography Distributed Active Archive Center (PO.DAAC) at http://podaac.jpl.nasa.gov.


