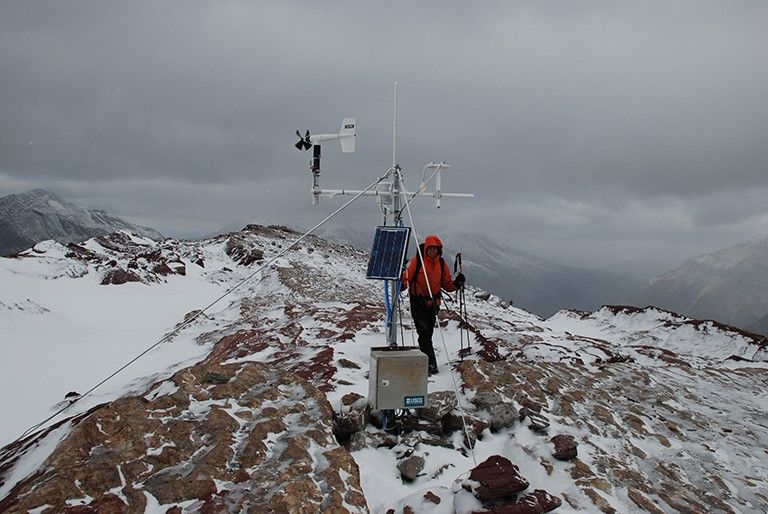
Ensuring the accuracy of Earth’s long-term global and regional surface temperature records is a challenging, constantly evolving undertaking.
There are lots of reasons for this, including changes in the availability of data, technological advancements in how land and sea surface temperatures are measured, the growth of urban areas, and changes to where and when temperature data are collected, to name just a few. Over time, these changes can lead to measurement inconsistencies that affect temperature data records.
Scientists have been building estimates of Earth’s average global temperature for more than a century, using temperature records from weather stations. But before 1880, there just wasn’t enough data to make accurate calculations, resulting in uncertainties in these older records. Fortunately, consistent temperature estimates made by paleoclimatologists (scientists who study Earth’s past climate using environmental clues like ice cores and tree rings) provide scientists with context for understanding today’s observed warming of Earth’s climate, which has no historic parallel.
Over the past 140 years, we’ve literally gone from making some temperature measurements by hand to using sophisticated satellite technology. Today’s temperature data come from many sources, including more than 32,000 land weather stations, weather balloons, radar, ships and buoys, satellites, and volunteer weather watchers.
Get NASA's Climate Change News: Subscribe to the Newsletter »
To account for all of these changes and ensure a consistent, accurate record of our planet’s temperature variations, scientists use information from many sources to make adjustments before incorporating and absorbing temperature data into analyses of regional or global surface temperatures. This allows them to make “apples to apples” comparisons.
Let’s look more closely at why these adjustments are made.
To begin with, some temperature data are gathered by humans. As all of us know, humans can make occasional mistakes in recording and transcribing observations. So, a first step in processing temperature data is to perform quality control to identify and eliminate any erroneous data caused by such errors – things like missing a minus sign, misreading an instrument, etc.
Changes to Land Weather Stations
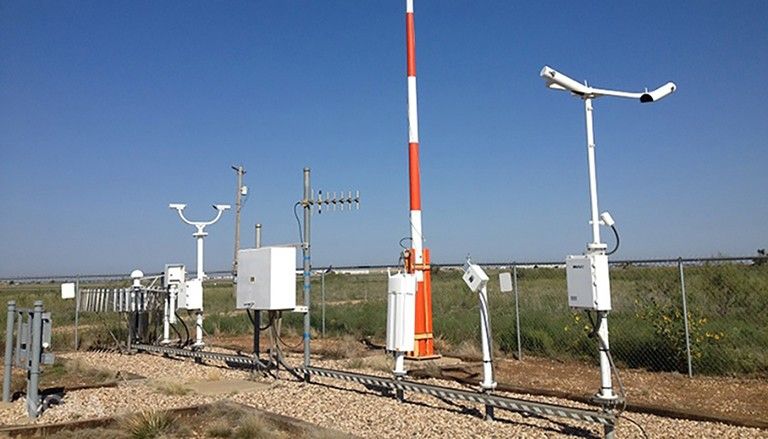
Next are changes to land weather stations. Temperature readings at weather stations can be affected by the physical location of the station, by what’s happening around it, and even by the time of day that readings are made.
For example, if a weather station is located at the bottom of a mountain and a new station is built on the same mountain but at a higher location, the changes in latitude and elevation could affect the station’s readings. If you simply averaged the old and new data sets, the station’s overall temperature readings would be lower beginning when the new station opens. Similarly, if a station is moved away from a city center to a less developed location like an airport, cooler readings may result, while if the land around a weather station becomes more developed, readings might get warmer. Such differences are caused by how ground surfaces in different environments absorb and retain heat.
Then there are changes to the way that stations collect temperature data. Old technologies become outdated or instrumentation simply wears out and is replaced. Using new equipment with slightly different characteristics can affect temperature measurements.
Data adjustments may also be required if there are changes to the time of day that observations are made. If, for example, a network of weather stations adopts a uniform observation time, as they did in the United States, stations making such a switch will see their data affected, because temperature is dependent on time of day.
Scientists also make adjustments to account for station temperature data that are significantly higher or lower than that of nearby stations. Such out-of-the-ordinary temperature readings typically have absolutely nothing to do with climate change but are instead due to some human-produced change that causes the station readings to be out of line with neighboring stations. By comparing data with surrounding stations, scientists can identify abnormal station measurements and ensure that they don’t skew overall regional or global temperature estimates.
In addition, since the number of land weather stations is increasing over time, forming more dense networks that increase the accuracy of temperature estimates in those regions, scientists also take those improvements into account so data from areas with dense networks can be appropriately compared with data from areas with less dense networks.
Changes to Sea Surface Temperature Measurements
Much like the trends on land, sea surface temperature measurement practices have also changed significantly.
Before about 1940, the most common method for measuring sea surface temperature was to throw a bucket attached to a rope overboard from a ship, haul it back up, and read the water temperature. The method was far from perfect. Depending on the air temperature, the water temperature could change as the bucket was pulled from the water.
During the 1930s and ‘40s, scientists began measuring the temperature of ocean water piped in to cool ship engines. This method was more accurate. The impact on long-term ocean surface temperature records was to reduce the warming trend in global ocean temperatures that had been observed before that time. That’s because temperature readings from water drawn up in buckets prior to measurement are, on average, a few tenths of a degree Celsius cooler than readings of water obtained at the level of the ocean in a ship’s intake valves.
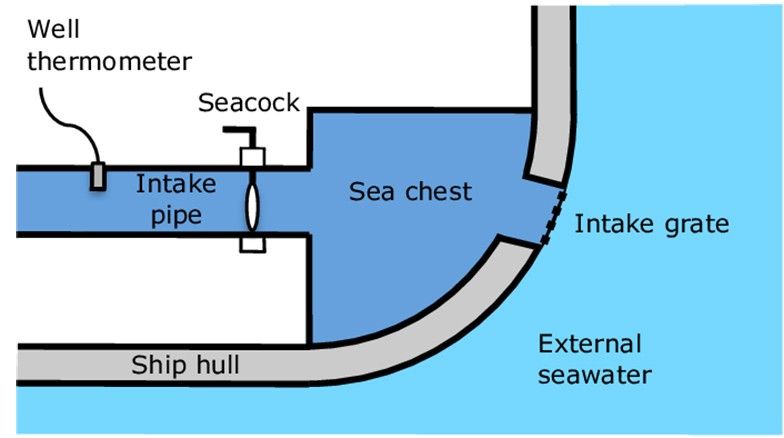
Then, beginning around 1990, measurements from thousands of floating buoys began replacing ship-based measurements as the commonly accepted standard. Today, such buoys provide about 80% of ocean temperature data. Temperatures recorded by buoys are slightly lower than those obtained from ship engine room water intakes for two reasons. First, buoys sample water that is slightly deeper, and therefore cooler, than water samples obtained from ships. Second, the process of passing water samples through a ship’s inlet can slightly heat the water. To compensate for the addition of cooler water temperature data from buoys to the warmer temperature data obtained from ships, ocean temperatures from buoys in recent years have been adjusted slightly upward to be consistent with ship measurements.
So Many Climate Data Sets, So Little Disagreement
Currently, there are multiple independent climate research organizations around the world that maintain long-term data sets of global land and ocean temperatures. Among the best known are those produced by NASA, the National Oceanic and Atmospheric Administration (NOAA), the U.K. Meteorological Office's Hadley Centre/Climatic Research Unit (CRU) of the University of East Anglia, and Berkeley Earth, a California-based non-profit.
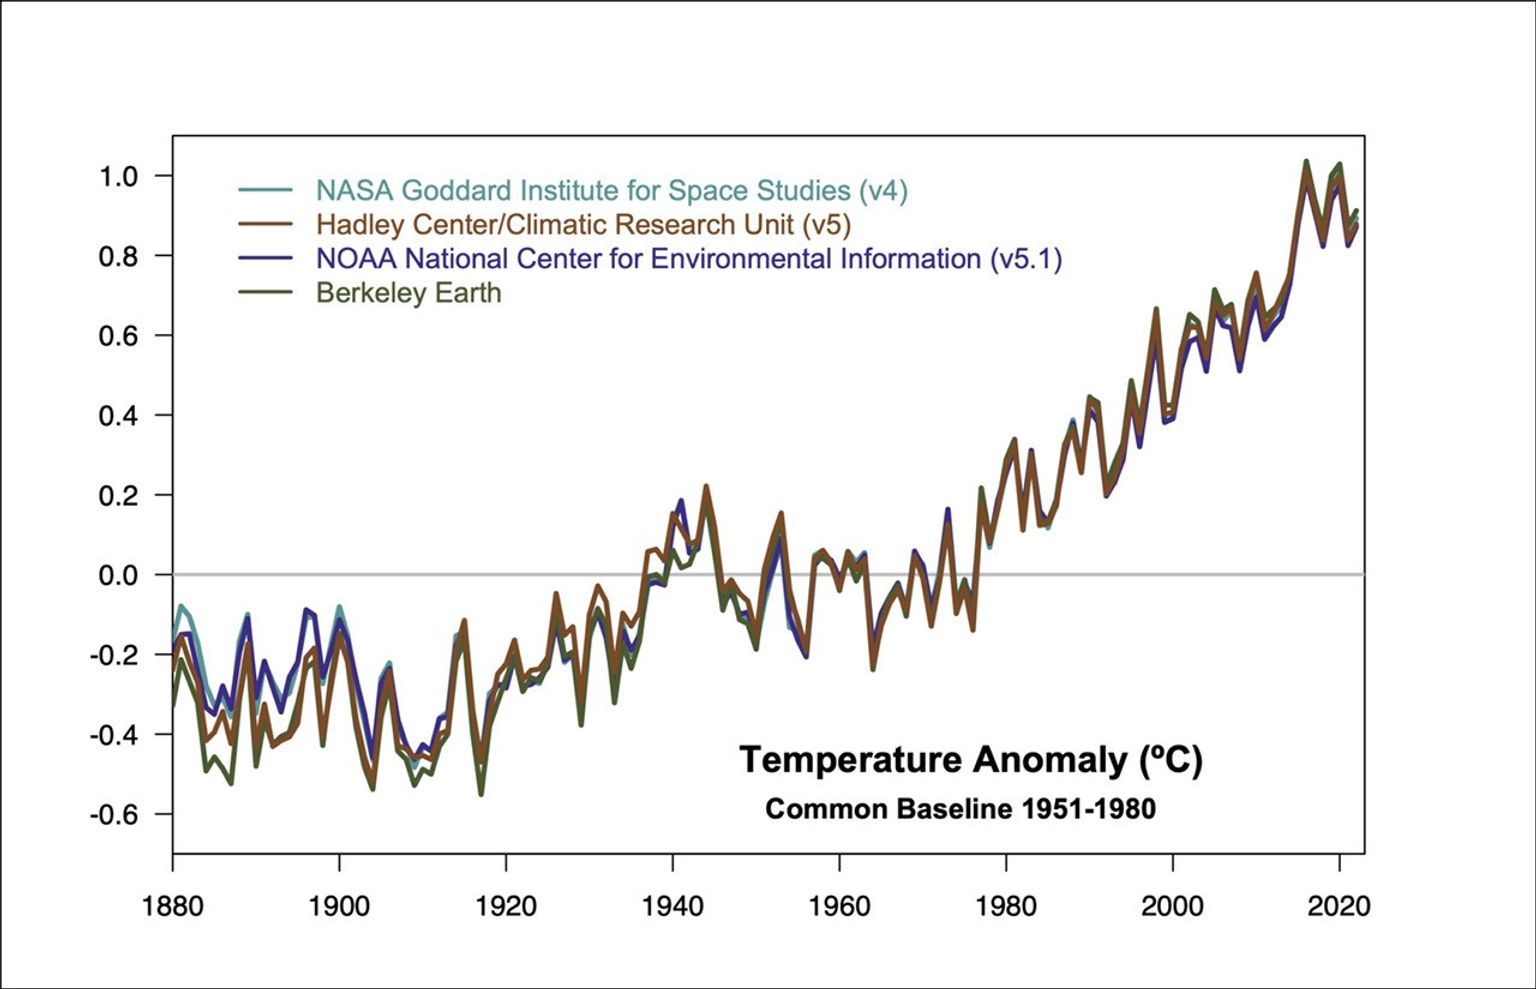
Each organization uses different techniques to make its estimates and adjusts its input data sets to compensate for changes in observing conditions, using data processing methods described in peer-reviewed literature.
Remarkably, despite the differences in methodologies used by these independent researchers, their global temperature estimates are all in close agreement. Moreover, they also match up closely to independent data sets derived from satellites and weather forecast models.
NASA’s GISTEMP Analysis
One of the leading data sets used to conduct global surface temperature analyses is the NASA Goddard Institute for Space Studies (GISS) surface temperature analysis, known as GISTEMP.
GISTEMP uses a statistical method that produces a consistent estimated temperature anomaly series from 1880 to the present. A “temperature anomaly” is a calculation of how much colder or warmer a measured temperature is at a given weather station compared to an average value for that location and time, which is calculated over a 30-year reference period (1951-1980). The current version of GISTEMP includes adjusted average monthly data from the latest version of the NOAA/National Centers for Environmental Information (NCEI) Global Historical Climatology Network analysis and its Extended Reconstructed Sea Surface Temperature data.
GISTEMP uses an automated process to flag abnormal records that don’t appear to be accurate. Scientists then perform manual inspections on the suspect data.
GISTEMP also adjusts to account for the effects of urban heat islands, which are differences in temperatures between urban and rural areas.
The procedure used to calculate GISTEMP hasn’t changed significantly since the mid-1980s, except to better account for data from urban areas. While the growing availability of better data has led to adjustments in GISTEMP’s regional temperature averages, the adjustments haven’t impacted GISTEMP’s global averages significantly.
While raw data from an individual station are never adjusted, any station showing abnormal data resulting from changes in measurement method, its immediate surroundings, or apparent errors, is compared to reference data from neighboring stations that have similar climate conditions in order to identify and remove abnormal data before they are input into the GISTEMP method. While such data adjustments can substantially impact some individual stations and small regions, they barely change any global average temperature trends.
In addition, results from global climate models are not used at any stage in the GISTEMP process, so comparisons between GISTEMP and model projections are valid. All data used by GISTEMP are in the public domain, and all code used is available for independent verification.
The Bottom Line
Independent analyses conclude the impact of station temperature data adjustments is not very large. Upward adjustments of global temperature readings before 1950 have, in total, slightly reduced century-scale global temperature trends. Since 1950, however, adjustments to input data have slightly increased the rate of global warming recorded by the temperature record by less than 0.1 degree Celsius (less than 0.2 degrees Fahrenheit).
A final note: while adjustments are applied to station temperature data being used in global analyses, the raw data from these stations never changes unless better archived data become available. When global temperature data are processed, the original records are preserved and are available to anyone who wants them, at no cost, online. For example, the NOAA National Climatic Data Center's U.S. and global records may be accessed here.


