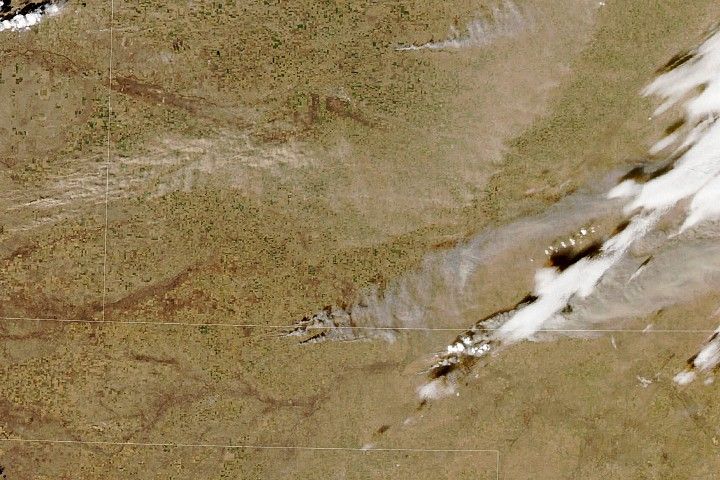
Across the western United States, climate change has caused temperatures to rise, droughts to drag on, and vegetation to go thirsty. As a result, wildfires are occurring more frequently and over a longer time period each year.
This phenomenon was exemplified recently in the Washburn Wildfire, which burned through the Eastern Sierras in California, including Yosemite National Park, for over three weeks in July 2022. Roads closed around and inside the park, and access was cut off to the Mariposa Grove of Giant Sequoias for multiple weeks. After scorching 4,800 acres, the Washburn Fire far surpassed even the average fire size of the 2010s.

Scientists know this because they are using satellite data to track these increasingly common fires and to understand how historical fire patterns are changing. One study by scientists funded through NASA's Earth Science Data Systems program, known as NASA EarthData, found near exponential growth in fire frequency and size in the western U.S. from 1950 to 2019. The average wildland fires of the 1950s were 1,200 acres (485 hectares), but by the 2010s the average had doubled to over 3,400 acres (1,376 hectares).
Many land managers and scientists studying fire use NASA satellite data, including the readily available images from the Landsat missions and the Advanced Very High Resolution Radiometer (AVHRR) instruments aboard many National Oceanographic and Atmospheric Administration (NOAA) satellites. AVHRR measures land and sea surface temperature, cloud cover, snow and ice cover, soil moisture, and vegetation signatures. The data from Landsat and the AVHRR instruments are open source and free and open to the public. These easily accessible data allow many researchers to identify and track patterns of western wildfires.
More information about this work can be found in the NASA Applied Sciences site story Washburn Fire Fits the Pattern of Longer and More Frequent Wildfires.


