


![Request for Information – Potential [Placeholder for Prize]](https://assets.science.nasa.gov/dynamicimage/assets/science/psd/solar/2023/09/s/solarsystem_0.jpg?w=1024)


Microwaves
MICROWAVES
You may be familiar with microwave images as they are used on TV weather news and you can even use microwaves to cook your food. Microwave ovens work by using microwave about 12 centimeters in length to force water and fat molecules in food to rotate. The interaction of these molecules undergoing forced rotation creates heat, and the food is cooked.
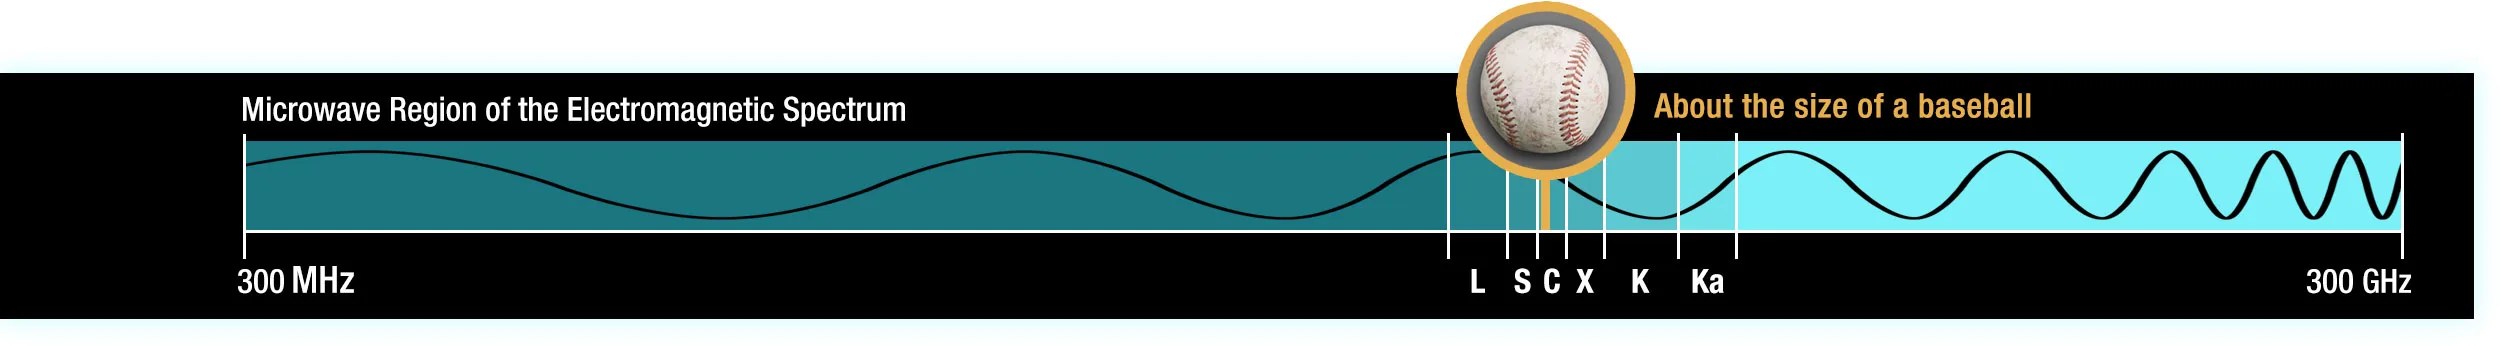
MICROWAVE BANDS
Microwaves are a portion or "band" found at the higher frequency end of the radio spectrum, but they are commonly distinguished from radio waves because of the technologies used to access them. Different wavelengths of microwaves (grouped into "sub-bands") provide different information to scientists. Medium-length (C-band) microwaves penetrate through clouds, dust, smoke, snow, and rain to reveal the Earth's surface. L-band microwaves, like those used by a Global Positioning System (GPS) receiver in your car, can also penetrate the canopy cover of forests to measure the soil moisture of rain forests. Most communication satellites use C-, X-, and Ku-bands to send signals to a ground station.
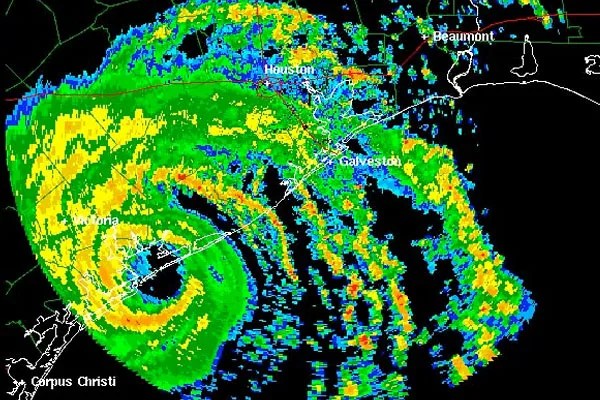
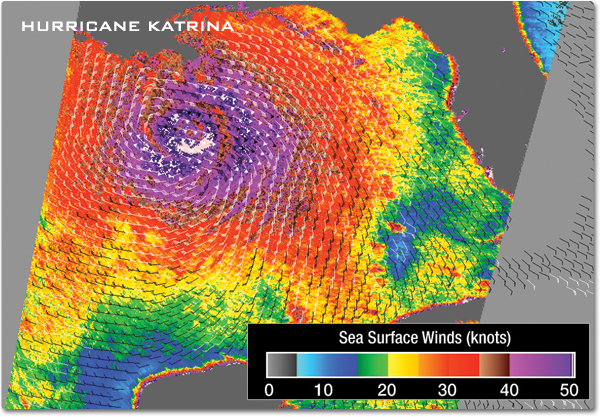
Microwaves that penetrate haze, light rain and snow, clouds, and smoke are beneficial for satellite communication and studying the Earth from space. The SeaWinds instrument onboard the Quick Scatterometer (QuikSCAT) satellite uses radar pulses in the Ku-band of the microwave spectrum. This scatterometer measures changes in the energy of the microwave pulses and can determine speed and direction of wind near the ocean surface. The ability of microwaves to pass through clouds enables scientists to monitor conditions underneath a hurricane.

ACTIVE REMOTE SENSING
Radar technology is considered an active remote sensing system because it actively sends a microwave pulse and senses the energy reflected back. Doppler Radar, Scatterometers, and Radar Altimeters are examples of active remote sensing instruments that use microwave frequencies.
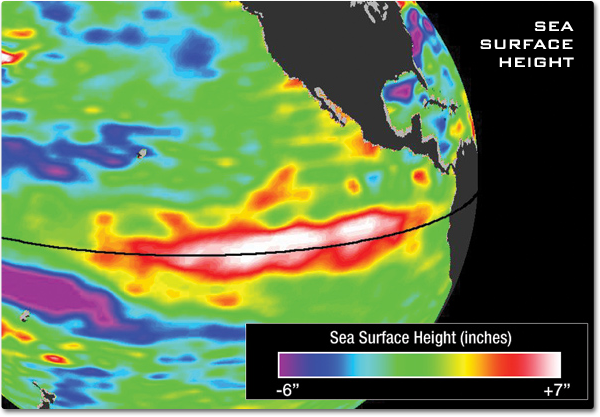
The radar altimeter onboard the joint NASA/CNES (French space agency) Ocean Surface Topography Mission (OSTM)/Jason-2 satellite can determine the height of the sea surface. This radar altimeter beams microwaves at two different frequencies (13.6 and 5.3 GHz) at the sea surface and measures the time it takes the pulses to return to the spacecraft. Combining data from other instruments that calculate the spacecraft's precise altitude and correct for the effect of water vapor on the pulse can determine the sea surface height within just a few centimeters!
PASSIVE REMOTE SENSING
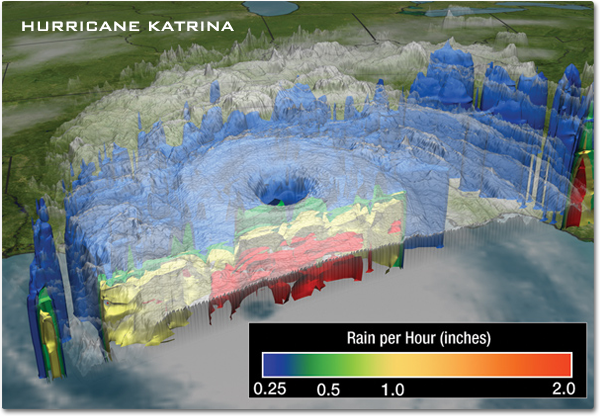
Passive remote sensing refers to the sensing of electromagnetic waves that did not originate from the satellite or instrument itself. The sensor is merely a passive observer collecting electromagnetic radiation. Passive remote sensing instruments onboard satellites have revolutionized weather forecasting by providing a global view of weather patterns and surface temperatures. A microwave imager onboard NASA's Tropical Rainfall Measuring Mission (TRMM) can capture data from underneath storm clouds to reveal the underlying rain structure.
CLUES TO THE BIG BANG
In 1965, using long, L-band microwaves, Arno Penzias and Robert Wilson, scientists at Bell Labs, made an incredible discovery quite by accident: they detected background noise using a special low-noise antenna. The strange thing about the noise was that it was coming from every direction and did not seem to vary in intensity much at all. If this static were from something on our planet, such as radio transmissions from a nearby airport control tower, it would come only from one direction, not everywhere. The Bell Lab scientists soon realized that they had serendipitously discovered the cosmic microwave background radiation. This radiation, which fills the entire universe, is a clue to its beginning, known as the Big Bang.
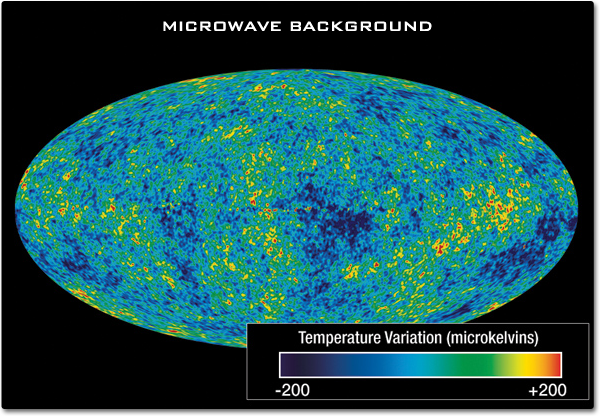
The image below from the Wilkinson Microwave Anisotropy Probe (WMAP) shows a detailed, all-sky picture of the infant universe at 380,000 years of age. This light, emitted 13.7 billon-years ago, is ∼2.7 Kelvin today. The observed +/-200 microKelvin temperature fluctuations, shown as color differences in the image, are the seeds that grew to become clusters of galaxies.
Citation
APA
National Aeronautics and Space Administration, Science Mission Directorate. (2010). Microwaves. Retrieved [insert date - e.g. August 10, 2016], from NASA Science website: http://science.nasa.gov/ems/06_microwaves
MLA
Science Mission Directorate. "Microwaves" NASA Science. 2010. National Aeronautics and Space Administration. [insert date - e.g. 10 Aug. 2016] http://science.nasa.gov/ems/06_microwaves