


Reflected Near-Infrared Waves

NEAR INFRARED RADIATION
A portion of radiation that is just beyond the visible spectrum is referred to as near-infrared. Rather than studying an object's emission of infrared, scientists can study how objects reflect, transmit, and absorb the Sun's near-infrared radiation to observe health of vegetation and soil composition.
HEALTHY VEGETATION
Our eyes perceive a leaf as green because wavelengths in the green region of the spectrum are reflected by pigments in the leaf, while the other visible wavelengths are absorbed. In addition, the components in plants reflect, transmit, and absorb different portions of the near-infrared radiation that we cannot see.
Reflected near-infrared radiation can be sensed by satellites, allowing scientists to study vegetation from space. Healthy vegetation absorbs blue- and red-light energy to fuel photosynthesis and create chlorophyll. A plant with more chlorophyll will reflect more near-infrared energy than an unhealthy plant. Thus, analyzing a plants spectrum of both absorption and reflection in visible and in infrared wavelengths can provide information about the plants' health and productivity.

INFRARED FILM
Color Infrared film can record near-infrared energy and can help scientists study plant diseases where there is a change in pigment and cell structure. These two images show the difference between a color infrared photo and a natural color photo of trees in a park.

SPECTRAL SIGNATURES OF VEGETATION
Data from scientific instruments can provide more precise measurements than analog film. Scientists can graph the measurements, examine the unique patterns of absorption and reflection of visible and infrared energy, and use this information to identify types of plants. The graph below shows the differences among the spectral signatures of corn, soybeans, and Tulip Poplar trees.

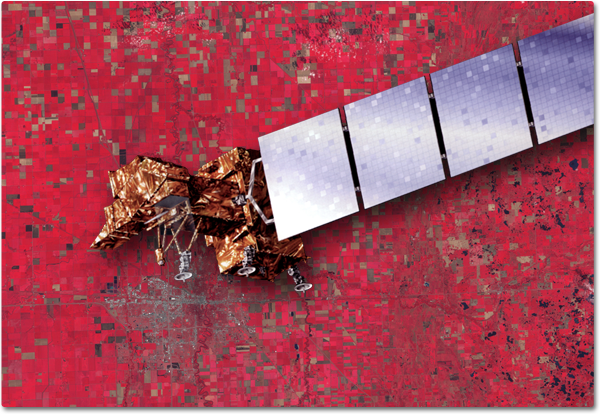
ASSESSING VEGETATION FROM SPACE
Data and imagery from the U.S. Geological Service (USGS) and NASA Landsat series of satellites are used by the U.S. Department of Agriculture to forecast agricultural productivity each growing season. Satellite data can help farmers pinpoint where crops are infested, stressed, or healthy.
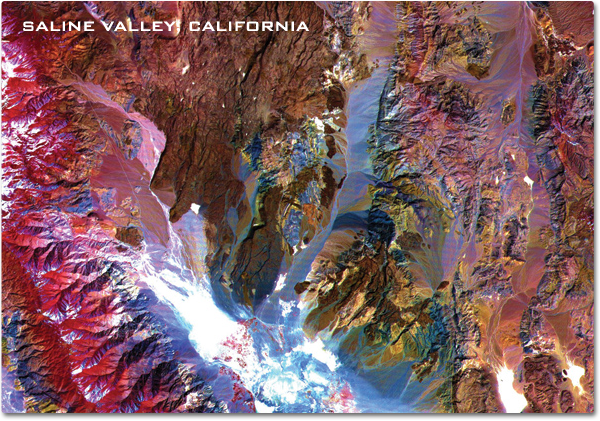
SOIL COMPOSITION
Near-infrared data can also help identify types of rock and soil. This image of the Saline Valley area in California was acquired by the Advanced Spaceborne Thermal Emission and Reflection Radiometer (ASTER) onboard NASA's Terra satellite.
Data from ASTER's visible and near-infrared bands at 0.81 µm, 0.56 µm, and .66 µm are composited in red, green, and blue creating the false-color image below. Vegetation appears red, snow and dry salt lakes are white, and exposed rocks are brown, gray, yellow, and blue. Rock colors mainly reflect the presence of iron minerals and variations in albedo (solar energy reflected off the surface).
PLANETS IN NEAR-INFRARED
This false-color composite of Jupiter combines near-infrared and visible-light data of sunlight reflected from Jupiter's clouds. Since methane gas in Jupiter's atmosphere limits the penetration of sunlight, the amount of reflected near-infrared energy varies depending on the clouds' altitude. The resulting composite image shows this altitude difference as different colors. Yellow colors indicate high clouds; red colors are lower clouds; and blue colors show even lower clouds in Jupiter's atmosphere. The Near Infrared Camera and Multi-Object Spectrometer (NICMOS) onboard NASA's Hubble Space Telescope captured this image at the time of a rare alignment of three of Jupiter's largest moons—Io, Ganymede, and Callisto—across the planet's face.

Citation
APA
National Aeronautics and Space Administration, Science Mission Directorate. (2010). Reflected Near-Infrared Waves. Retrieved [insert date - e.g. August 10, 2016], from NASA Science website: http://science.nasa.gov/ems/08_nearinfraredwaves
MLA
Science Mission Directorate. "Reflected Near-Infrared Waves" NASA Science. 2010. National Aeronautics and Space Administration. [insert date - e.g. 10 Aug. 2016] http://science.nasa.gov/ems/08_nearinfraredwaves