


















APOD
Astronomy Picture of the Day
Discover the cosmos! Each day a different image or photograph of our fascinating universe is featured, along with a brief explanation written by a professional astronomer.
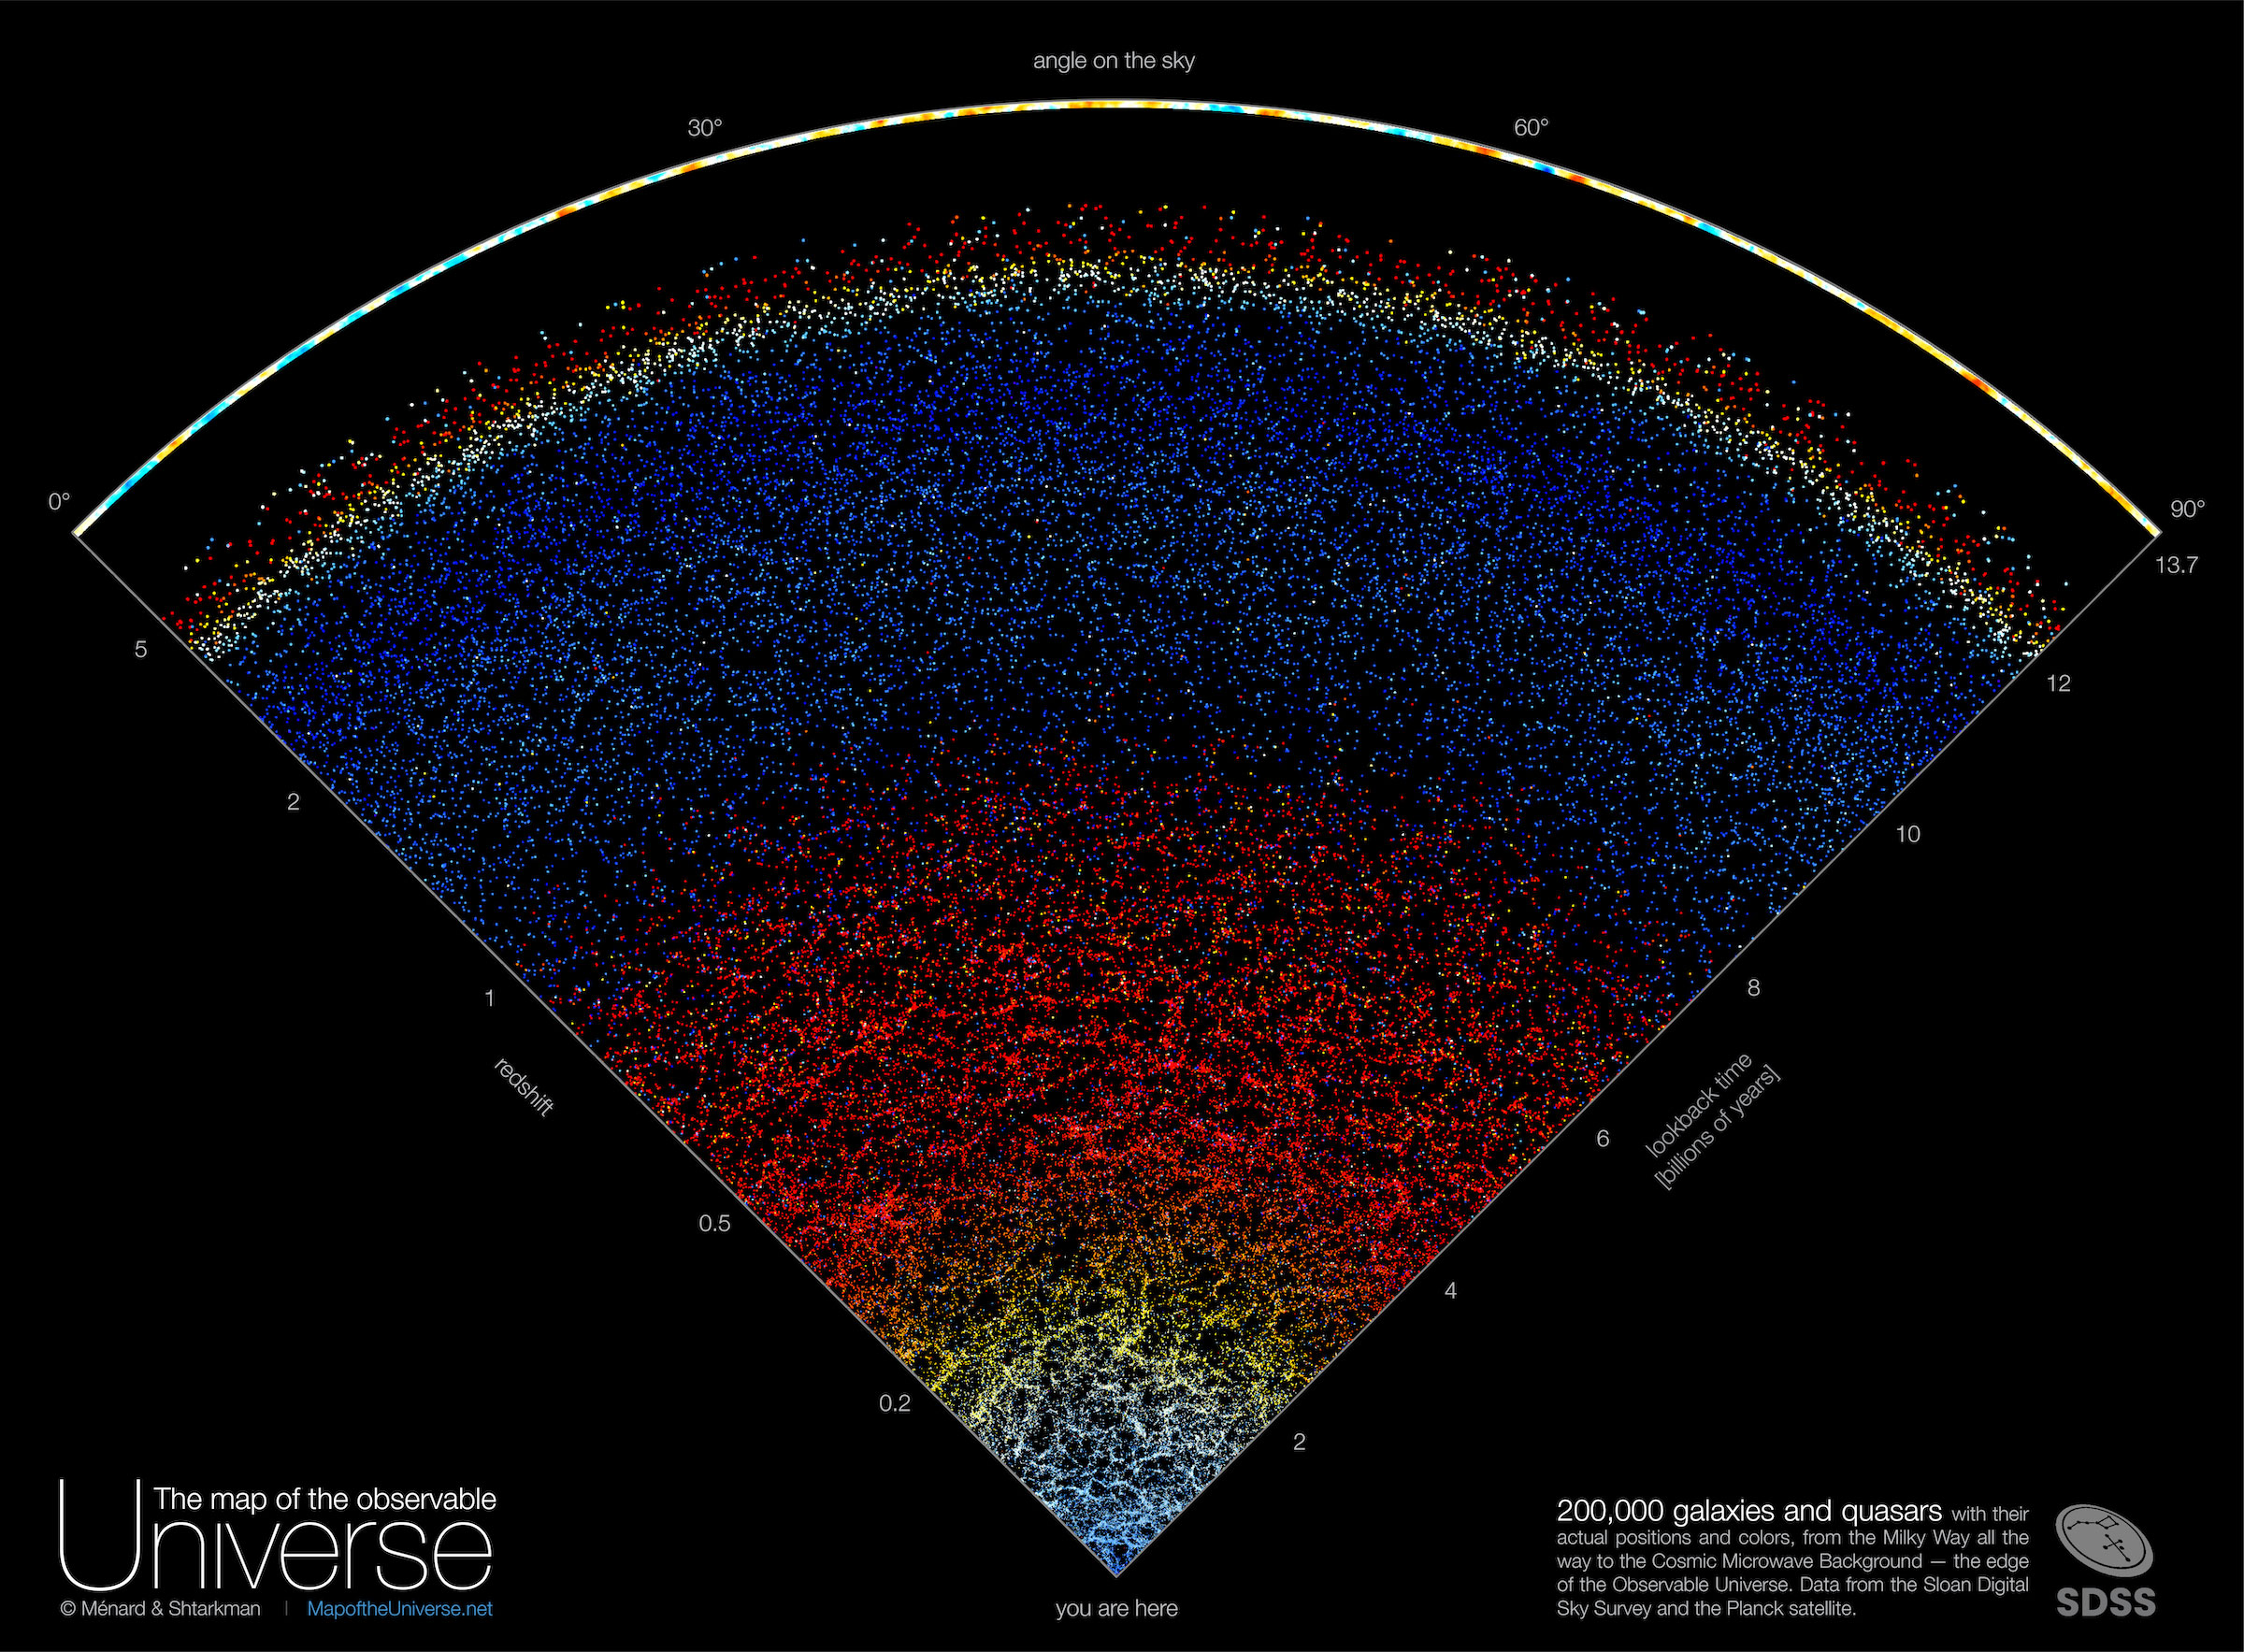
A Map of the Observable Universe
Explanation: What if you could see out to the edge of the observable universe ? You would see galaxies, galaxies, galaxies, and then, well, quasar s, which are the bright centers of distant galaxies . To expand understanding of the very largest scales that humanity can see, a map of the galaxies and quasars found by the Sloan Digital Sky Survey from 2000 to 2020 -- out to near the edge of the observable universe -- has been composed. Featured here , one wedge from this survey encompasses about 200,000 galaxies and quasars out beyond a look-back time of 12 billion years and cosmological redshift 5. Almost every dot in the nearby lower part of the illustration represents a galaxy , with redness indicating increasing redshift and distance. Similarly, almost every dot on the upper part represents a distant quasar , with blue-shaded dots being closer than red. Clearly shown among many discoveries , gravity between galaxies has caused the nearby universe to condense and become increasingly more filamentary than the distant universe .
More Detailed Maps: Related to Today's APOD
| Date | July 5, 2023 |
|---|---|
| Credit | Image Credit & Copyright: B. Ménard & N. Shtarkman ; Data: SDSS , Planck , JHU , Sloan , NASA , ESA |
| Authors & editors: | Robert Nemiroff (MTU) & Jerry Bonnell (UMCP) |
| A service of: |
ASD at NASA / GSFC, NASA Science Activation & Michigan Tech. U. |