


Monthly Solar Insolation Data Maps from CERES
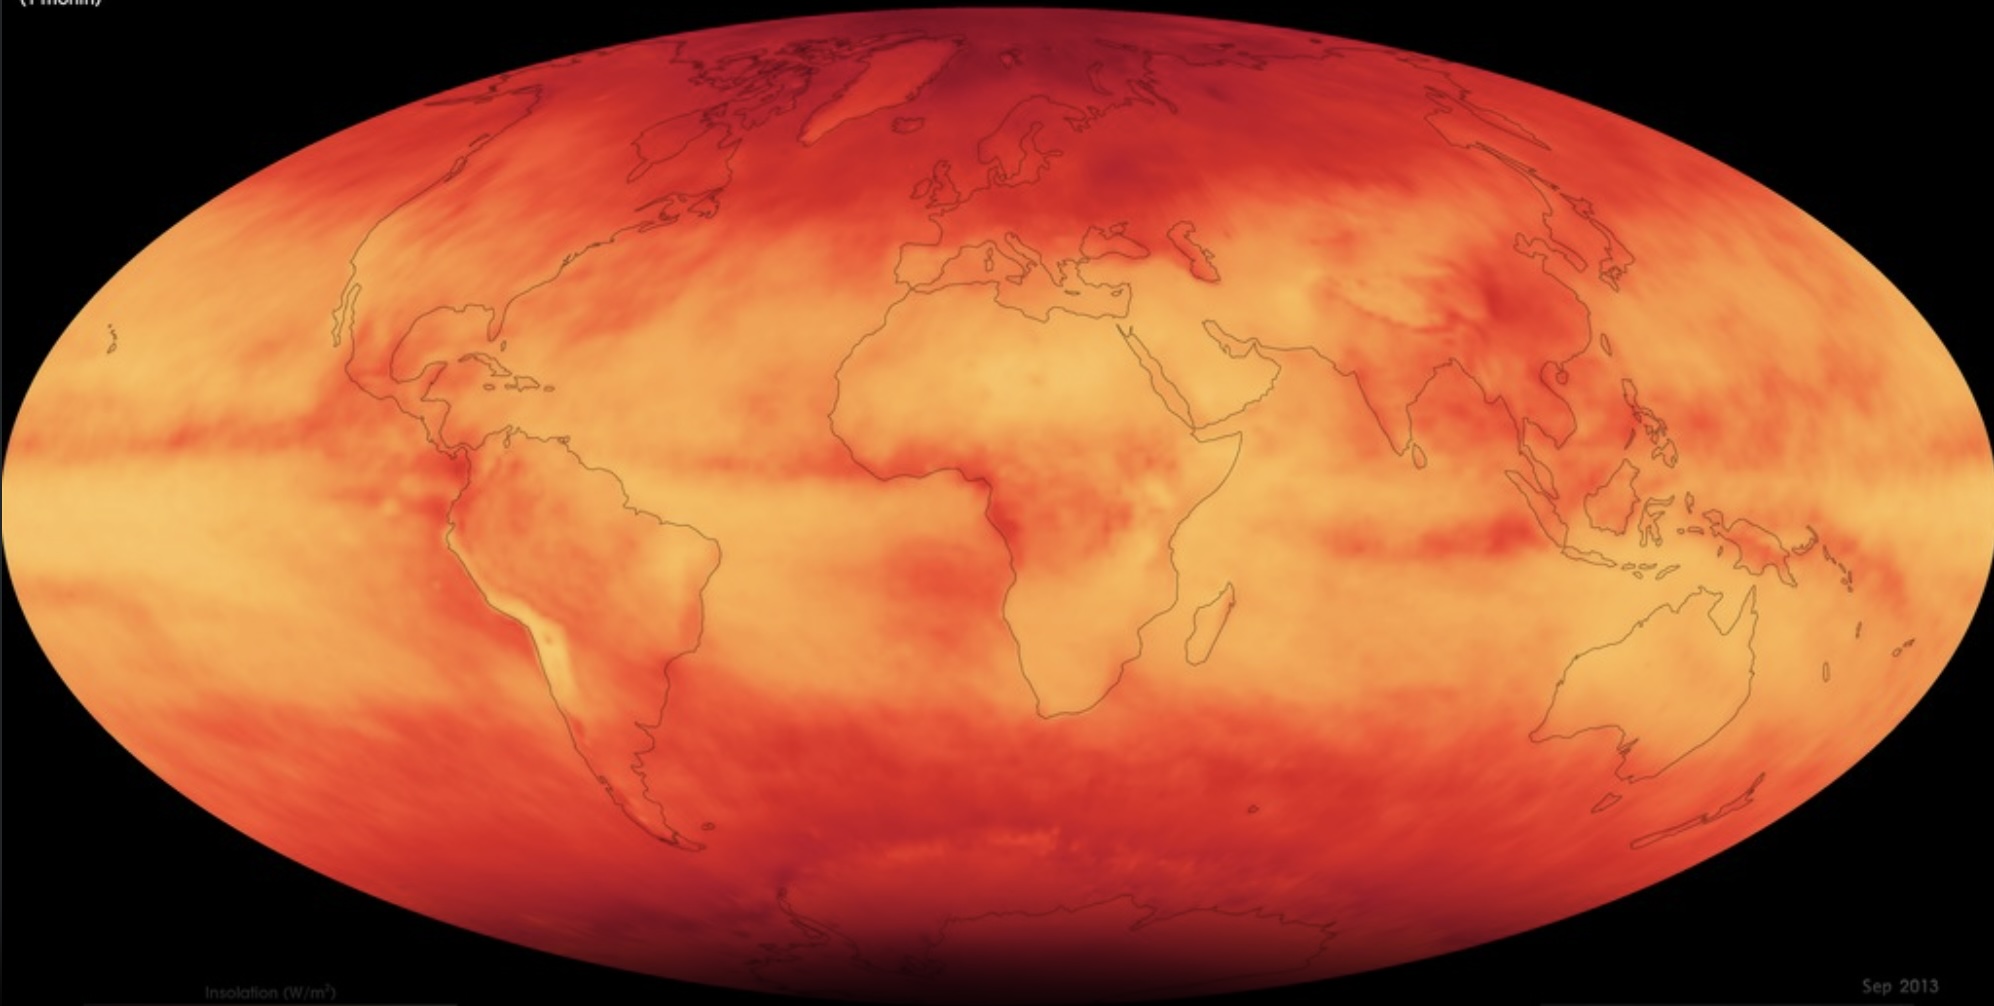
These maps show Earth's average monthly solar insolation, or the rate of incoming sunlight reaching the surface, from July 2006 to the present as derived from Clouds and Earth’s Radiant Energy System (CERES) measurements of radiant energy escaping the top of Earth's atmosphere.
NASA Langley Research Center
| Levels |
|
|---|---|
| Material Type |
|
| Heliophysics Big Ideas |
|
| NGSS |
|
| Heliophysics Topics |
|
| Related Missions |
|
| Material Cost per Learner | Free |
| Language | English |
This animation presented by NASA's Scientific Visualization Studio shows Earth's average monthly solar insolation, or the rate of incoming sunlight reaching the surface, from July 2006 to the present as derived from Clouds and Earth’s Radiant Energy System (CERES) measurements of radiant energy escaping the top of Earth's atmosphere.
The CERES project provides satellite-based observations of ERB and clouds. It uses measurements from CERES instruments flying on several satellites along with data from many other instruments to produce a comprehensive set of Earth's Radiation Budget (ERB) data products for climate, weather and applied science research.