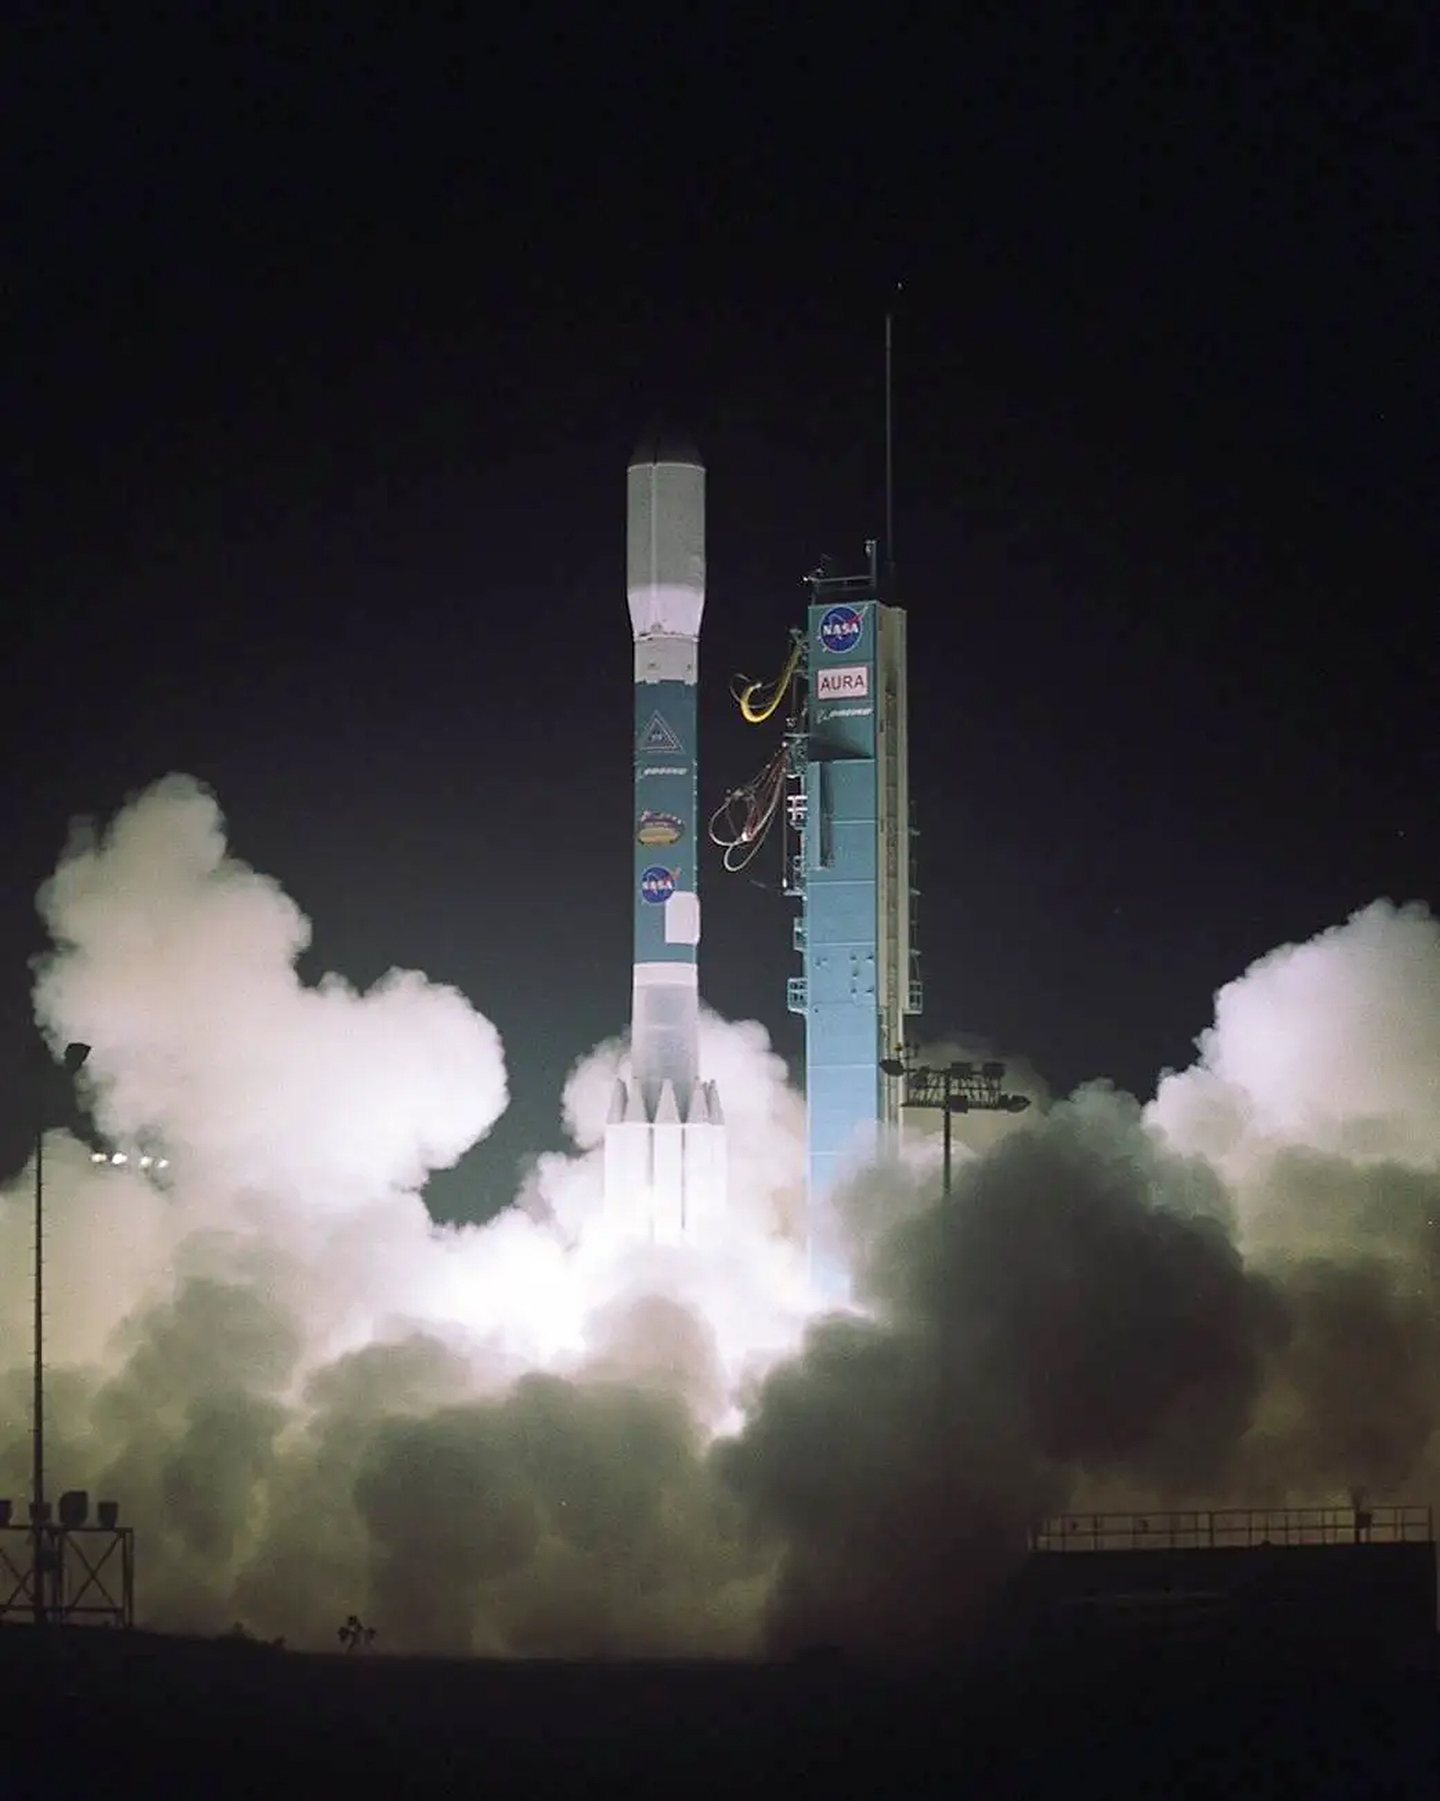
Earth Observer
The Earth Observer newsletter.
Figure 7. The CERES Earth Radiation Budget (ERB) climate data record shows a positive trend for the absorbed solar radiation...
![Sun Climate figure 7](https://science.nasa.gov/wp-content/uploads/2024/06/fig7adjust-ceres-erb-trends.png?w=4096&format=png)
Figure 1. The Total Solar Irradiance (TSI) composite record spans almost five decades and includes measurements from 13 different instruments...
![Sun Climate figure 1](https://science.nasa.gov/wp-content/uploads/2024/06/fig1adjust-tsi-composite.png?w=4096&format=png)
Photo. Attendees at the 2023 Sun–Climate Symposium in Flagstaff, AZ. Photo credit: Kelly Boden/LASP
![Sun Climate Group Photo](https://science.nasa.gov/wp-content/uploads/2024/06/photo-group-adjusted.jpg?w=4096&format=jpeg)
Map and photo credit: Mark Nebel/NPS
![Sun Climate Grand Canyon Map](https://science.nasa.gov/wp-content/uploads/2024/06/map-grand-canyon-adjusted.png?w=4096&format=png)
Figure 8. The San Fernando Observatory (SFO) [left] has been making visible [middle] and near ultraviolet (NUV) [right] solar images...
![Sun Climate Figure 8](https://science.nasa.gov/wp-content/uploads/2024/06/fig8adjusted-sfo-site-solar-images.png?w=4096&format=png)
Figure 6. The sunspot number progression (black) during solar cycle 25 is higher than predicted (red). The original NASA–NOAA panel...
![Sun Climate Figure 6](https://science.nasa.gov/wp-content/uploads/2024/06/fig6adjusted-sc25-prediction.png?w=4096&format=png)
Figure 5. The albedo differences between the visible and near-infrared bands are shown for the southern hemisphere (red line) and...
![Sun Climate Figure 5](https://science.nasa.gov/wp-content/uploads/2024/06/fig5adjusted-albedo-changes.png?w=4096&format=png)
Figure 4. The rainfall amount has shifted over the past fifty years (red is less and blue is more) with...
![Sun Climate Figure 4](https://science.nasa.gov/wp-content/uploads/2024/06/fig4adjusted-rainfall.png?w=4096&format=png)
Figure 3. Illustration of an exoplanet transit that will occult a starspot. The transit light curve can provide information about...
![Sun Climate figure 3](https://science.nasa.gov/wp-content/uploads/2024/06/fig3adjust-exoplanet-transit-starspot.png?w=4096&format=png)
Figure 2. The solar spectral irradiance (SSI) variability from TSIS-1 SIM is compared to the total solar irradiance (TSI) variability...
![Sun Climate Figure 2](https://science.nasa.gov/wp-content/uploads/2024/06/fig2adjusted-tsis-sim-tim.png?w=4096&format=png)
Figure 8. PAs effectively preserve additional AGC across continents and biomes, with forest biomes dominating the global signal, particularly in...
![GEDI figure 8](https://science.nasa.gov/wp-content/uploads/2024/06/gedi-figure-8-2.png?w=4096&format=png)
![](https://science.nasa.gov/wp-content/uploads/2024/06/calendar-subtopic-header.jpg?w=4096&format=jpeg)
![In Memoriam header](https://science.nasa.gov/wp-content/uploads/2024/06/im-subtopic-header.jpg?w=4096&format=jpeg)
Figure 2. Daytime variability of the median liquid cloud optical thickness over ocean for different seasons of the year derived...
![DSCVR Figure 2](https://science.nasa.gov/wp-content/uploads/2024/06/dscvr-figure-2-2.png?w=4096&format=png)
Figure 1. Sun-Earth-Vehicle (SEV) angle (red curve) and the distance between Earth and the DSCOVR satellite (blue curve) versus time...
![DSCVR figure 1](https://science.nasa.gov/wp-content/uploads/2024/06/dscvr-figure-1-2.png?w=4096&format=png)
![Earth Observer Editor's Corner subtopic header](https://science.nasa.gov/wp-content/uploads/2024/06/ec-subtopic-header.jpg?w=4096&format=jpeg)
![NASA Calendar Grid](https://science.nasa.gov/wp-content/uploads/2024/06/calendar-grid.png?w=4096&format=png)
![Meeting Summaries subtopic header](https://science.nasa.gov/wp-content/uploads/2024/06/ms-subtopic-header.jpg?w=4096&format=jpeg)
![Archives subtopic header](https://science.nasa.gov/wp-content/uploads/2024/06/archives-subtopic-header-2.jpg?w=4096&format=jpeg)
![News Subtopic header](https://science.nasa.gov/wp-content/uploads/2024/06/news-subtopic-header.jpg?w=4096&format=jpeg)
![Featured Articles subheader](https://science.nasa.gov/wp-content/uploads/2024/06/fa-subtopic-header-2.jpg?w=4096&format=jpeg)
Photo: Pictured here are the in-person attendees of the 2023 GRACE-FO Science Team. Another 52 people participated online. Image credit:...
![GRACE team photo](https://science.nasa.gov/wp-content/uploads/2024/05/grace-photo.jpg?w=4096&format=jpeg)
Figure 1. The top row of maps show estimates of individual components of the observed sea level trend in the...
![GRACE figure 1](https://science.nasa.gov/wp-content/uploads/2024/05/grace-figure-1.png?w=4096&format=png)
Figure 6. [Top] Average lidar canopy height at 0.01° resolution in. computed by gridding both GEDI and ICESat-2 together, and...
![GEDI figure 6](https://science.nasa.gov/wp-content/uploads/2024/05/gedi-figure-6-2.png?w=4096&format=png)
Photo. GEDI Science Team meeting in-person and virtual attendees. Photo credit: Talia Schwelling
![GEDI group photo](https://science.nasa.gov/wp-content/uploads/2024/05/gedi-photo.jpg?w=4096&format=jpeg)
Figure 9. Forest biomass estimates, in the format of Intergovernmental Panel on Climate Change (IPCC) Tier 1 values from NASA...
![GEDI figure 9](https://science.nasa.gov/wp-content/uploads/2024/05/gedi-figure-9.png?w=4096&format=png)
Figure 8. The GEDI-domain protected areas cover a range of biomes. Figure credit: Laura Duncanson/published in a 2023 paper in...
![GEDI figure 8](https://science.nasa.gov/wp-content/uploads/2024/05/gedi-figure-8.png?w=4096&format=png)
Figure 7. [Top] Protected areas (Pas) such as national parks can reduce habitat loss and degradation (from logging) and extractive...
![GEDI figure 7](https://science.nasa.gov/wp-content/uploads/2024/05/gedi-figure-7.png?w=4096&format=png)
Figure 5. Female Downy Woodpecker with tree cavity in which other organisms may use in the future for habitat. Woodpecker...
![GEDI figure 5](https://science.nasa.gov/wp-content/uploads/2024/05/gedi-figure-5.jpg?w=4096&format=jpeg)
Figure 4. Gridded mean aboveground biomass density [top] and standard error of the mean [bottom] from Version 2.1 of the...
![GEDI figure 4](https://science.nasa.gov/wp-content/uploads/2024/05/gedi-figure-4.png?w=4096&format=png)
Figure 3. Salar de Uyuni, the world's largest salt flat as seen from the International Space Station. Figure credit: Samantha...
![GEDI figure 3](https://science.nasa.gov/wp-content/uploads/2024/05/gedi-figure-3.jpg?w=4096&format=jpeg)
Figure 2. NASA GEDI mission move from EFU-6 to EFU-7 on the ISS on 17 March 2023. GEDI was in...
![GEDI figure 2](https://science.nasa.gov/wp-content/uploads/2024/05/gedi-figure-2.jpg?w=4096&format=jpeg)
Figure 2. NASA GEDI mission move from EFU-6 to EFU-7 on the ISS on 17 March 2023. GEDI was in...
![GEDI figure 2](https://science.nasa.gov/wp-content/uploads/2024/05/gedi-figure-2-1.jpg?w=4096&format=jpeg)
Figure 1. Country-wide estimates of total aboveground biomass (GEDI_L4B_AGB) in peta grams (Pg) using GEDI L4B Version 2.1 dataset. Figure...
![GEDI figure 1](https://science.nasa.gov/wp-content/uploads/2024/05/gedi-figure-1.png?w=4096&format=png)
[left] NASA Science teams meet at the San Francisco Marriott Union Square for the annual Strategic Content and Integration Meeting....
![AGU Sidebar Photo](https://science.nasa.gov/wp-content/uploads/2024/05/agu-sidebarphoto-1.jpg?w=4096&format=jpeg)
Photo 14. SMD Art Director Jenny Mottar interacts with AGU attendees during one of six scheduled Science Explorer poster signings....
![AGU photo 14](https://science.nasa.gov/wp-content/uploads/2024/05/agu-photo-14.jpg?w=4096&format=jpeg)
Photo 13. [top left] Carter Emmart [OpenSpace—Creative Lead] conducts a tech demo on the capabilities of the data visualization software....
![AGU Photo 13](https://science.nasa.gov/wp-content/uploads/2024/05/agu-photo-13.jpg?w=4096&format=jpeg)
Photo 12. [left] A model of the surface of Jupiter’s moon Europa inspires AGU attendees to learn more about NASA’s...
![AGU Photo 12](https://science.nasa.gov/wp-content/uploads/2024/05/agu-photo-12.jpg?w=4096&format=jpeg)
Photo 11. A collection of 2024 NASA Science Planning Guides are organized near the entrance to the Moscone West exhibit...
![AGU Photo 11](https://science.nasa.gov/wp-content/uploads/2024/05/agu-photo-11.jpg?w=4096&format=jpeg)
Photo 10. AGU attendees explore their copies of the coveted 2024 NASA Science Planning Guide as they arrive at the...
![AGU Photo 10](https://science.nasa.gov/wp-content/uploads/2024/05/agu-photo-10.jpg?w=4096&format=jpeg)
Photo 9. Members of NASA’s Global Learning and Observation to Benefit the Environment (GLOBE) program and AGU attendees pose with...
![AGU Photo 9](https://science.nasa.gov/wp-content/uploads/2024/05/agu-photo-9.jpg?w=4096&format=jpeg)
Photo 8. An image of the “Through the Eyes of NASA” photowall, featuring artwork from Jenny Mottar [NASA HQ—SMD Art...
![AGU Photo 8](https://science.nasa.gov/wp-content/uploads/2024/05/agu-photo-8.jpg?w=4096&format=jpeg)
Photo 7. Joseph Westlake [NASA HQ—Director of the Heliophysics Division] addresses an audience of AGU attendees from the NASA Hyperwall...
![AGU photo 7](https://science.nasa.gov/wp-content/uploads/2024/05/agu-photo-7.jpg?w=4096&format=jpeg)
Photo 6. Mark Subbarao [GSFC—Director of NASA’s Scientific Visualization Studio] discusses the studio’s latest data visualization efforts and shares some...
![AGU Photo 6](https://science.nasa.gov/wp-content/uploads/2024/05/agu-photo-6.jpg?w=4096&format=jpeg)
Photo 5. Mark Clampin [NASA HQ—Director of SMD’s Astrophysics Division] discusses the state of NASA’s broad suite of astrophysics missions...
![AGU photo 5](https://science.nasa.gov/wp-content/uploads/2024/05/agu-photo-5.jpg?w=4096&format=jpeg)
Photo 4. Lori Glaze [NASA HQ—Director of SMD’s Planetary Science Division] gave a presentation that focused on the success of...
![AGU Photo 4](https://science.nasa.gov/wp-content/uploads/2024/05/agu-photo-4.jpg?w=4096&format=jpeg)
Photo 3. Karen St. Germain [NASA HQ—Director of SMD’s Earth Science Division] delivers her Hyperwall presentation, titled “An Overview of...
![AGU Photo 3](https://science.nasa.gov/wp-content/uploads/2024/05/agu-photo-3.jpg?w=4096&format=jpeg)
Photo 2. Nicola Fox [NASA HQ—Associate Administrator of SMD] provides an overview of NASA’s Heliophysics Division in front of the...
![AGU Photo 2](https://science.nasa.gov/wp-content/uploads/2024/05/agu-photo-2.jpg?w=4096&format=jpeg)
Photo 1. [left] The NASA Science exhibit at AGU23 as viewed from the front of the NASA Hyperwall, where attendees...
![AGU photo 1](https://science.nasa.gov/wp-content/uploads/2024/05/agu-photo-1.jpg?w=4096&format=jpeg)
Photo. Student teams and their mentors at the 2019 NASA DeepRacer Challenge, a collaborative event between ESTO and Amazon Web...
![ESTO Team Photo](https://science.nasa.gov/wp-content/uploads/2024/05/img-1864.jpg?w=4096&format=jpeg)
Figure 4. The chart shows the overall distribution of start (blue curve) and end (orange curve) of of the 812...
![ESTO Figure 4](https://science.nasa.gov/wp-content/uploads/2024/05/esto-figure4.png?w=4096&format=png)
Figure 3. Nearly 90% of the 812 projects that have graduated from ESTO funding and were assessed for TRL have...
![ESTO Figure 3](https://science.nasa.gov/wp-content/uploads/2024/05/esto-figure3.png?w=4096&format=png)
Figure 2. The ESTO Technology Readiness Level (TRL) scale helps track the development of most projects in its portfolio. ESTO...
![ESTO Figure 2](https://science.nasa.gov/wp-content/uploads/2024/05/esto-figure2.png?w=4096&format=png)
Figure 1. Breakdown of organization affiliations of ESTO PIs and Co-PIs. Image credit: Philip Larkin/GSFC
![ESTO Figure 1](https://science.nasa.gov/wp-content/uploads/2024/05/esto-figure1.png?w=4096&format=png)
Photo. Dr. Richard (Rich) Stolarski in February, 1989 at the NASA Arctic Airborne Stratospheric Experiment (AASE-I) in Stavanger, Norway. Rich...
![In Memoriam Dr. Richard Stolarski](https://science.nasa.gov/wp-content/uploads/2024/05/stolarski.jpg?w=4096&format=jpeg)
Figure. The Ocean Color Instrument (OCI) on NASA’s PACE mission detects light across a hyperspectral range, which gives scientists new...
![March Editor's Corner Image](https://science.nasa.gov/wp-content/uploads/2024/05/eo-editorscorner-mar.jpg?w=4096&format=jpeg)
Photo. Mary at work on the Space Shuttle Atlantis, May 1989. Photo credit: NASA
![Mary Cleave on Space Shuttle Atlantis](https://science.nasa.gov/wp-content/uploads/2024/05/mary-cleave-2.jpg?w=4096&format=jpeg)
Mary Cleave [1947–2023]. Photo credit: NASA
![Mary Cleave photo](https://science.nasa.gov/wp-content/uploads/2024/05/mary-cleave-1.jpg?w=4096&format=jpeg)
Figure 4. Characteristics of a diverse and inclusive community from the September 7, 2023, engagement activity responses (total respondents: 49)....
![PACE figure 4](https://science.nasa.gov/wp-content/uploads/2024/05/pace-figure4.png?w=4096&format=png)
Figure 3. Engagement activity statements and responses collected to assess level of PACE user concern with aspects of data discovery,...
![PACE figure 3](https://science.nasa.gov/wp-content/uploads/2024/05/pace-figure3.png?w=4096&format=png)
Figure 2. Responses to a pre-workshop questionnaire assessing respondents’ readiness to use PACE data (total respondents: 993). Image Credit: PACE...
![PACE figure 2](https://science.nasa.gov/wp-content/uploads/2024/05/pace-figure2.png?w=4096&format=png)
Figure 1. PACE Applications Workshop Progression from 2020 to 2025. Image credit: NASA PACE Applications Program
![PACE figure 1](https://science.nasa.gov/wp-content/uploads/2024/05/pace-figure1.png?w=4096&format=png)
Photo. Some of the attendees at the fifty-second ASTER STM. Photo credit: Mako Komoda, JSS
![ASTER group photo](https://science.nasa.gov/wp-content/uploads/2024/05/aster-photo-1.jpg?w=4096&format=jpeg)
Figure 3. ASTER and Landsat 8 and 9 data provide a way to compare the satellite-derived temperature and lake surface...
![ASTER Figure 3](https://science.nasa.gov/wp-content/uploads/2024/05/aster-figure-3.png?w=4096&format=png)
Figure 2. Three-dimensional plots show heat flux and temperature plots (further explained in the text) for hundreds of ASTER TIR...
![ASTER Figure 2](https://science.nasa.gov/wp-content/uploads/2024/05/aster-figure-2.png?w=4096&format=png)
Figure 1. Google Earth Image of landfill in India [top] and temporal changes in volume from 2001 to 2021 [bottom]....
![ASTER Figure 1](https://science.nasa.gov/wp-content/uploads/2024/05/aster-figure-1.png?w=4096&format=png)
![In The News Banner](https://science.nasa.gov/wp-content/uploads/2024/05/eo-in-the-news-banner.png?w=4096&format=png)
![In Memoriam Banner](https://science.nasa.gov/wp-content/uploads/2024/05/eo-in-memoriam-banner.png?w=4096&format=png)
![Earth Science In The News Banner](https://science.nasa.gov/wp-content/uploads/2024/05/eo-earth-science-itn-banner.png?w=4096&format=png)
Figure 6. SHADOZ and IAGOS time series of average ozone amounts in parts-per-billion by volume (ppbv) in the 700–300 hPa...
![SHADOZ figure 6](https://science.nasa.gov/wp-content/uploads/2024/05/shadoz-figure-6.png?w=4096&format=png)
Figure 5. GSFC Multiple Linear Regression (MLR) model trends for lowermost stratosphere (LMS; 15–20 km, or 9–12 mi) ozone in...
![SHADOZ figure 5](https://science.nasa.gov/wp-content/uploads/2024/05/shadoz-figure-5.png?w=4096&format=png)
Figure 4. Coincident ozonesonde and satellite comparisons in percent difference for the La Réunion station. [Top] Time series comparisons of...
![SHADOZ figure 4](https://science.nasa.gov/wp-content/uploads/2024/05/shadoz-figure-4.png?w=4096&format=png)
Figure 3. Total number of archived SHADOZ ozonesonde profiles for each year from 1998–2023. Note that 2023 is an estimate...
![SHADOZ figure 3](https://science.nasa.gov/wp-content/uploads/2024/05/shadoz-figure-3.png?w=4096&format=png)
Figure 2. Timeline of ozone-measuring satellites that have used SHADOZ ozonesonde data for algorithm development and validation since 1995. Editor’s...
![SHADOZ figure 2](https://science.nasa.gov/wp-content/uploads/2024/05/shadoz-figure-2.png?w=4096&format=png)
Figure 1. Map of SHADOZ stations where more than 10 years of data have been collected—from 1998–2023. Periods of operations...
![SHADOZ figure 1](https://science.nasa.gov/wp-content/uploads/2024/05/shadoz-figure-1.png?w=4096&format=png)
Figure 3. EPIC image taken over Mexico on July 4, 2018. The red, white and blue spot over central Mexico...
![DSCVR figure 3](https://science.nasa.gov/wp-content/uploads/2024/05/dscvr-figure-3.jpg?w=4096&format=jpeg)
Figure 2. Daytime variability of the median liquid cloud optical thickness over ocean for different seasons of the year derived...
![DSCVR figure 2](https://science.nasa.gov/wp-content/uploads/2024/05/dscvr-figure-2.png?w=4096&format=png)
Figure 1. Sun-Earth-Vehicle (SEV) angle (red curve) and the distance between Earth and the DSCOVR satellite (blue curve) versus time...
![DSCVR figure 1](https://science.nasa.gov/wp-content/uploads/2024/05/dscvr-figure-1.png?w=4096&format=png)
Photo. Attendees of the 2023 PMM STM in front of the McNamara Alumni Center in Minneapolis, MN. Photo credit: Chris...
![PPM Group Photo](https://science.nasa.gov/wp-content/uploads/2024/05/pmm-group-photo.jpg?w=4096&format=jpeg)
Figure 3. Evaluation of passive microwave (PMW) frequencies and coverage to assess data gaps and needs for the future of...
![PPM Figure 3](https://science.nasa.gov/wp-content/uploads/2024/05/pmm-figure-3.png?w=4096&format=png)
Figure 2. A technique for retrieving hydrometeor information from GMI brightness temperature. In these RGB plots, snow and rain are...
![PMM Figure 2](https://science.nasa.gov/wp-content/uploads/2024/05/pmm-figure-2.png?w=4096&format=png)
Figure 1. Evaluation of DPR product improvements from V06 to V07. Dual frequency product has smaller bias than KuPR product....
![PMM Figure 1](https://science.nasa.gov/wp-content/uploads/2024/05/pmm-figure-1.png?w=4096&format=png)
Daniel Segessenman [ESIP Community Fellow] explains his poster at the Research Showcase in Burlington, VT. Photo credit: Homer Horowitz
![ESIP Sidebar Photo](https://science.nasa.gov/wp-content/uploads/2024/05/esip-sidebar-open-science.jpg?w=4096&format=jpeg)
Photo 2. The ESIP Teacher Workshop took participants outside to test the solar eclipse gear they will use in their...
![ESIP Photo 2](https://science.nasa.gov/wp-content/uploads/2024/05/esip-photo-2.jpg?w=4096&format=jpeg)
Photo 1. ESIP celebrated its 25th anniversary in 2023. Founded as a knowledge sharing space, the nonprofit has grown as...
![ESIP Photo 1](https://science.nasa.gov/wp-content/uploads/2024/05/esip-photo-1.jpg?w=4096&format=jpeg)
Figure 1: Scott Reinhard from the New York Times uses national and state geospatial data to create data visualizations for...
![ESIP Figure 1](https://science.nasa.gov/wp-content/uploads/2024/05/esip-figure-1.png?w=4096&format=png)
![Gray Separator Line](https://science.nasa.gov/wp-content/uploads/2024/05/eo-grayseparator-line.png?w=4096&format=png)
![Black Separator Line](https://science.nasa.gov/wp-content/uploads/2024/05/eo-blackseparator-line.png?w=4096&format=png)
Figure 2. This graph shows the density of the water mass traveling northward from the tropics and sub-tropics toward the...
![OST Figure 2](https://science.nasa.gov/wp-content/uploads/2024/05/ost-figure-02.png?w=4096&format=png)
Figure 1. This graph shows the decadal variations of the Earth Energy Imbalance (EEI) estimated from the space geodetic method...
![OST Figure 1](https://science.nasa.gov/wp-content/uploads/2024/05/ost-figure-01.png?w=4096&format=png)
![separater line](https://science.nasa.gov/wp-content/uploads/2024/05/eo-separator-line.png?w=4096&format=png)
![](https://science.nasa.gov/wp-content/uploads/2024/05/eo-meeting-summary-banner.png?w=4096&format=png)
![Feature Article header](https://science.nasa.gov/wp-content/uploads/2024/05/eo-feature-article-banner.png?w=4096&format=png)
![Editor's Corner header](https://science.nasa.gov/wp-content/uploads/2024/05/eo-editors-corner-banner.png?w=4096&format=png)
![Ernie Hilsenrath Staff Pic](https://science.nasa.gov/wp-content/uploads/2024/05/ernie.jpg?w=4096&format=jpeg)
Figure 1. Depicts the key elements that organizations need for successful collective impact. Figure credit: Using a Collective Impact Approach...
![SciAct Figure 1](https://science.nasa.gov/wp-content/uploads/2024/05/sa-figure-1-2.png?w=4096&format=png)
Figure 3. The SciAct teams each develop partnerships with local, regional, or national organizations that can help them advance their...
![SciAct Figure 3](https://science.nasa.gov/wp-content/uploads/2024/04/sa-figure3.jpg?w=4096&format=jpeg)
Photo 3. Participants look at the results of a hands-on activity, one of the many types of SciAct resources and...
![SciAct photo 3](https://science.nasa.gov/wp-content/uploads/2024/04/sa-photo-3.jpg?w=4096&format=jpeg)
Figure 5. Since the start of 2021, more than half of the SciAct teams have focused their efforts on broadening...
![SciAct figure 5](https://science.nasa.gov/wp-content/uploads/2024/04/sa-figure-5.png?w=4096&format=png)
Figure 4. Histogram of citations for SciAct publications as of Oct. 31, 2023. Figure credit: Lin Chambers
![SciAct figure 4](https://science.nasa.gov/wp-content/uploads/2024/04/sa-figure-4.png?w=4096&format=png)
Photo 2. Participants work on the concept of stellar spectra with guidance from a NASA subject matter expert. Photo credit:...
![SciAct photo 2](https://science.nasa.gov/wp-content/uploads/2024/04/sa-photo-2.jpg?w=4096&format=jpeg)
Figure 2. This map shows locations where the SciAct teams conducted various learner interactions across the lower 48 states and...
![SciAct Figure 2](https://science.nasa.gov/wp-content/uploads/2024/04/sa-figure-2.jpg?w=4096&format=jpeg)
Photo 1. The SciAct community gathered for its most recent annual meeting in November 2023. Photo credit: NASA
![SciAct Team Photo](https://science.nasa.gov/wp-content/uploads/2024/04/sa-photo-1.jpg?w=4096&format=jpeg)
![Earth Observer page banner](https://science.nasa.gov/wp-content/uploads/2024/04/eo-page-banner.png?w=4096&format=png)
Photo. NASA’s Plankton, Aerosol, Cloud, ocean Ecosystem (PACE) spacecraft, atop a SpaceX Falcon 9 rocket, successfully lifts off from Space...
![PACE Launch photo](https://science.nasa.gov/wp-content/uploads/2024/04/ec-pace-launch.png?w=4096&format=png)
Figure. NASA’s Earth Surface Mineral Dust Source Investigation (EMIT) mapped hematite, goethite, and kaolinite in North Africa and the Arabian...
![EMIT Data Image](https://science.nasa.gov/wp-content/uploads/2024/04/ec-figure1.png?w=4096&format=png)
![Stacy Kish Pic](https://science.nasa.gov/wp-content/uploads/2024/03/stacy.jpg?w=4096&format=jpeg)
![Steven Platnick Pic](https://science.nasa.gov/wp-content/uploads/2024/03/steve.jpg?w=4096&format=jpeg)
![Doug Bennett Pic](https://science.nasa.gov/wp-content/uploads/2024/03/doug1.jpg?w=4096&format=jpeg)
![Mike Marosy Pic](https://science.nasa.gov/wp-content/uploads/2024/03/mike1.jpg?w=4096&format=jpeg)
![Dalia Kirshenblat Pic](https://science.nasa.gov/wp-content/uploads/2024/03/dalia.jpg?w=4096&format=jpeg)
![Alan Ward Pic](https://science.nasa.gov/wp-content/uploads/2024/03/alan.jpg?w=4096&format=jpeg)
![EO Banner](https://science.nasa.gov/wp-content/uploads/2024/03/eo-banner2.jpg?w=4096&format=jpeg)
![Earth Observer Main Banner](https://science.nasa.gov/wp-content/uploads/2024/02/eo-banner.jpg?w=4096&format=jpeg)