Due to the lapse in federal government funding, NASA is not updating this website.

Suggested Searches

Spectrometer Characteristics

Spectrometer Specifications

SpectralRange349.9 – 1053.5 nm
SpectralSampling2.83 nm
SpectralResolution (FWHM)3.5 nm typ
SpectralCalibration uncertainty<0.1 nm
SpatialField of view30.7°
SpatialInstantaneous FOV sampling0.882 mrad
SpatialIFOV resolution (FWHM)0.97 mrad
SpatialCross-track spatial pixels608
RadiometricRange0 – 99% R
RadiometricSampling14 bit
RadiometricCalibration uncertainty<2%
RadiometricSignal to Noise Ratio *500 @ 450 nm
RadiometricPolarization variation<1%
UniformitySpectral cross-track uniformity>95%
UniformitySpectral IFOV mixing uniformity>95%

* : at a single integration (167 Hz rate) and three-band aggregate (8.5 nm), 5% reflectance, 45° solar zenith, MODTRAN standard atmosphere

A line graph displaying the Signal-to-Noise Ratio (SNR) as a function of wavelength (in nanometers). The x-axis ranges from 350 nm to 1050 nm, and the y-axis (SNR) ranges from 0 to 600. Two lines are plotted: a red line shows higher SNR values, generally above 300 and peaking around 520, while a blue line shows lower SNR values, mostly below 300. Both lines exhibit significant fluctuations across the spectrum. Text on the graph indicates "R = 0.05, 45° solar zenith".

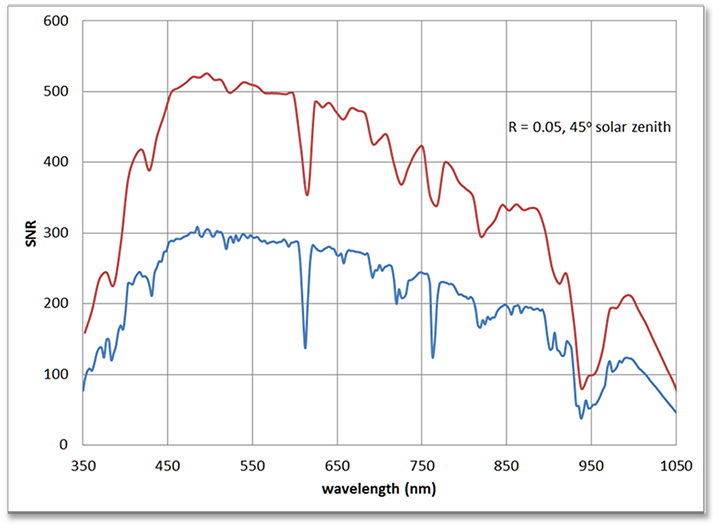
Signal to noise ratio through wavelength for low R (0.05) reference surface including standard atmosphere. Bottom curve is for a single 6ms integration and one spectral channel (2.83 nm). Top curve aggregates three spectral channels (8.5 nm). PRISM SNR is normally even higher due to forward oversampling (see flight envelope under “platforms.”)

A line graph showing multiple overlapping, bell-shaped curves representing normalized response functions across a wavelength range from approximately 648 nm to 672 nm. The y-axis, labeled "Norm. Response Function," ranges from 0 to 1. Each curve peaks at a different wavelength and is displayed in a distinct color, demonstrating the spectral response of multiple channels with slight overlap between adjacent channels. Small dotted lines follow the solid colored lines.

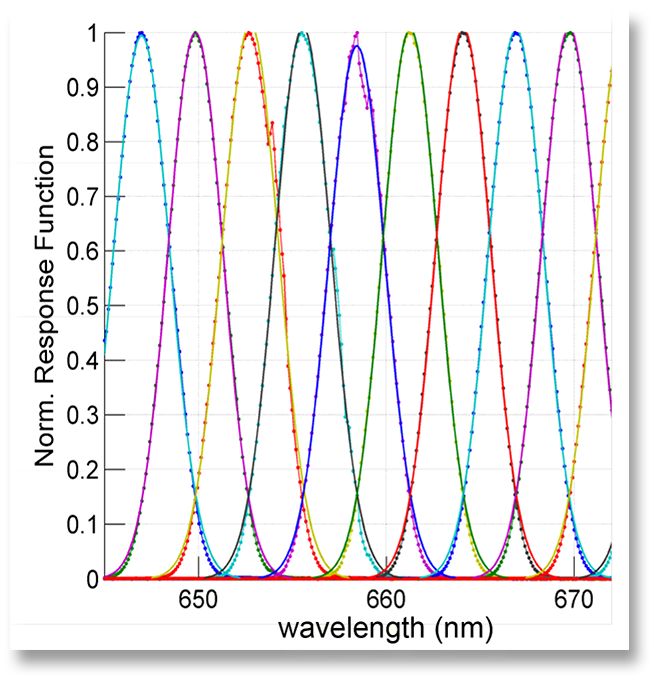
Typical spectral response functions obtained with a scanning monochromator, shown with interpolated Gaussian curves. PRISM has well-behaved nearly Gaussian spectral response.

A scatter plot with several overlaid trend lines. The x-axis is labeled "spectral channel #" and ranges from 0 to 250. The y-axis, "SRF FWHM (pixel units)," ranges from 1.0 to 1.5. Numerous small red square data points are scattered across the graph, generally forming a wavy pattern. Four black curved lines are drawn through the data, showing different fitted trends that broadly follow the distribution of the red data points. The lines show a peak in FWHM around spectral channel 75-100 and a dip around channel 200.

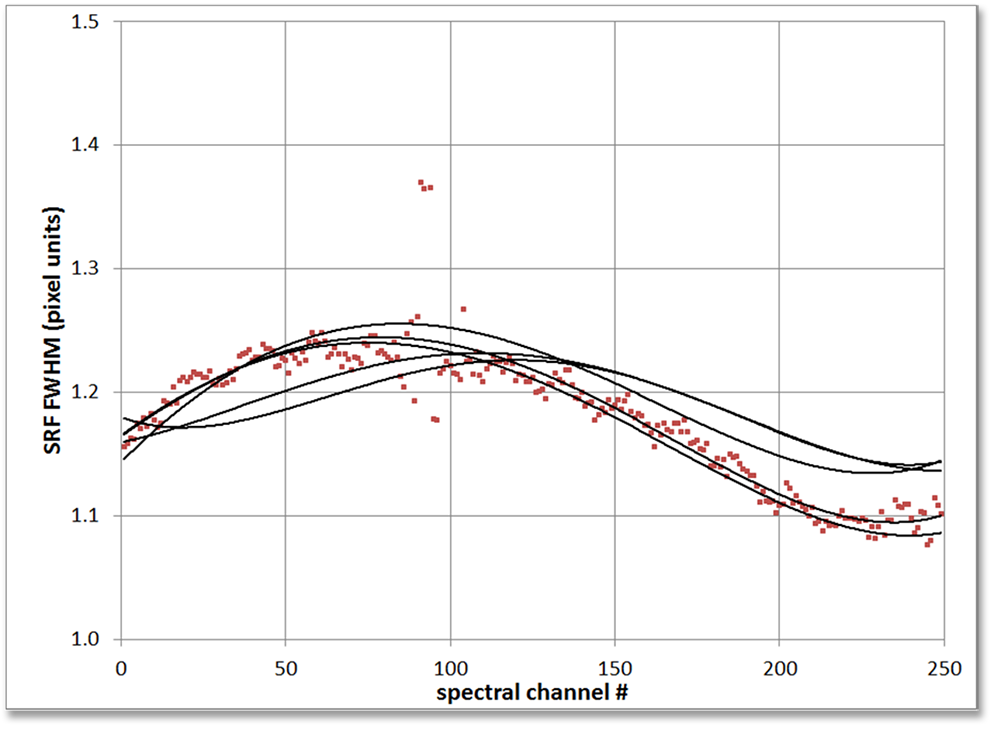
SRF FWHM from Gaussian fit as a function of wavelength (spectral channel #) for five field points across the PRISM field of view. Five interpolated lines are shown and one set of raw points. The field points are ±14.4°, ±8°, and 0°. The SRF width and shape is nearly independent of field location for any one wavelength.

A scatter plot showing "Pixel Units" (y-axis, ranging from -5.00E-02 to 5.00E-02) against "Spatial Pixel #" (x-axis, ranging from 20 to 620). The plot displays three sets of data points, each represented by a different color: blue for 437nm, green for 547nm, and red for 639nm. Each set of data points generally trends upwards from left to right, with some scatter. Overlaid on these points are three corresponding polynomial trend lines, each in the same color as its data set, indicating a slight positive correlation. A legend in the bottom right clarifies the colors for both the data points and the polynomial fits.

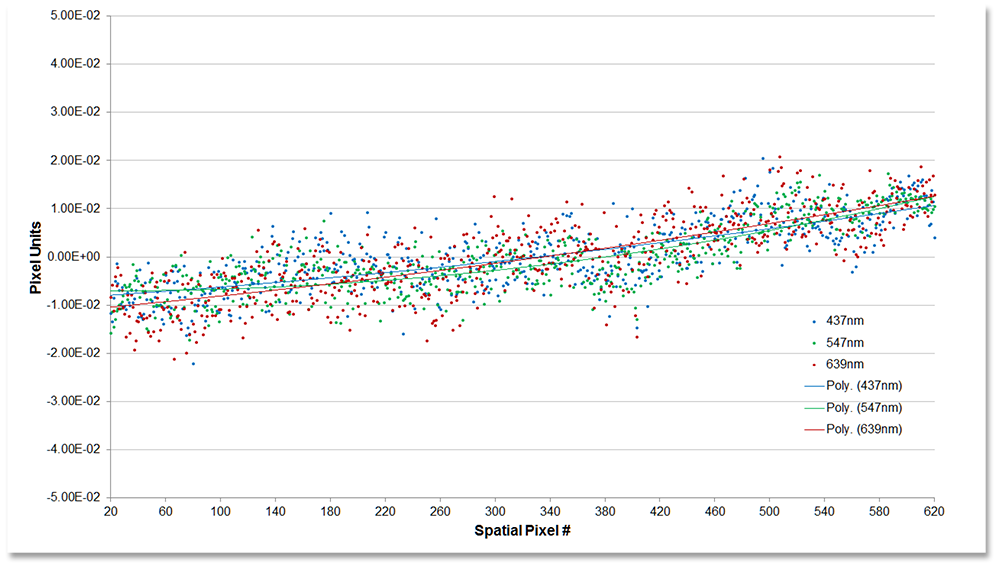
Scatter plot of spectral channel centroids as a function of spatial location for three isolated wavelengths (Hg lamp 437 nm and 547 nm, and laser at 632.8 nm). The centers of the SRF through field are aligned with the detector within 2% of a pixel (0.057 nm).

A line graph plotting "Norm. Response Function" (y-axis, from 0 to 1) against "Frame #" (x-axis, from 0 to 500). Multiple colored lines are clustered together, forming a steep, almost rectangular response curve that rises sharply around Frame #200, remains flat at a normalized response of nearly 1 until about Frame #330, and then drops sharply back to 0. A legend indicates that each line represents a different wavelength (λ) with a corresponding Full Width Half Maximum (FWHM) value, such as λ=451nm with FWHM=0.989, and λ=949nm with FWHM=0.987.

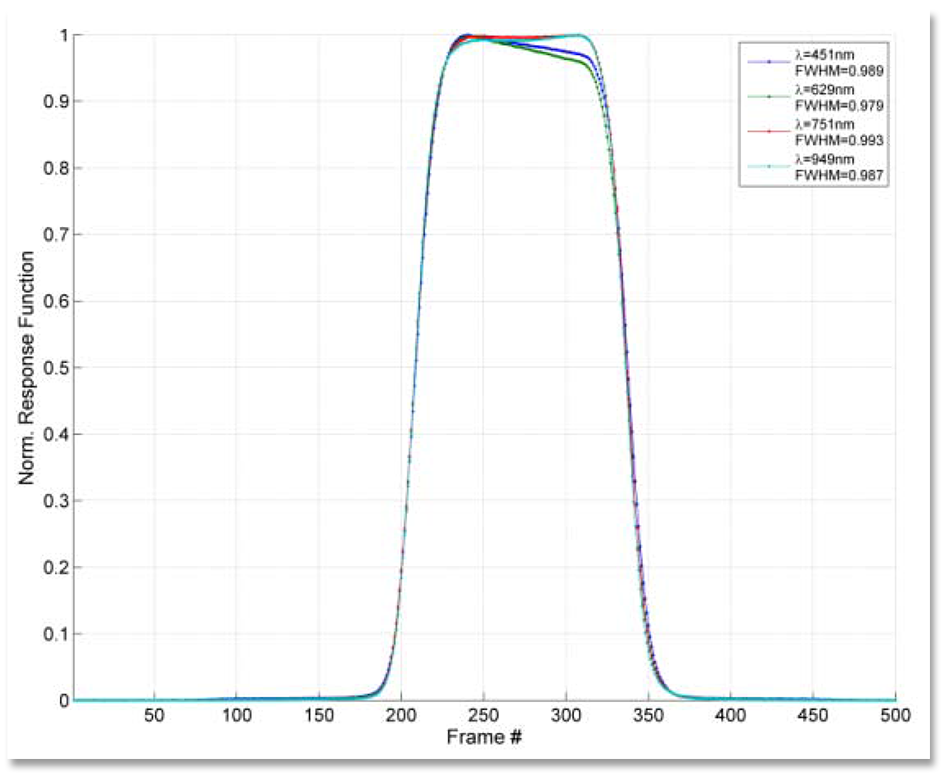
Along-track spatial response functions (ARF) for several wavelengths, without motion blur. The vertical axis is normalized to unity. The width is 1.1x sampling (slit width). The ARF is practically independent of wavelength.

A line graph plotting "Norm. Response Function" (y-axis, from 0 to 1) against "Frame #" (x-axis, from 0 to 700). The graph shows several distinct, narrow, bell-shaped curves, each peaking at a different frame number, representing different spectral channels. All curves reach a normalized response function of nearly 1 at their peaks. A legend in the top right corner lists the wavelength (λ) and Full Width Half Maximum (FWHM) for each of the five overlapping curves.

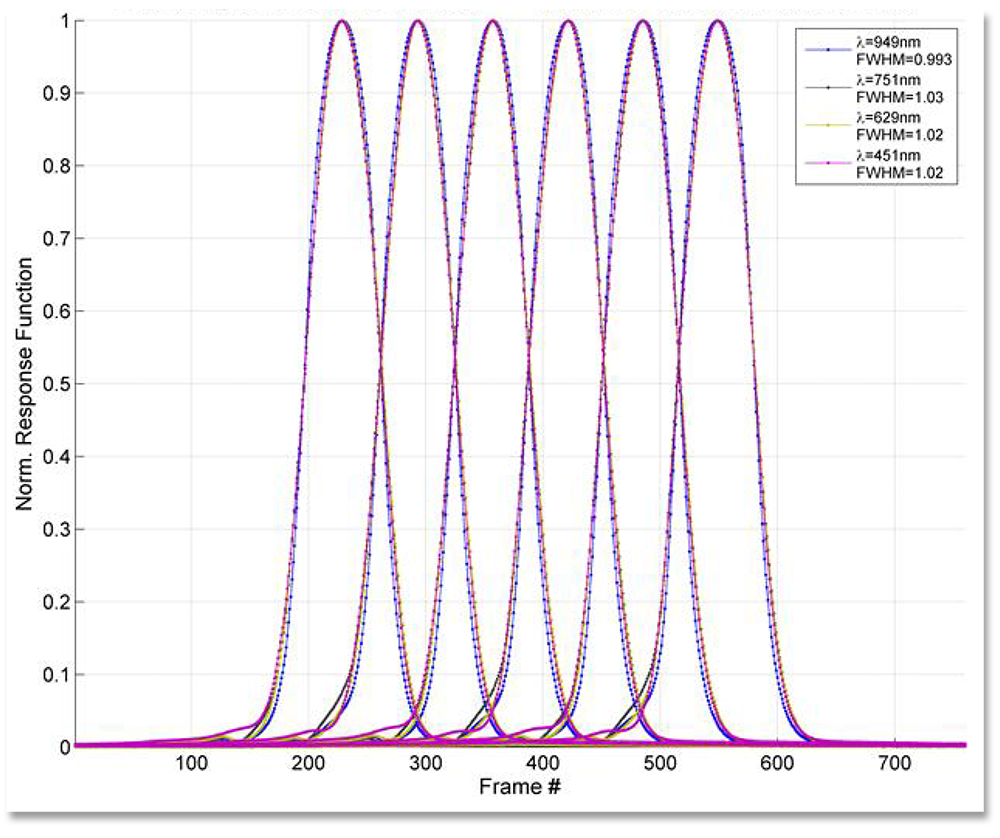
Typical cross-track spatial response functions (CRF) for adjacent pixels and several wavelengths. The vertical axis is normalized to unity. The total CRF variation with wavelength (non-uniformity) is ≤5% of a pixel.

A line graph plotting "Polarization variation in %" (y-axis, from 0 to 5%) against "wavelength (nm)" (x-axis, from 350 to 1050 nm). Five colored lines represent different polarization measurements, indicated by values like "-14.4", "-8", "0", "8", and "14.4" in the legend. Most lines show polarization variation generally below 1%, with a notable spike near 600 nm where some lines exceed 2%. A thick black horizontal line at 1% serves as a reference threshold.

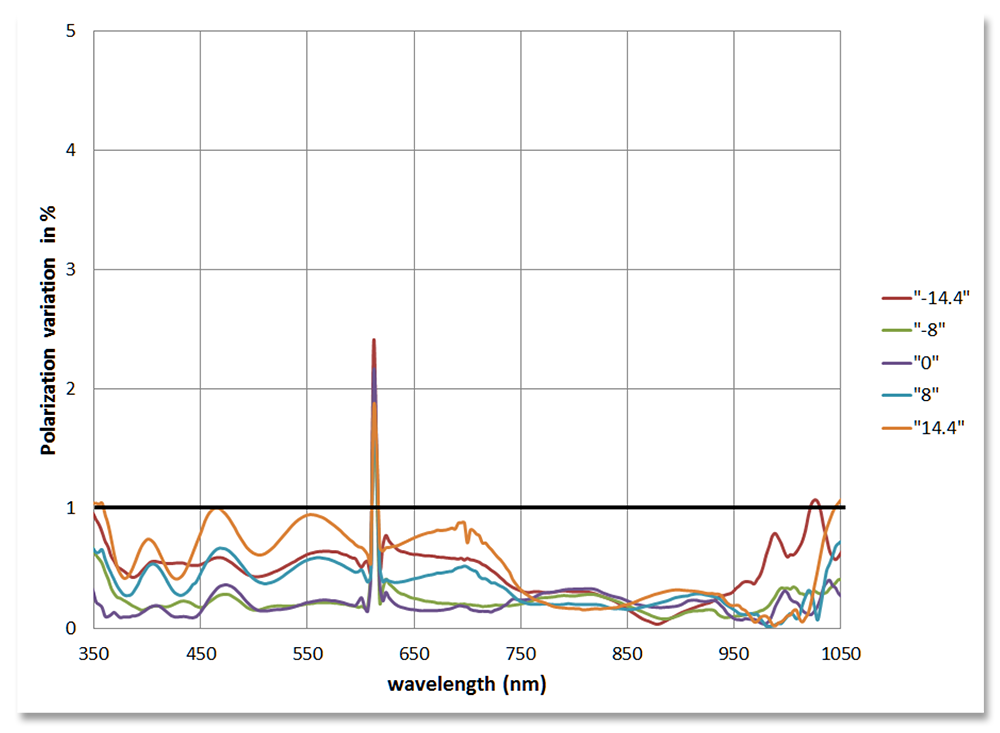
Polarization variation throughout the spectral range for five positions spanning the field of view. With the exception of the filter seam location, polarization variation remains at or below 1%.

Keep Exploring

Discover More Topics From NASA