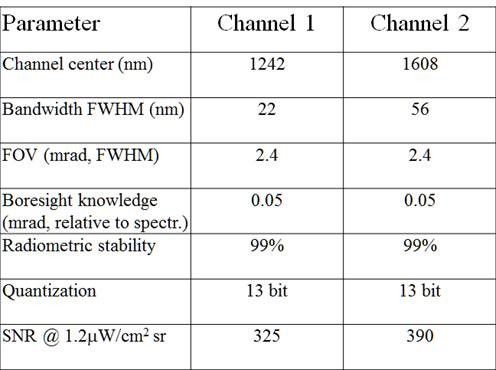
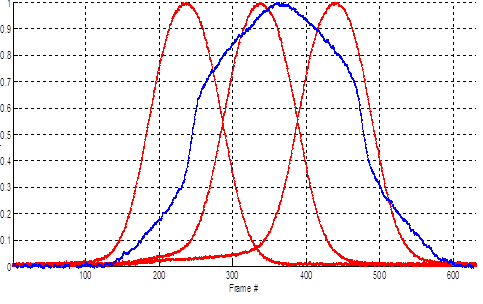
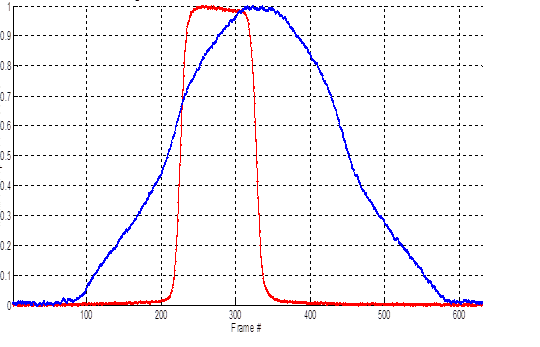
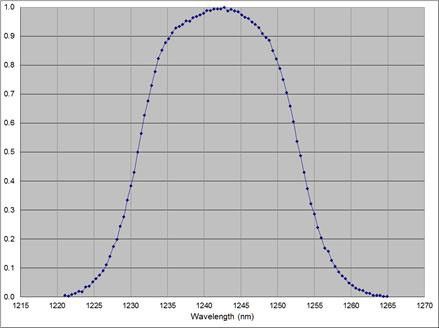
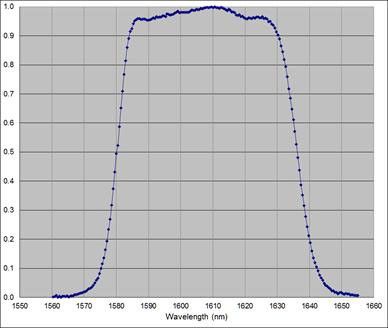
Suggested Searches

SWIR Characteristics

A table presenting the parameters for two channels, Channel 1 and Channel 2, of an instrument. The parameters listed include: Channel center (nm) with values 1242 and 1608 respectively; Bandwidth FWHM (nm) with values 22 and 56; FOV (mrad, FWHM) with values 2.4 for both; Boresight knowledge (mrad, relative to spectr.) with values 0.05 for both; Radiometric stability at 99% for both; Quantization at 13 bit for both; and SNR @ 1.2µW/cm² sr with values 325 and 390 respectively.
A line graph plotting an unlabelled y-axis (ranging from 0 to 1) against "Frame #" (x-axis, ranging from 0 to 600). The graph displays four distinct bell-shaped curves. Three of these curves are red, are narrower, and peak sharply at different frame numbers around 220, 320, and 450. The fourth curve is blue, is broader, and peaks around frame #380, overlapping with two of the red curves. All curves show a response function ranging from 0 to 1.

Cross-track SWIR response and alignment with spectrometer channels 321-323

A line graph plotting an unlabelled y-axis (ranging from 0 to 1) against "Frame #" (x-axis, ranging from 0 to 600). The graph shows two distinct curves. One curve, in red, is a narrow, steep-sided, almost rectangular shape, rising sharply around Frame #200, staying flat at a value near 1, and dropping sharply around Frame #350. The second curve, in blue, is a broader, bell-shaped curve that begins to rise around Frame #100, peaks at a value near 1 around Frame #350-400, and gradually declines to Frame #600, significantly overlapping with the red curve.

Along-track SWIR response and alignment with spectrometer

A line graph plotting an unlabelled y-axis (ranging from 0 to 1) against "Wavelength (nm)" (x-axis, ranging from 1215 to 1270 nm). A single blue curve with dotted markers forms a clear bell shape, peaking at a y-value of 1 around 1242 nm, indicating a bandpass filter's transmission curve. The curve shows a gradual rise from 1220 nm and a similar decline towards 1265 nm.

1240 nm channel spectral response

A line graph plotting an unlabelled y-axis (ranging from 0 to 1) against "Wavelength (nm)" (x-axis, ranging from 1550 to 1660 nm). A single blue curve with dotted markers shows a broad, flattened-top shape, representing a bandpass filter's transmission curve. The curve rises sharply around 1575 nm, remains near a y-value of 1 between approximately 1590 nm and 1625 nm, and then drops sharply towards 1650 nm.

1610 nm channel spectral response

Keep Exploring

Discover More Topics From NASA