


TOPEX / Poseidon Stories
NASA Analysis Shows La Niña Limited Sea Level Rise in 2025
4 min read
A mild La Niña caused greater rainfall over the Amazon basin, which offset rising sea levels due to record warming of Earth’s oceans. The rise in the global mean sea level slowed in 2025 relative to the year before, an…
Article
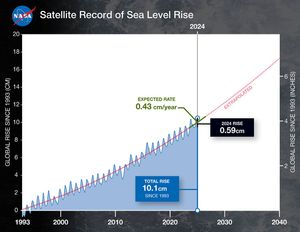
Satellite Record of Sea Level Rise From 1993 to 2024
2 min read
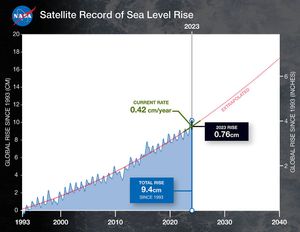
This graph shows global mean sea level (in blue) since 1993 as measured by a series of five satellites. The solid red line indicates the trajectory of this increase. The dotted red line projects future sea level rise.
Article
2023 Sea Level Rise Update
1 min read
This graph shows global mean sea level (in blue) since 1993. The solid red line indicates the trajectory of this increase, which more than doubled over the past three decades. The dotted red line projects future sea level rise.
Article