


Spectroscopy 101 – Types of Spectra and Spectroscopy
What can we learn from different types of spectra?
The basic premise of spectroscopy is that different materials emit and interact with different wavelengths (colors) of light in different ways, depending on properties like temperature and composition. We can therefore use spectra—the detailed patterns of colors—to figure out things like exactly how hot something is and exactly what elements and compounds it is made of, without ever sampling it directly.
Visualizing Spectra

The first step in spectroscopy is separating light into its component colors to make a spectrum. You can do this using a glass prism, a device called a diffraction grating, or a combination of the two, known as a grism. (Rainbows are spectra that appear naturally when sunlight passes through water droplets, which act like prisms.) Spectroscopes and spectrographs are scientific tools designed specifically for capturing and measuring spectra.
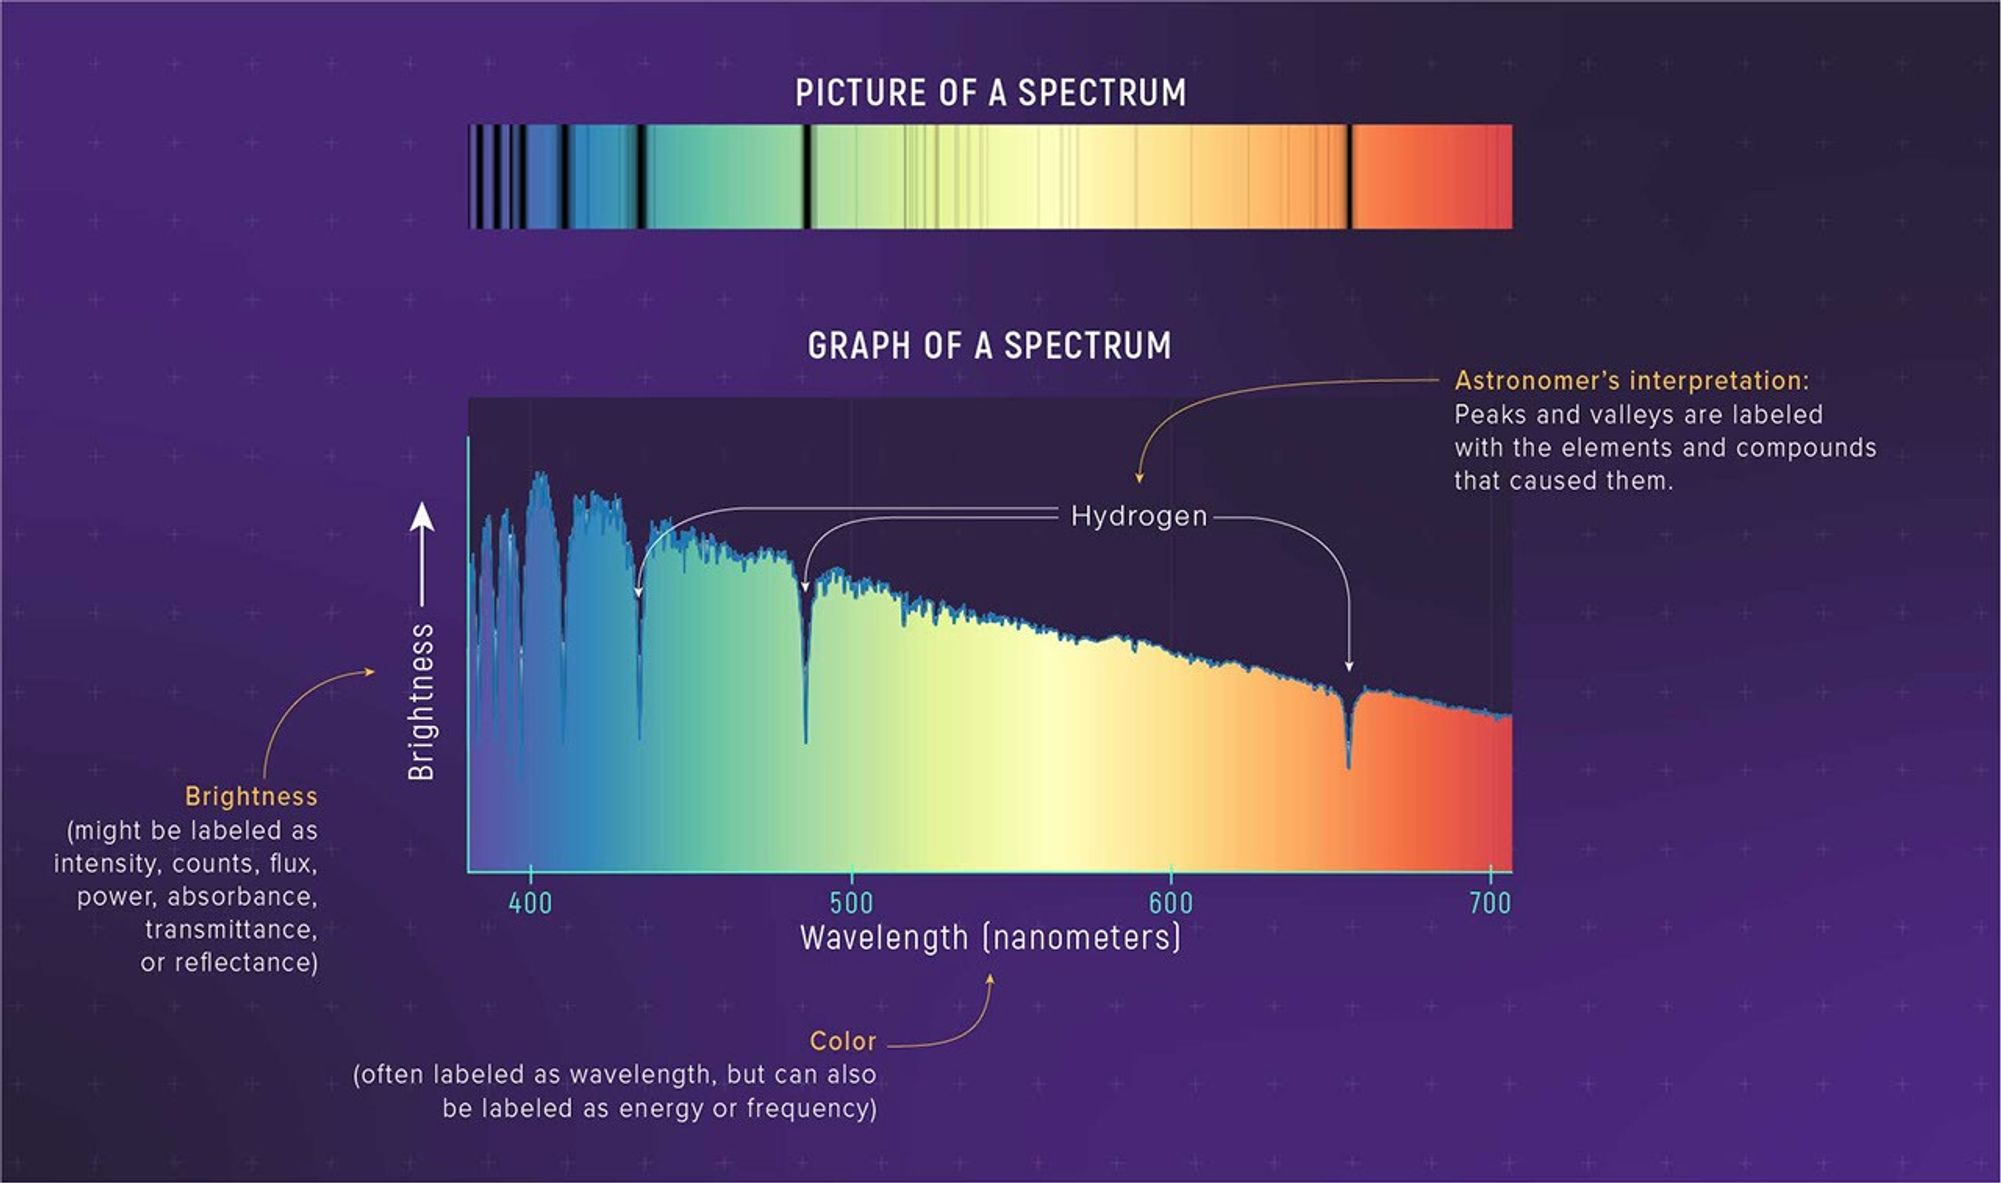
A spectrum can be displayed as an image. However, in order to study a spectrum in detail—to really see the subtle differences in brightness of different colors—it needs to be plotted on a graph. A graph of a spectrum can reveal differences in brightness and wavelength that are too subtle for human eyes to detect.
The basic premise of spectroscopy is that different materials emit and interact with different wavelengths (colors) of light in different ways, depending on properties like temperature and composition.
Types of Spectra
All spectra show basically the same thing: how brightness varies with wavelength. Scientists often classify spectra based on the key light-matter interactions they represent and how they are used.
All spectra show basically the same thing: how brightness varies with wavelength. Scientists often classify spectra based on the key light-matter interactions they represent and how they are used.
Continuous Spectra
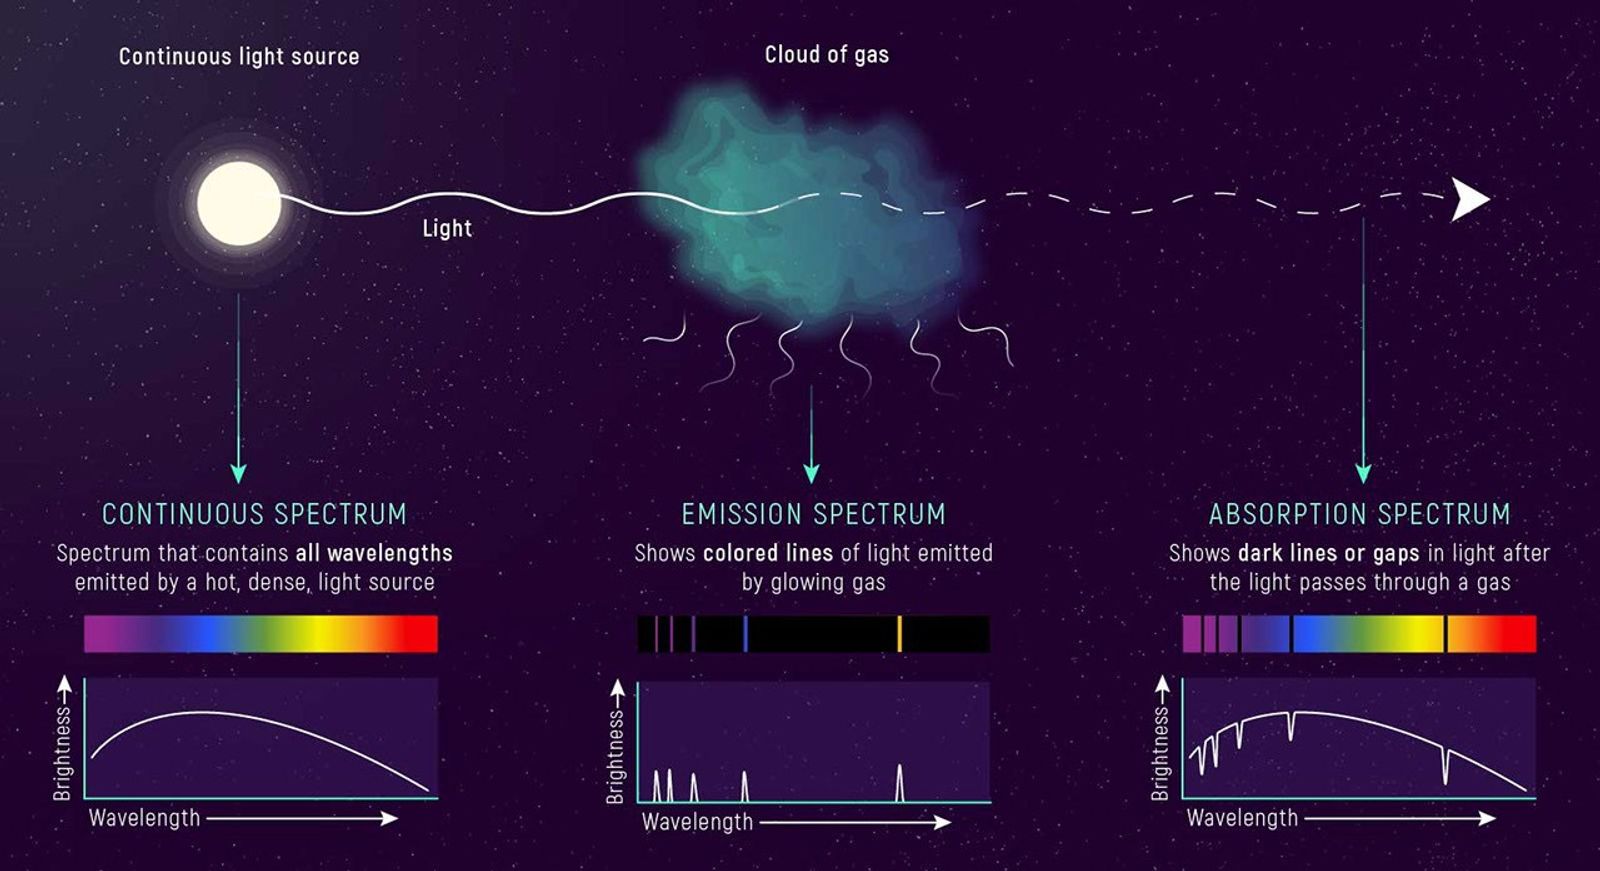
The first type of spectrum to consider is the continuous spectrum. A continuous spectrum is, as you might guess, continuous. The brightness varies fairly evenly from color to color, and in an ideal continuous spectrum, there are no missing colors.
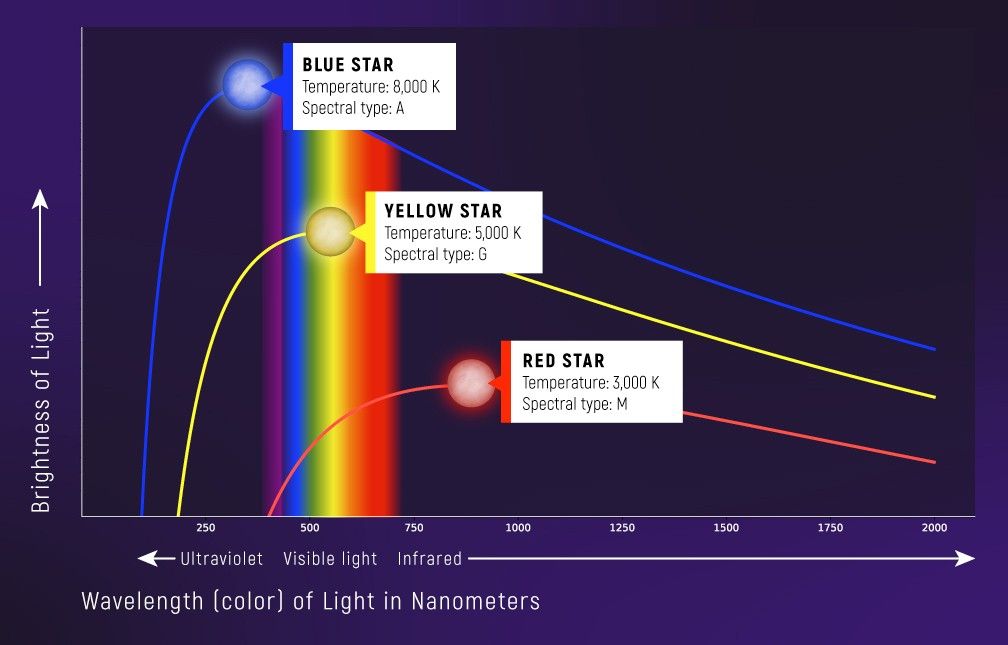
A blackbody curve is one type of continuous spectrum. This is the band of colors that an object like a star, planet, or light bulb filament emits based simply on its surface temperature.
Blackbody spectra are useful because the shape of the curve and the peak wavelength (i.e., the brightest color) are directly related to surface temperature and nothing else. Hot stars emit more blue than red light, and therefore appear bluer in the night sky. Cool stars emit more red than blue light, and appear redder.
The continuous spectrum is also useful to understand because it can be the starting point for other types of spectra.
The continuous spectrum can be the starting point for other types of spectra.
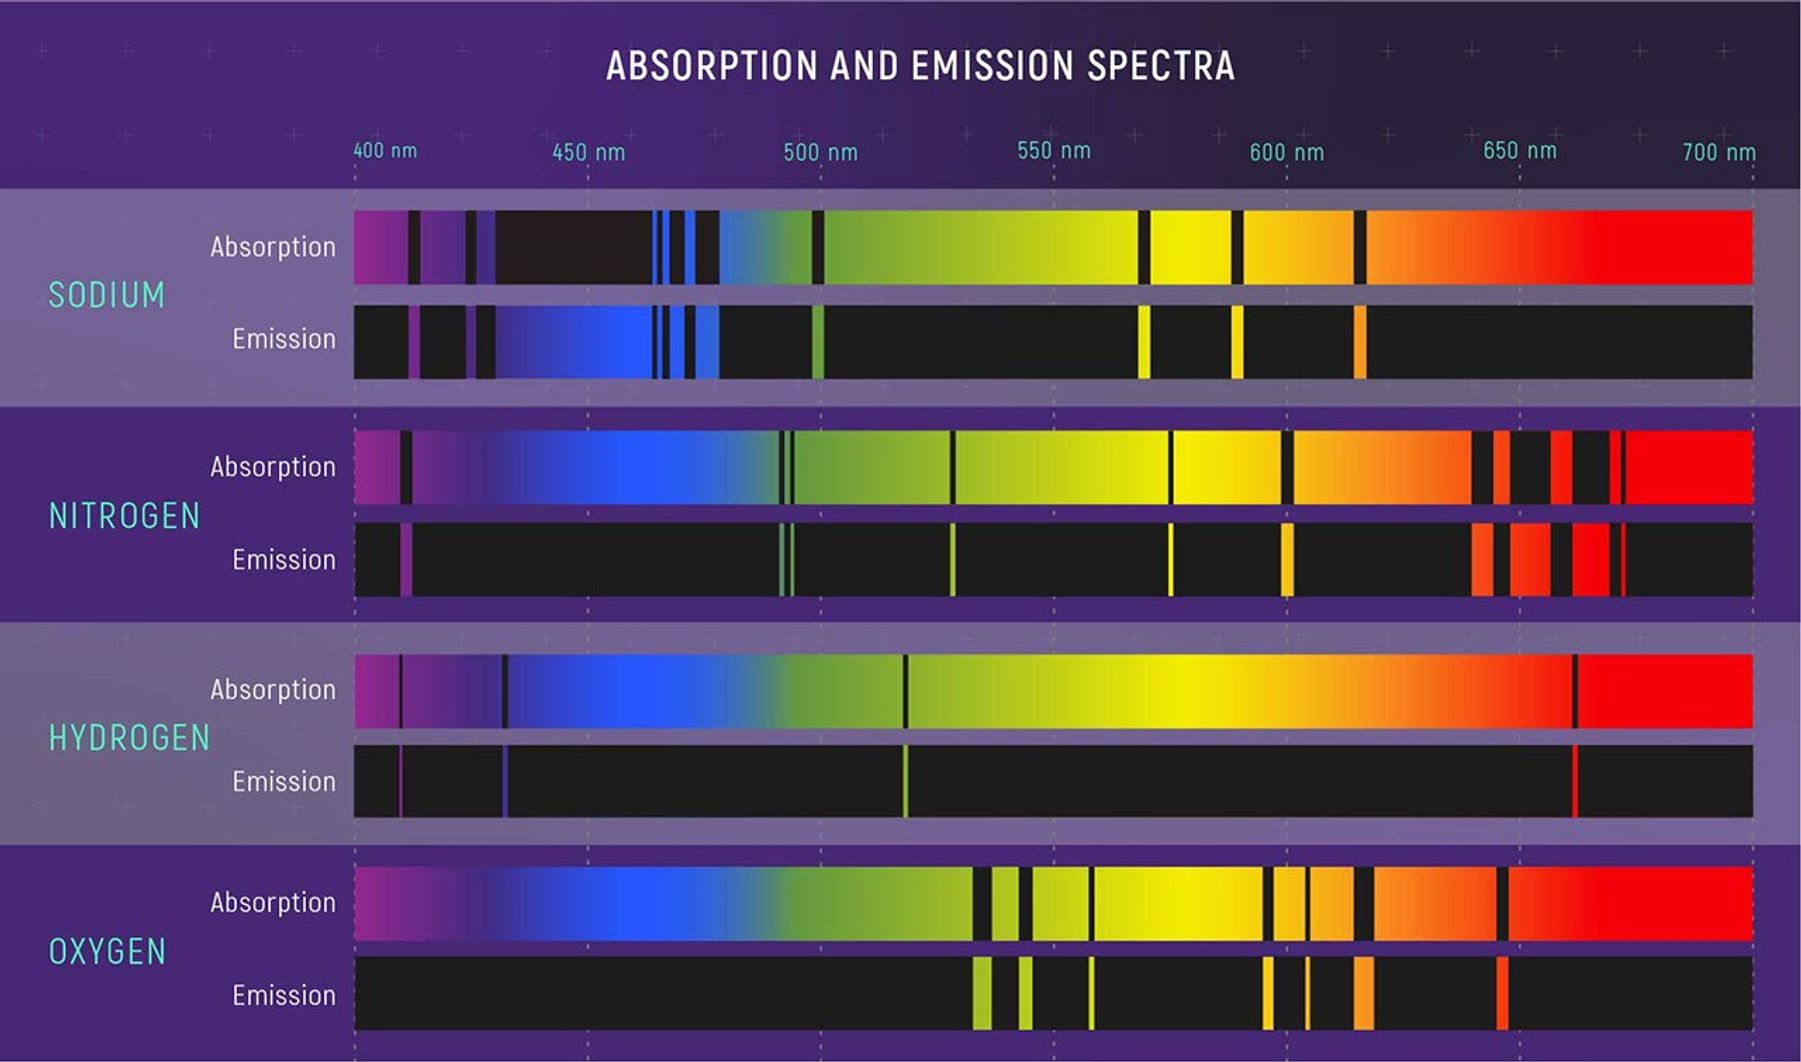
Absorption Spectra
An absorption spectrum looks like a continuous spectrum, but with some colors significantly dimmer than others, or nearly missing. These missing colors appear as black lines known as absorption lines. As you might have guessed, absorption lines are caused by absorption: When starlight passes through a material—say a dense gas—atoms and molecules in the gas absorb some wavelengths.
What is really interesting and very useful is that each element in the gas absorbs a very specific pattern of wavelengths. If you recognize the “signature” of that element or compound, you know it exists in the gas. The relative strengths of the absorption lines (how dark they are) gives you an idea of the different amounts of each material and the temperature and density of the gas. (Why does each element have a specific signature? It has to do with those electrons moving between energy levels, which we explain more in a bit.)
What is really interesting and very useful is that each element in the gas absorbs a very specific pattern of wavelengths. If you recognize the “signature” of that element or compound, you know it exists in the gas. The relative strengths of the absorption lines (how dark they are) gives you an idea of the different amounts of each material and the temperature and density of the gas. (Why does each element have a specific signature? It has to do with those electrons moving between energy levels, which we explain more in a bit.)
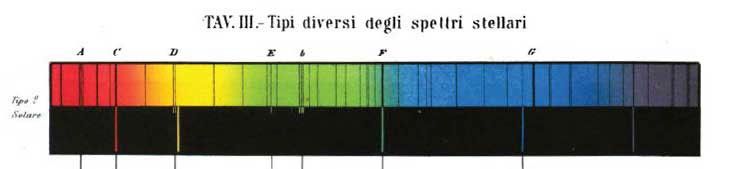
The Solar Spectrum
Remember when we said that stars emit a continuous spectrum? Well, that’s not precisely true. If you look very carefully at the spectrum of the Sun, you will see that it has a lot of absorption lines, all of which correspond to elements in the Sun. Some wavelengths of light generated by the Sun get absorbed by atoms in cooler layers of the Sun as they travel out toward space. We know what the Sun is made of because of its absorption spectrum. (In fact, the second-most common element in the universe—helium—was discovered not on Earth, but as a mysterious set of absorption lines in the Sun.)
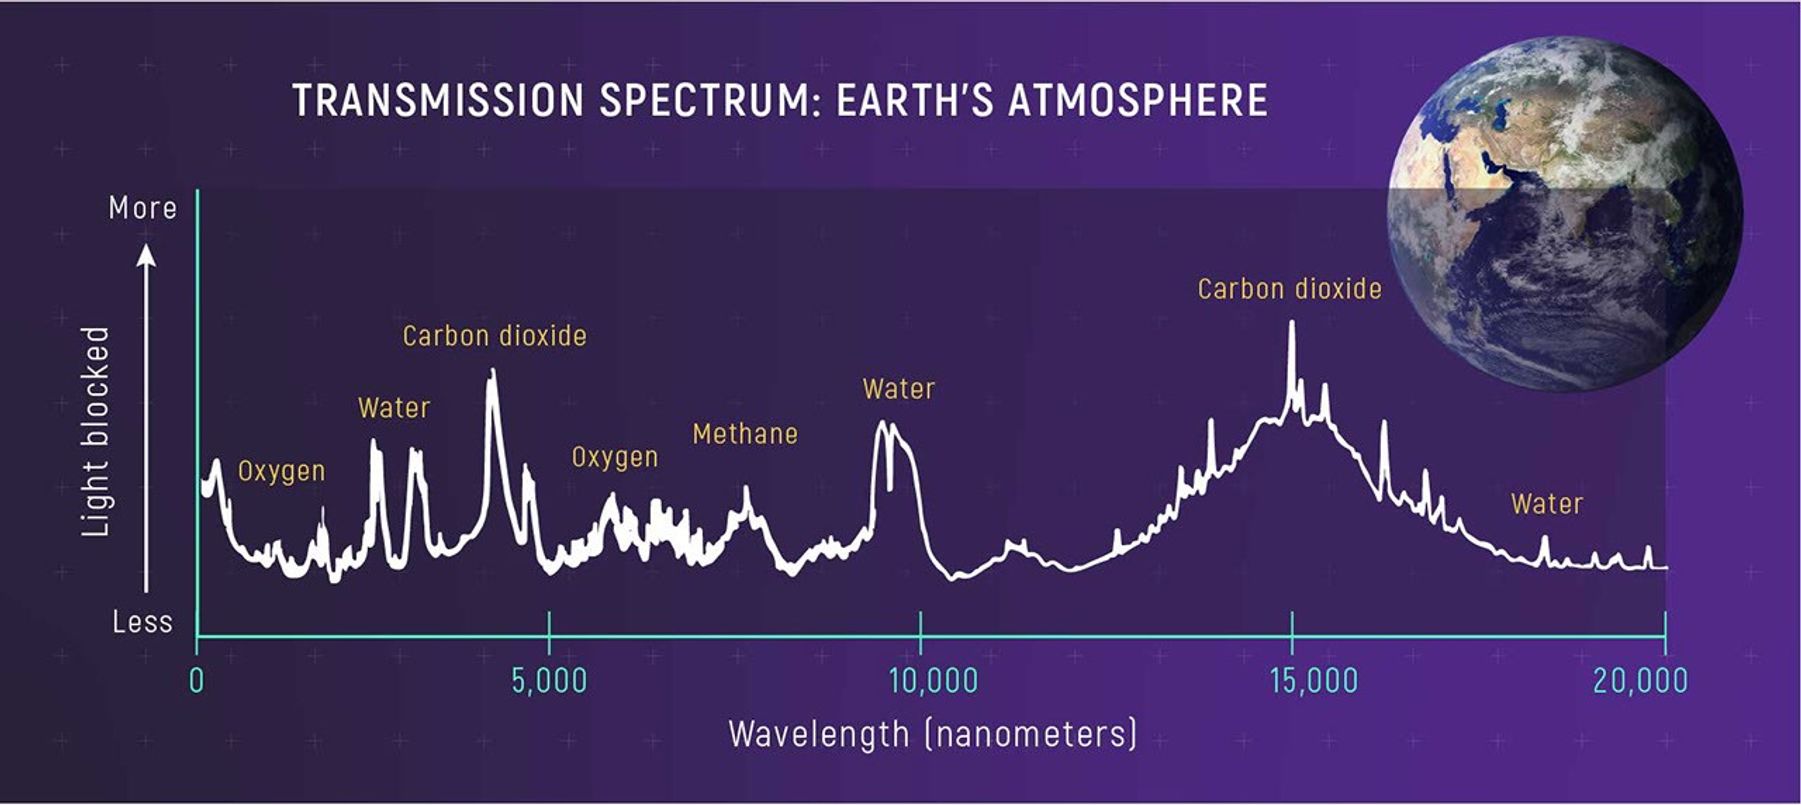
Transmission Spectra
A transmission spectrum is a type of absorption spectrum. When starlight passes through the atmosphere of a planet, for example, some of the light is absorbed by the atmosphere and some is transmitted through it. The dark lines and dim bands of light in a transmission spectrum correspond to atoms and molecules in the planet’s atmosphere. The amount of light that is transmitted also depends on how dense the atmosphere is and how warm it is.
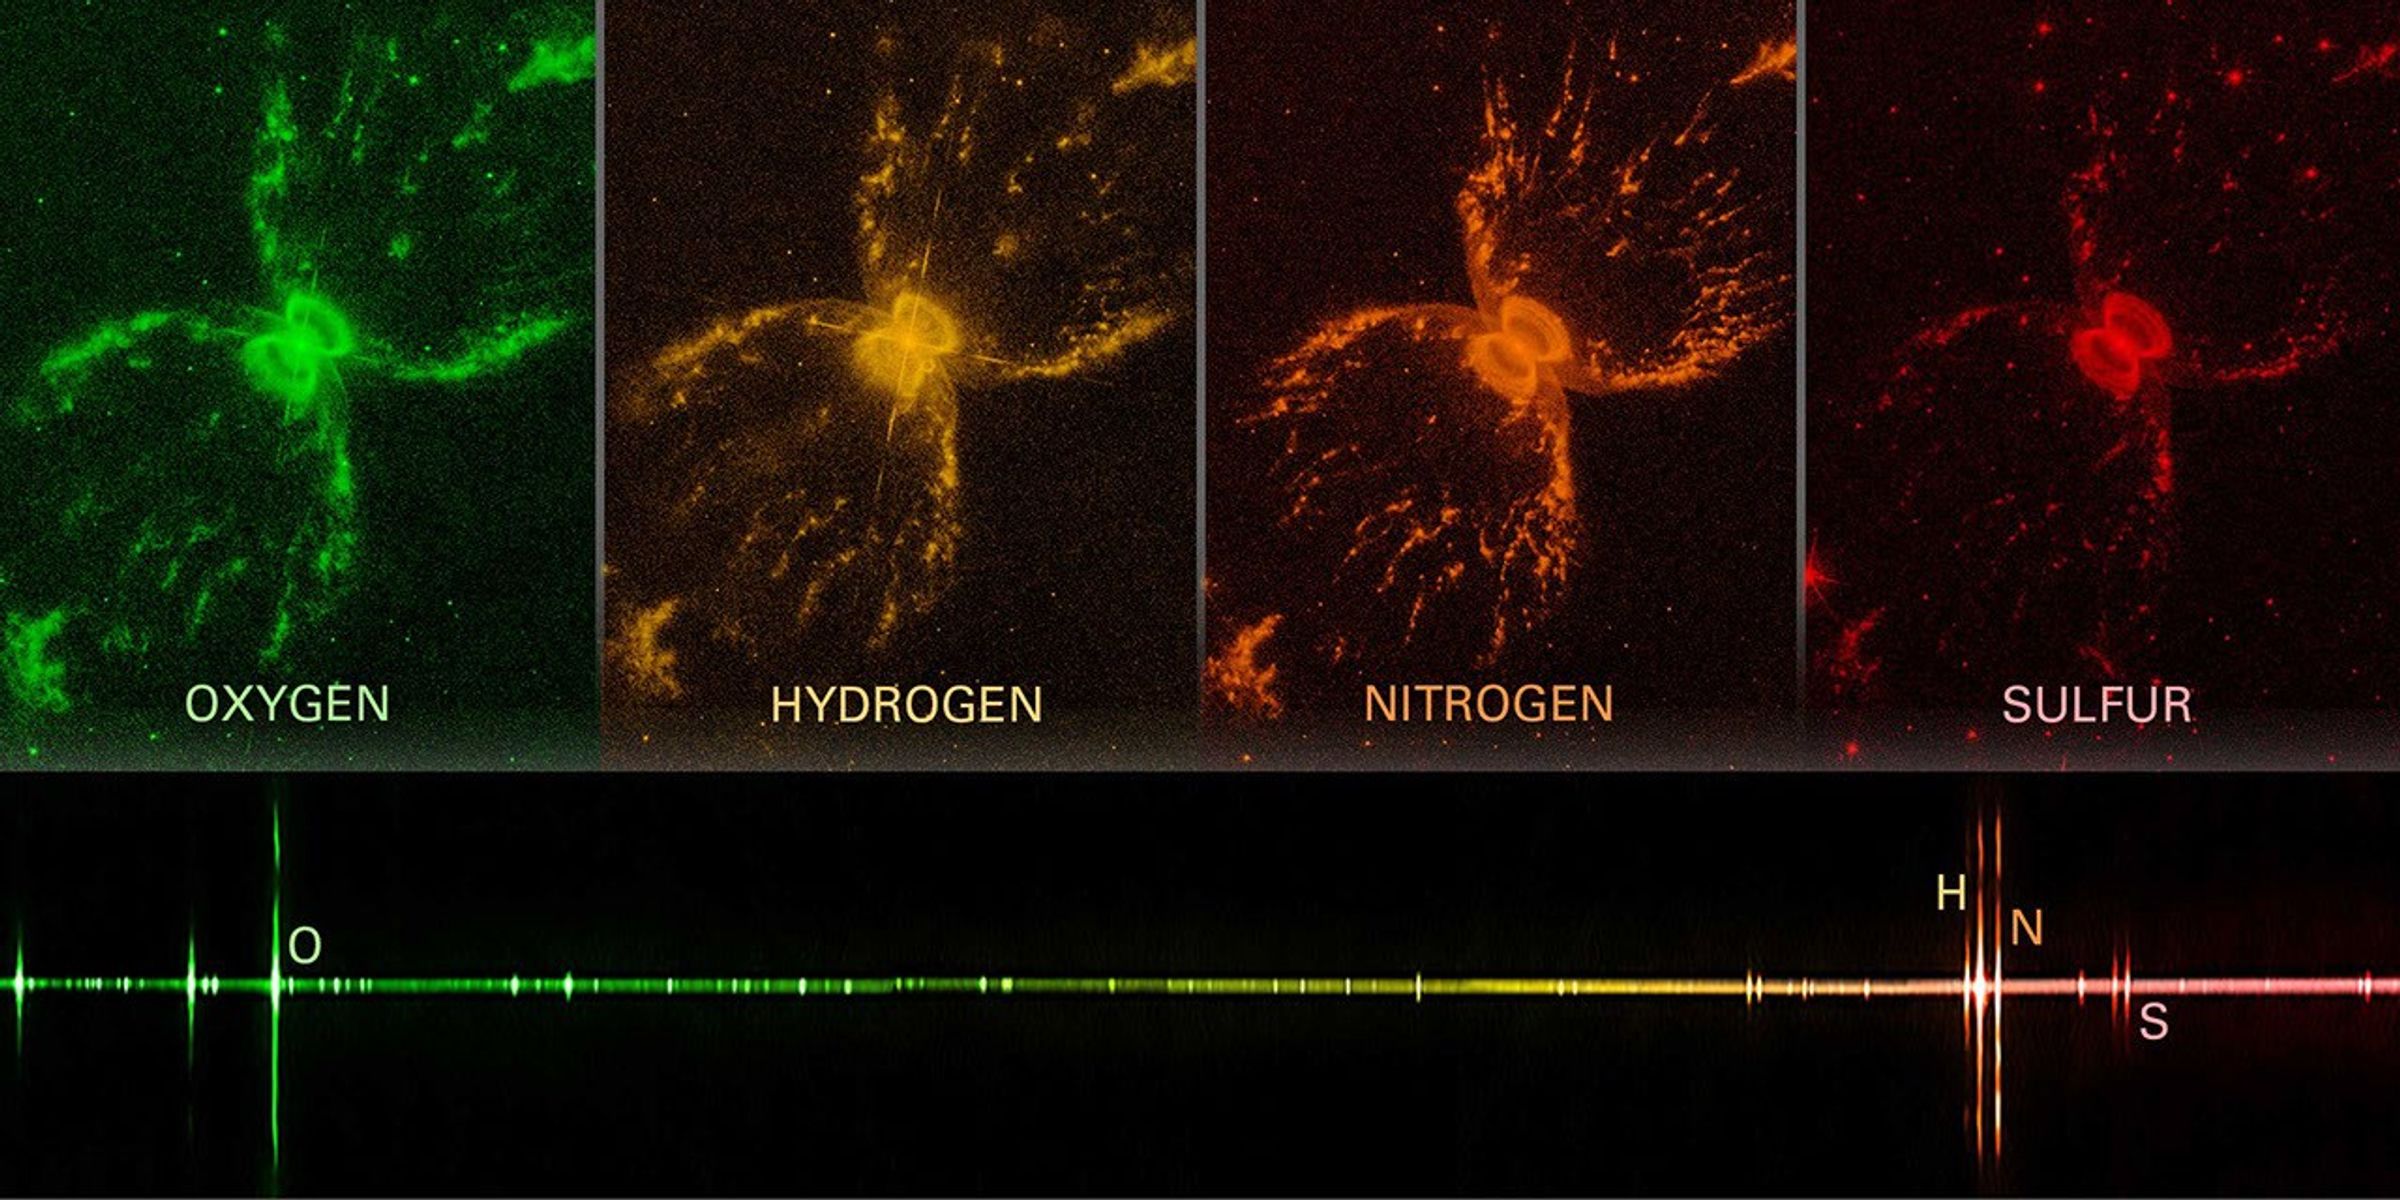
Emission Spectra
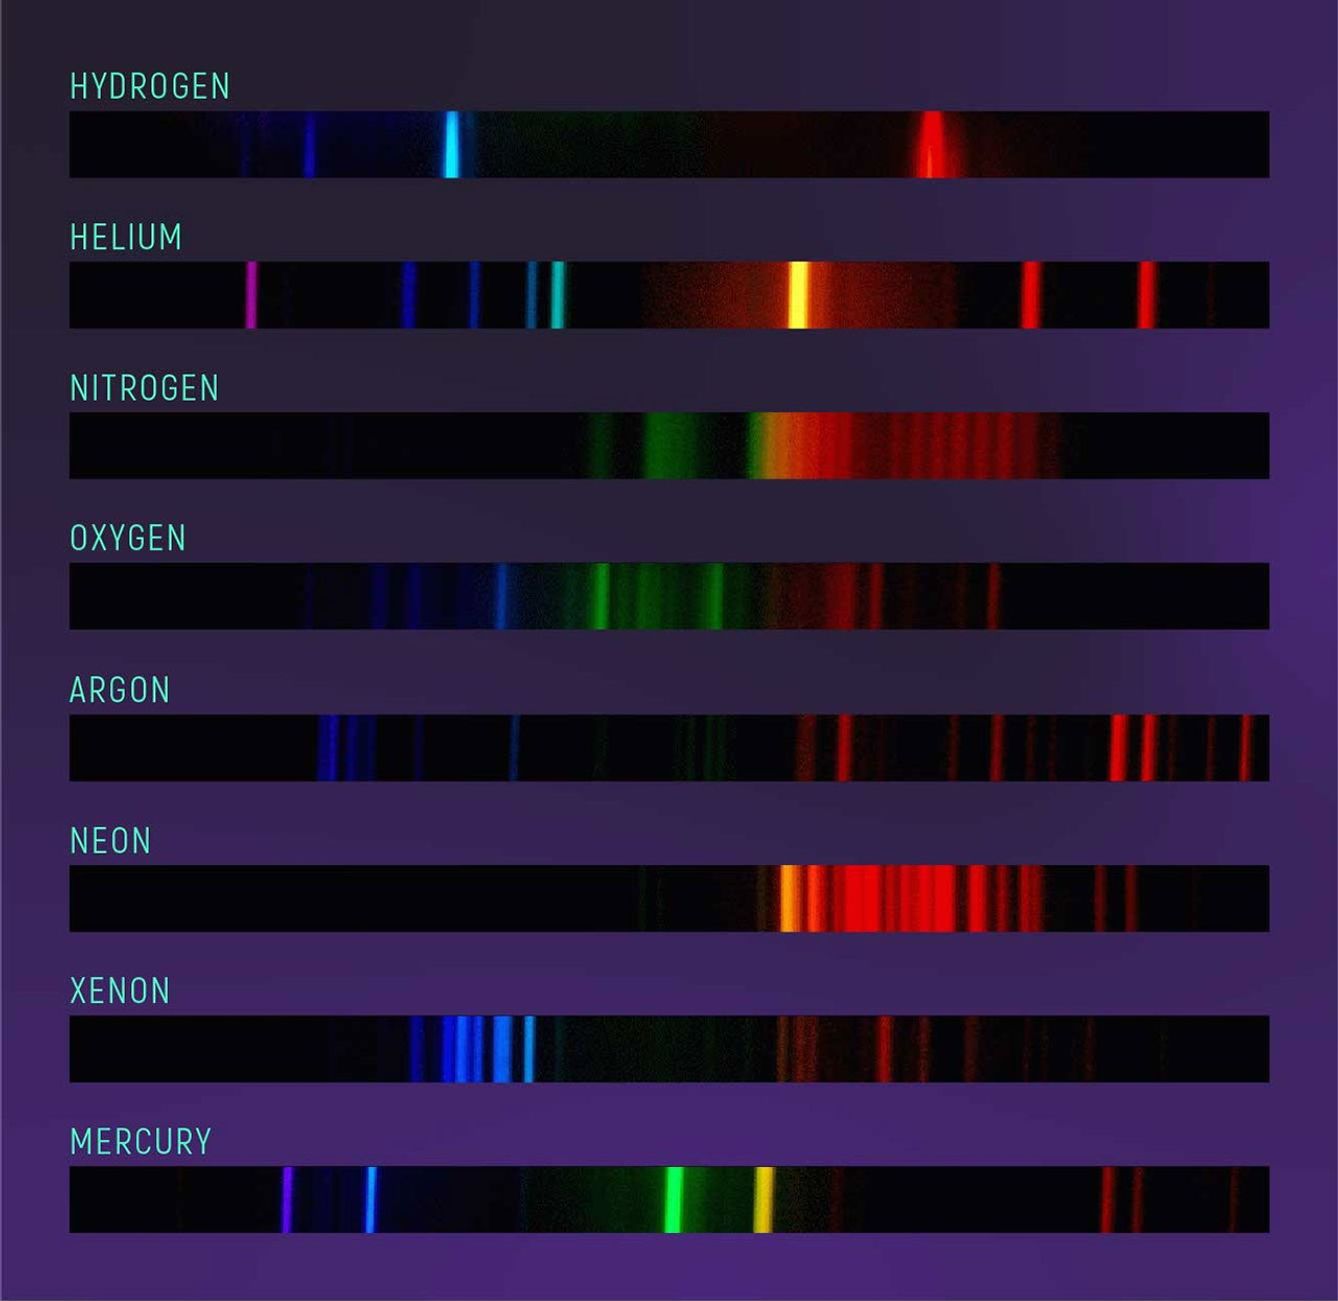
The pattern of an emission spectrum is the inverse of an absorption spectrum. An emission spectrum is mostly dark with bright lines of color known as emission lines. Emission lines also correspond to specific atoms. Each atom has a specific pattern of colors that it emits. In fact, the wavelengths of an atom’s emission lines are exactly the same as the wavelengths of its absorption lines. (We’ll get to why this is in the next section.)
Emission spectra are particularly useful for studying clouds of hot gas. The difference in brightness of different emission lines can tell you something about the temperature and density of the gas and the relative amounts of different elements in the gas.
Reflectance Spectra
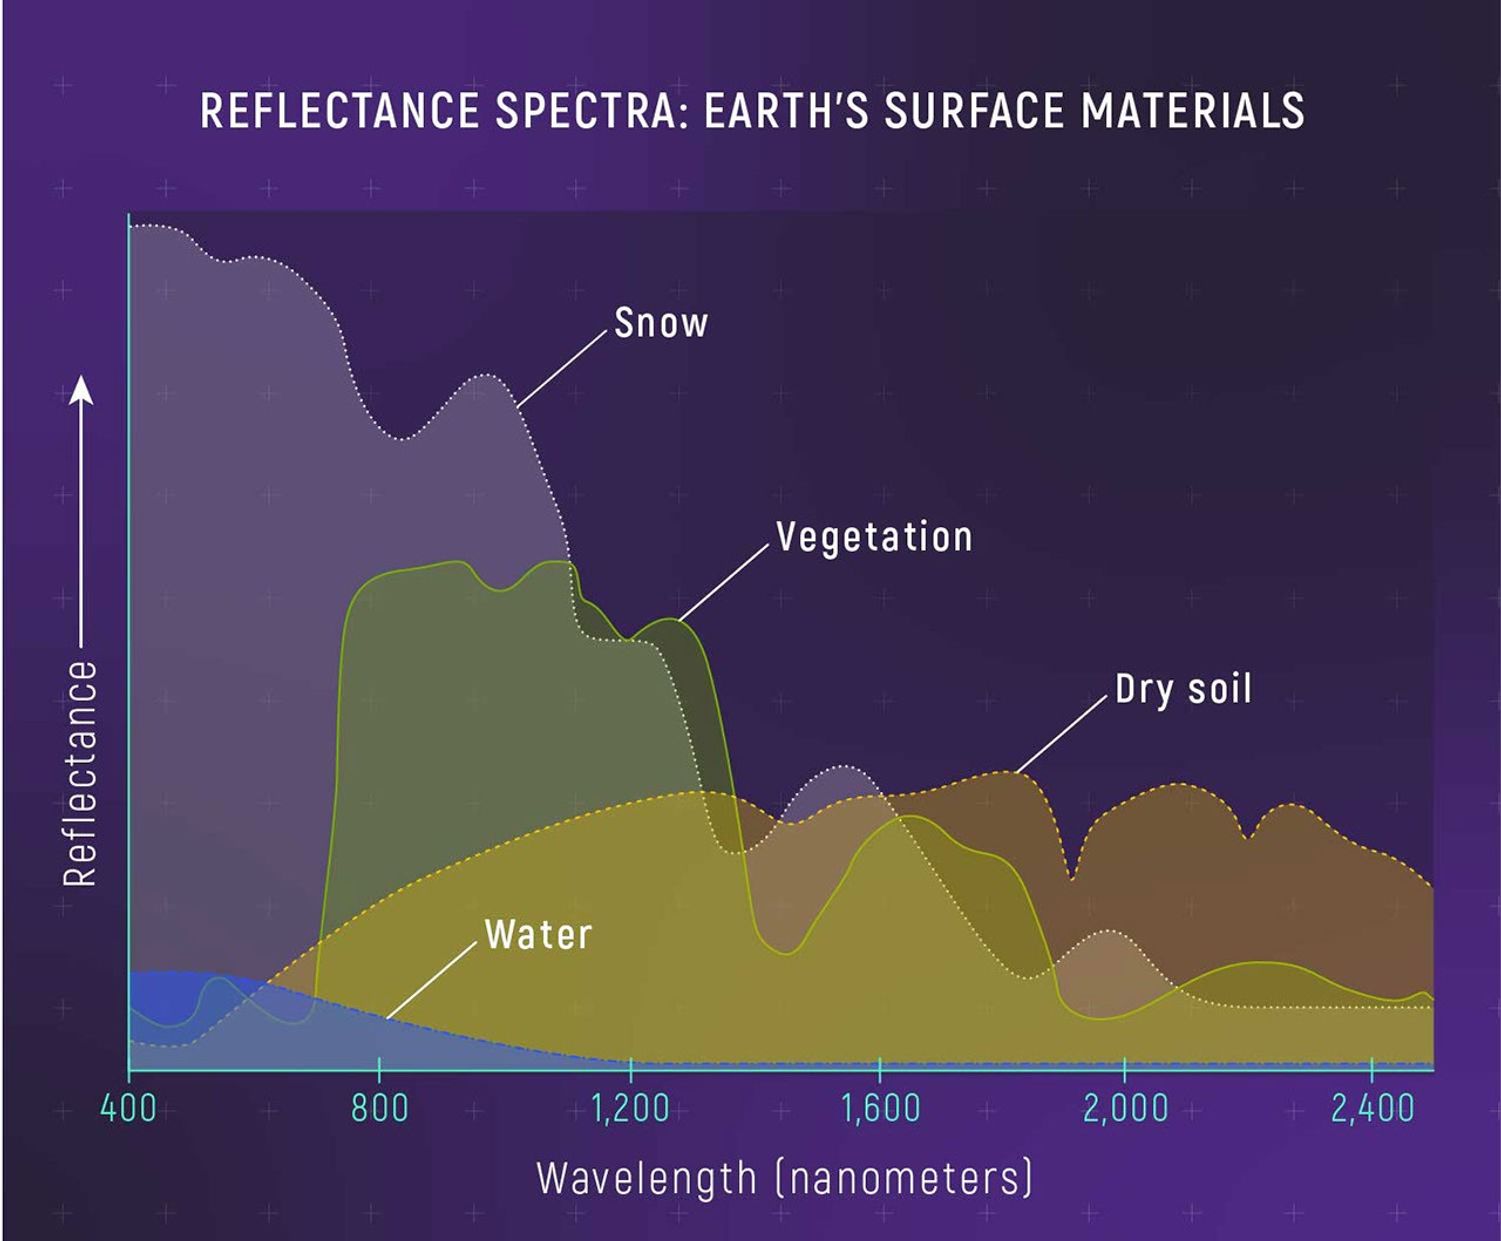
A reflectance spectrum shows the colors that reflect off a surface. Earth scientists use reflectance spectroscopy to study rocks, soil, ocean water, ice caps, mineral deposits, forests, farmland, dust storms, volcanic eruptions, and even wildlife. Planetary scientists use reflectance spectra to figure out what the surfaces of planets, moons, asteroids, and comets are made of. The pattern of colors that a material reflects depends on not only what colors it is absorbing and transmitting, but also many other factors, like roughness, shape, and orientation. Reflectance spectra are typically a lot more complicated than emission and absorption spectra, and can be quite difficult to interpret.
Naked-Eye “Spectroscopy”

Spectroscopy may seem remote from everyday experience, but in fact, human color vision—the ability to recognize materials and make inferences about things based on color—involves a basic form of spectroscopy.
It’s possible to tell the difference between soil, grass, and snow from a distance because they reflect different colors. Whole milk looks thicker and “milkier” than skim milk because of differences in the way they absorb and transmit light. Many people can tell the difference between fluorescent lights, incandescent lights, and natural sunlight based on subtle differences in the “quality” (i.e., color) of the light they emit.
Most people rely on the basic principle of spectroscopy—that color carries information—every day without even knowing it.
The basic difference between color vision and spectroscopy is the level of detail that we can make out. Tools like spectroscopes and spectrographs allow us not only to separate, but also to precisely measure the brightness and wavelengths of hundreds to thousands of individual colors that combine to give us the overall color.
Need a refresher? Check out previous articles.
Know what you’re looking for?
Jump ahead in the series!