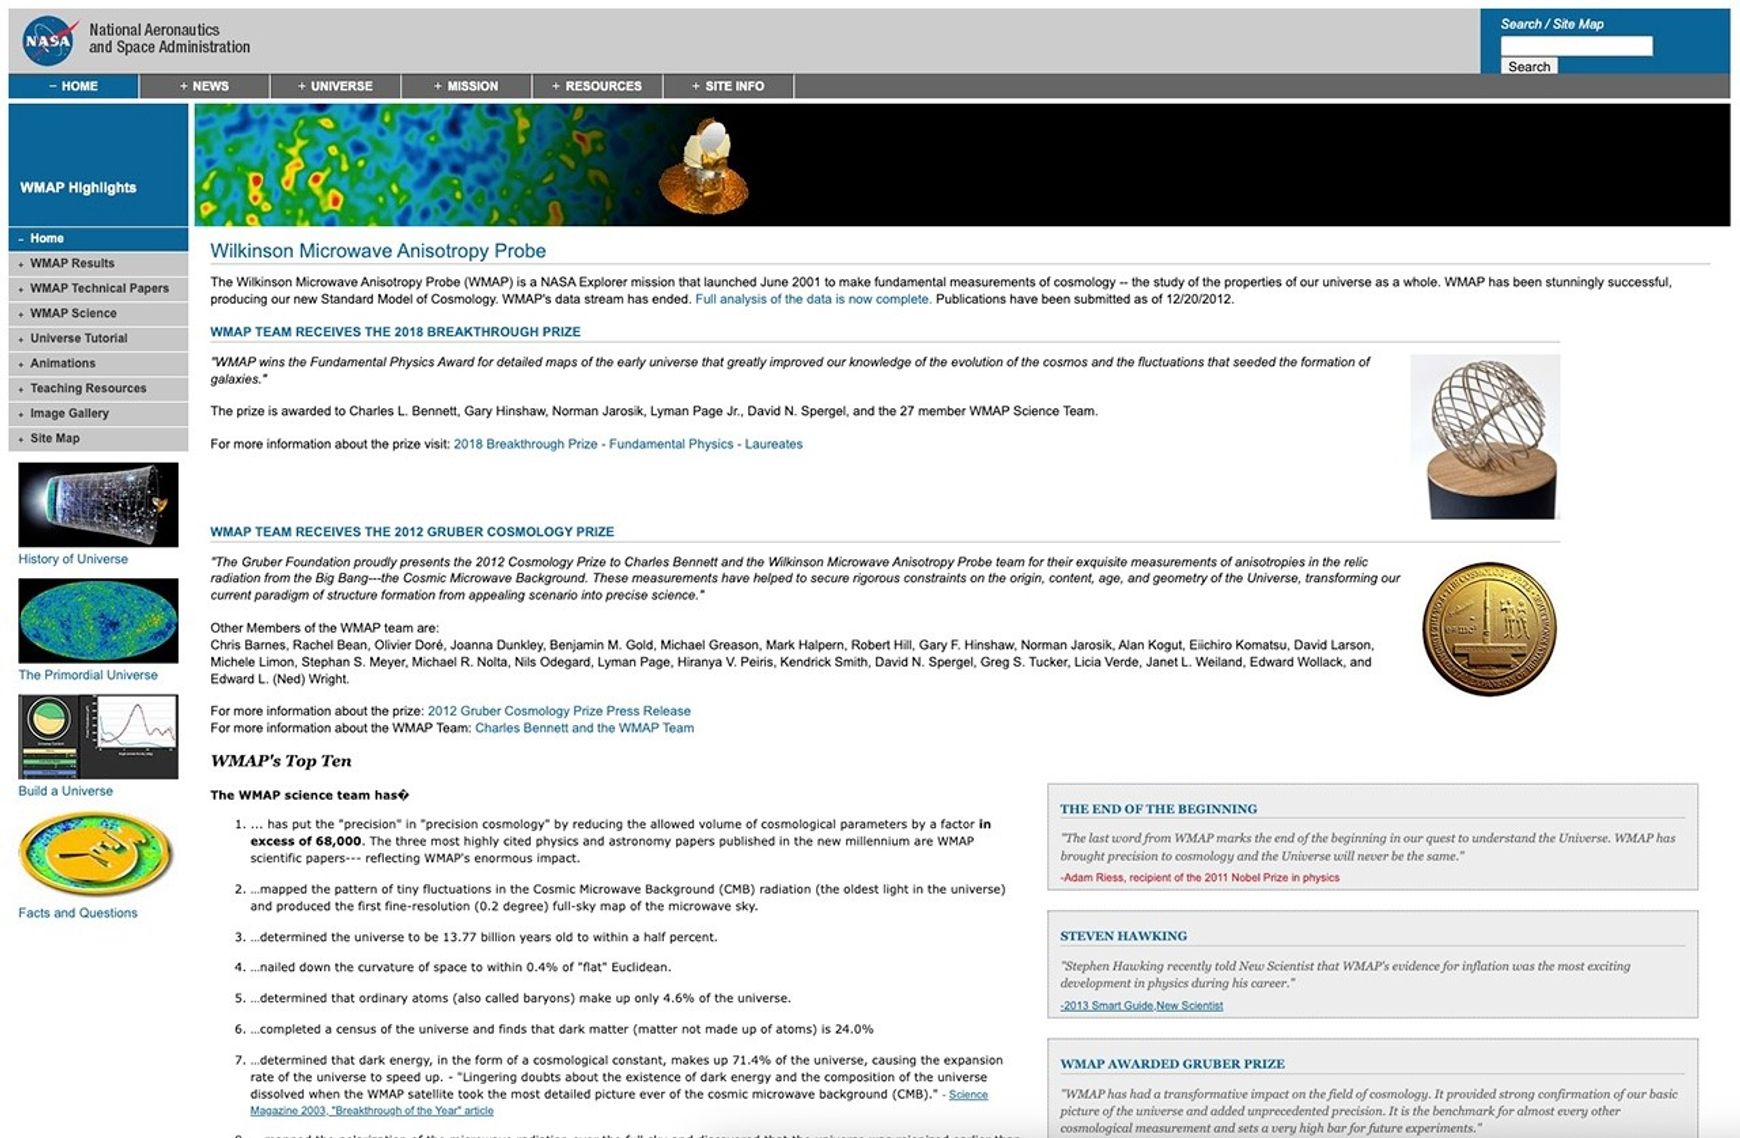


WMAP
Image Credit: NASA / WMAP Science Team
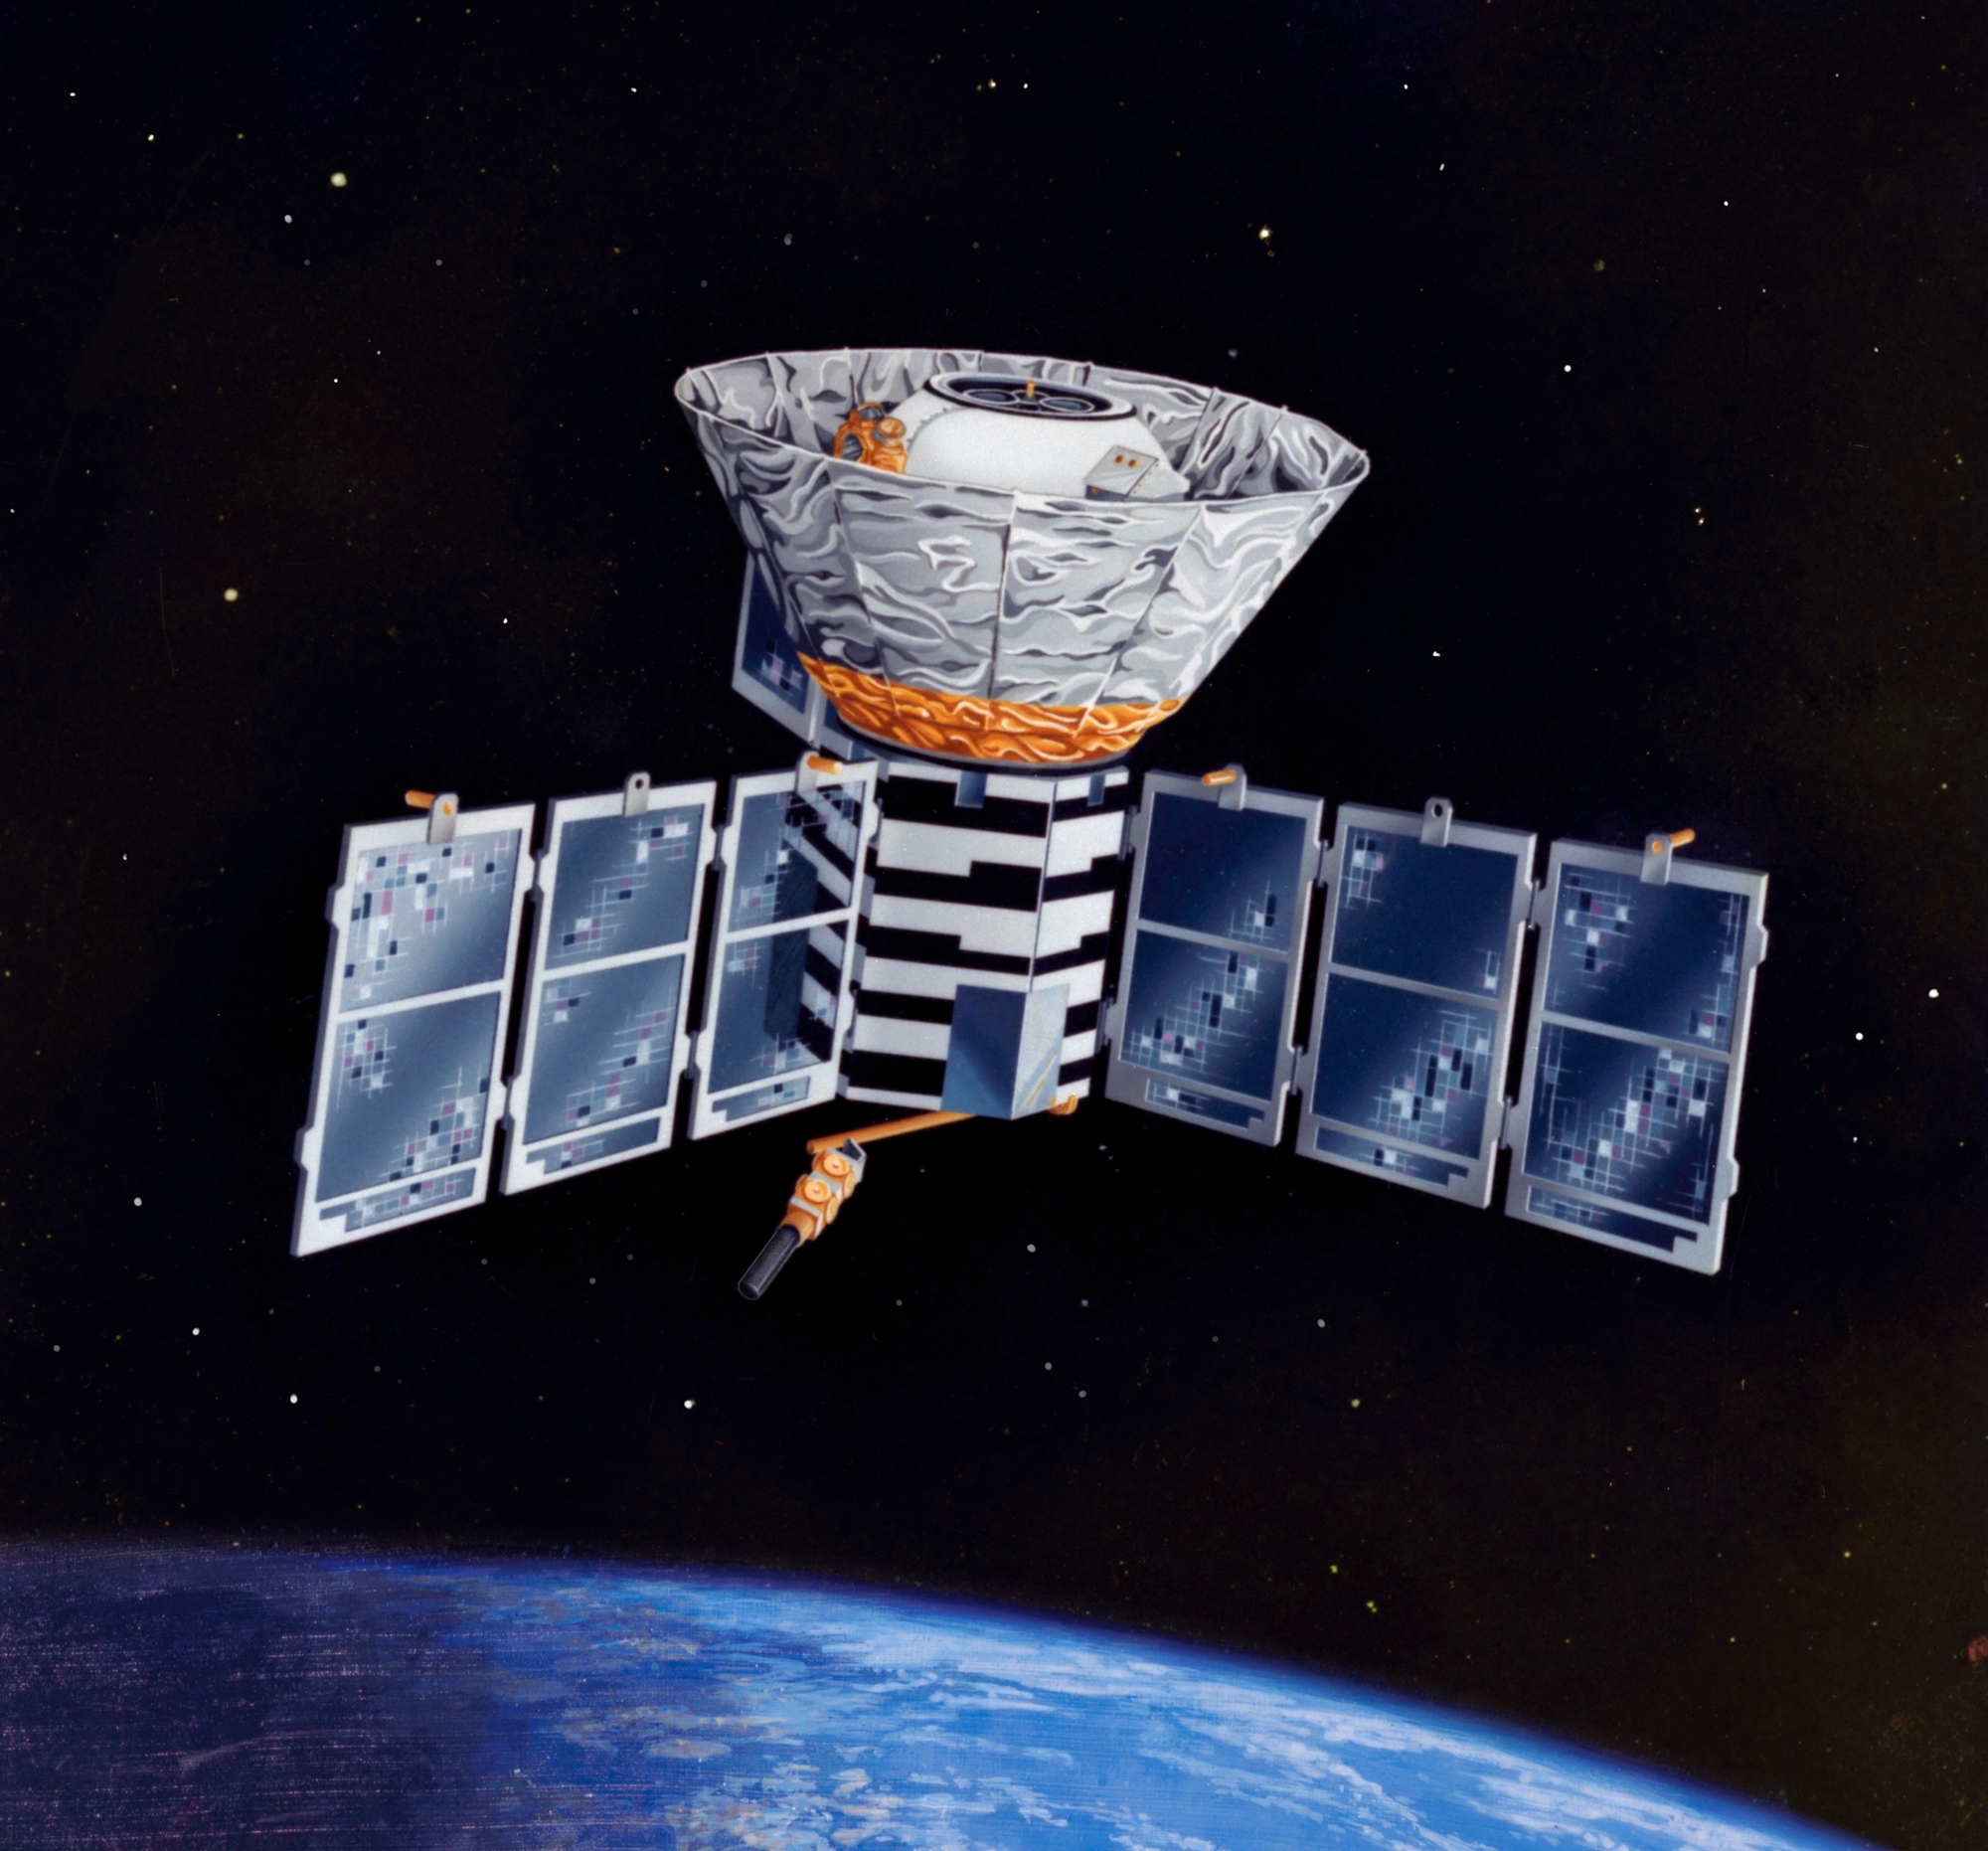
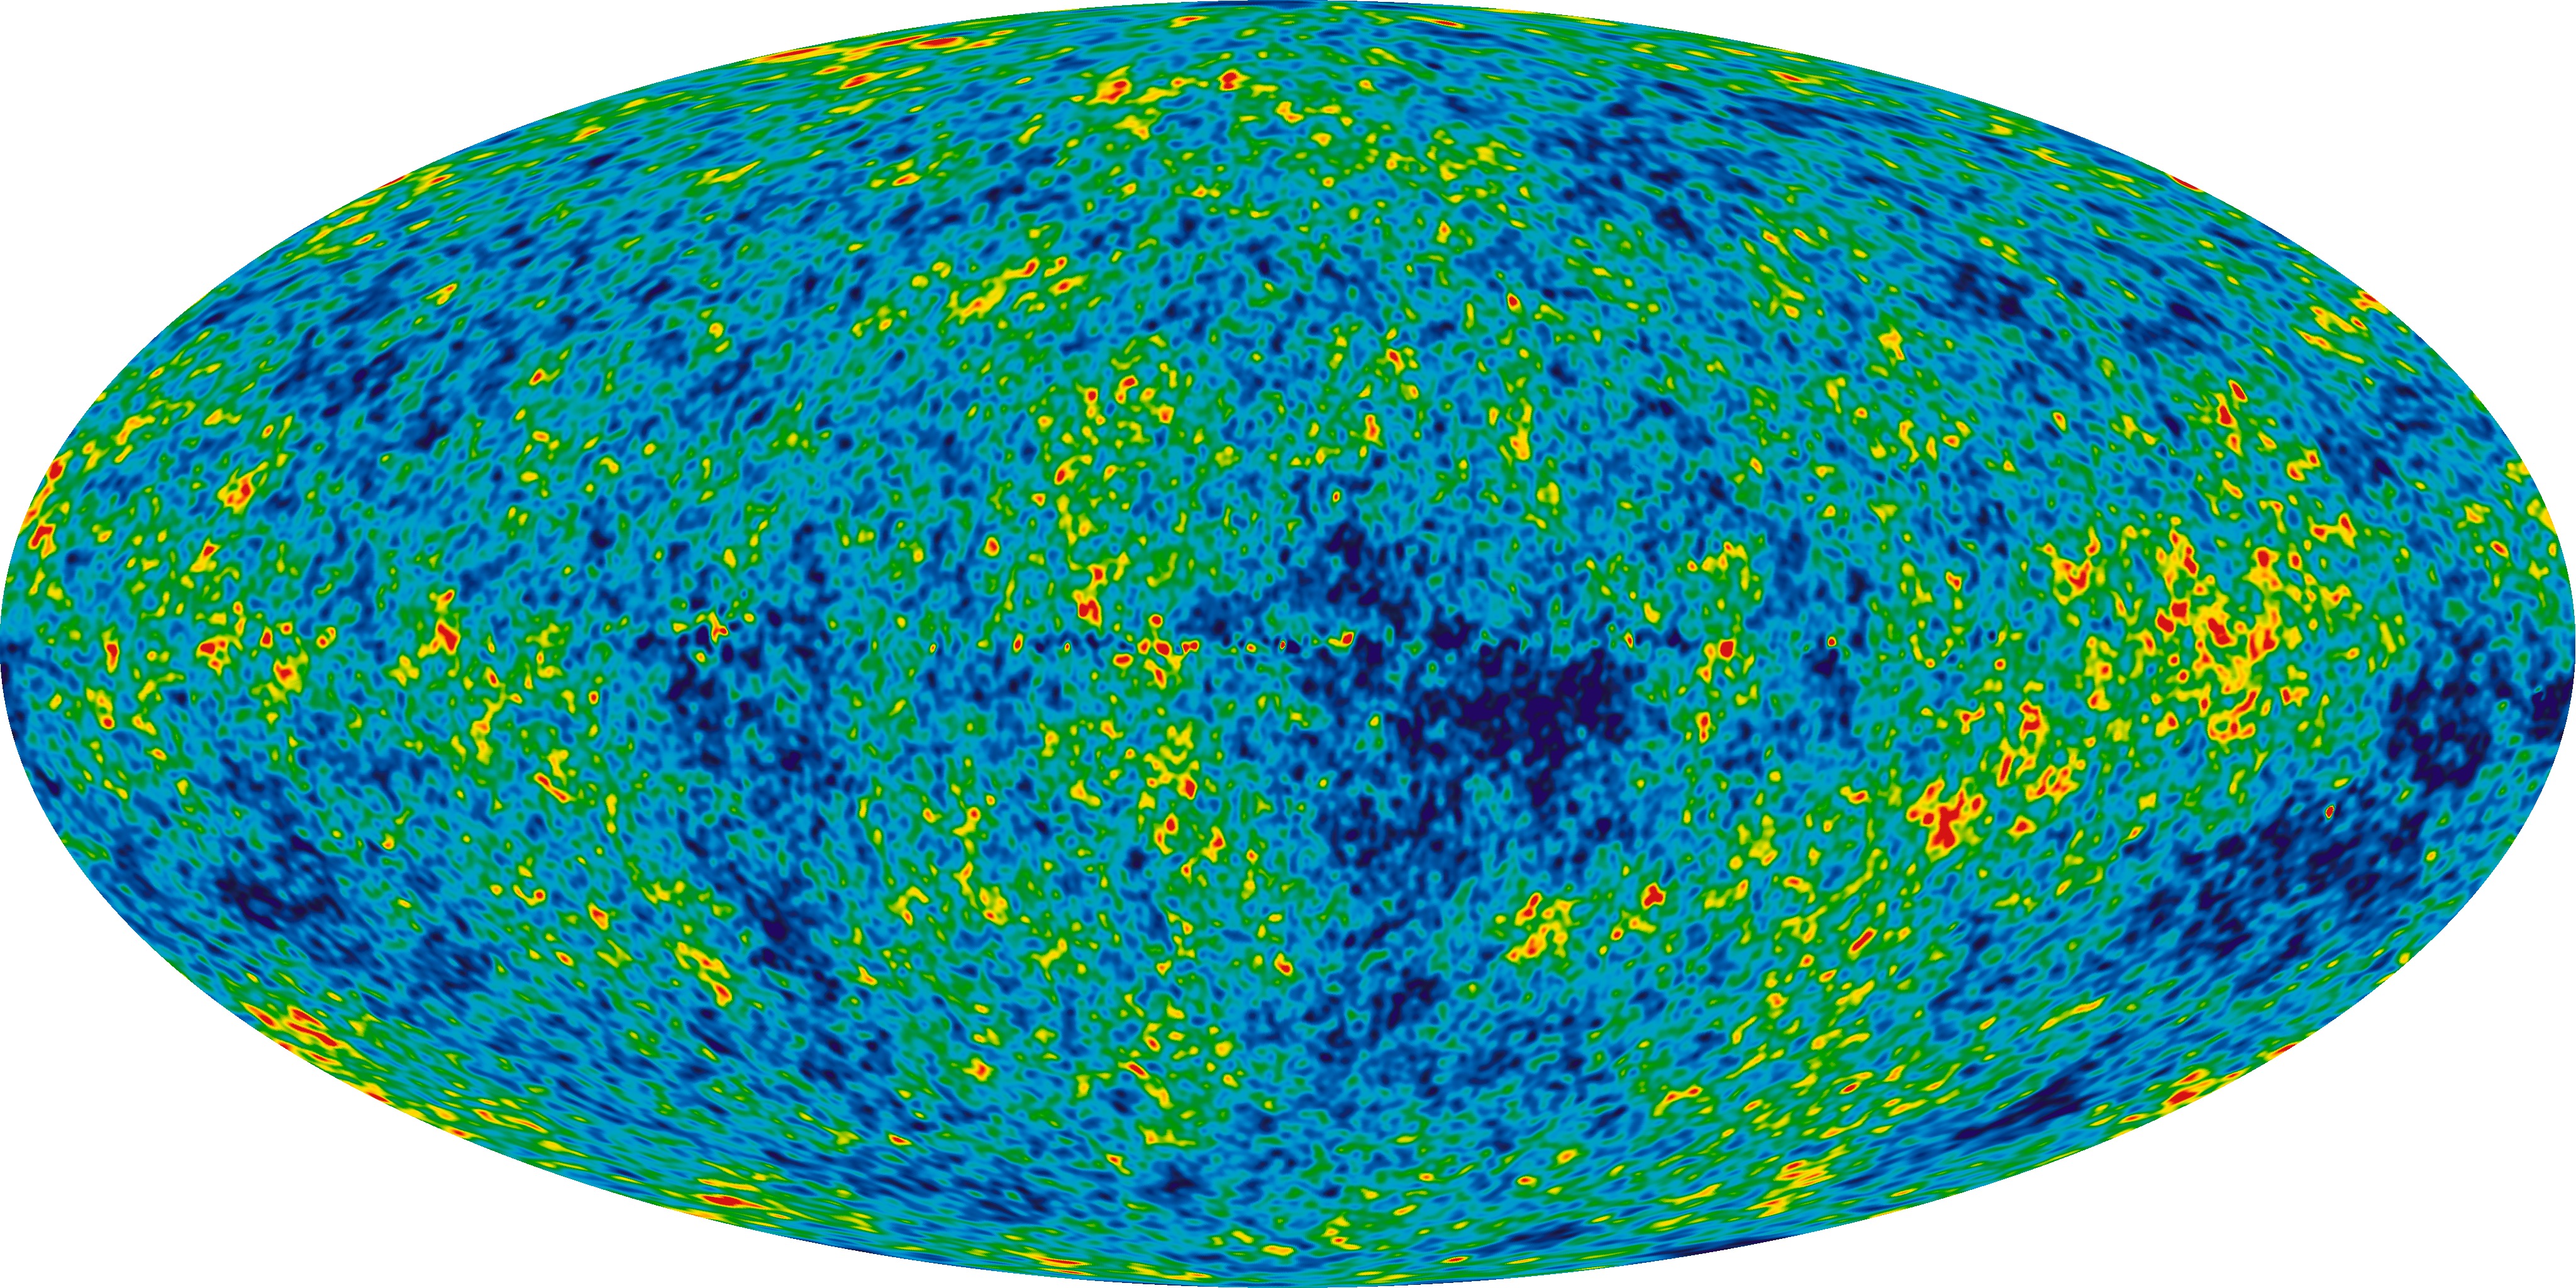
NASA's WMAP (Wilkinson Microwave Anisotropy Probe) observatory revealed conditions as they existed in the early universe by measuring the properties of the cosmic microwave background radiation over the full sky.
Science
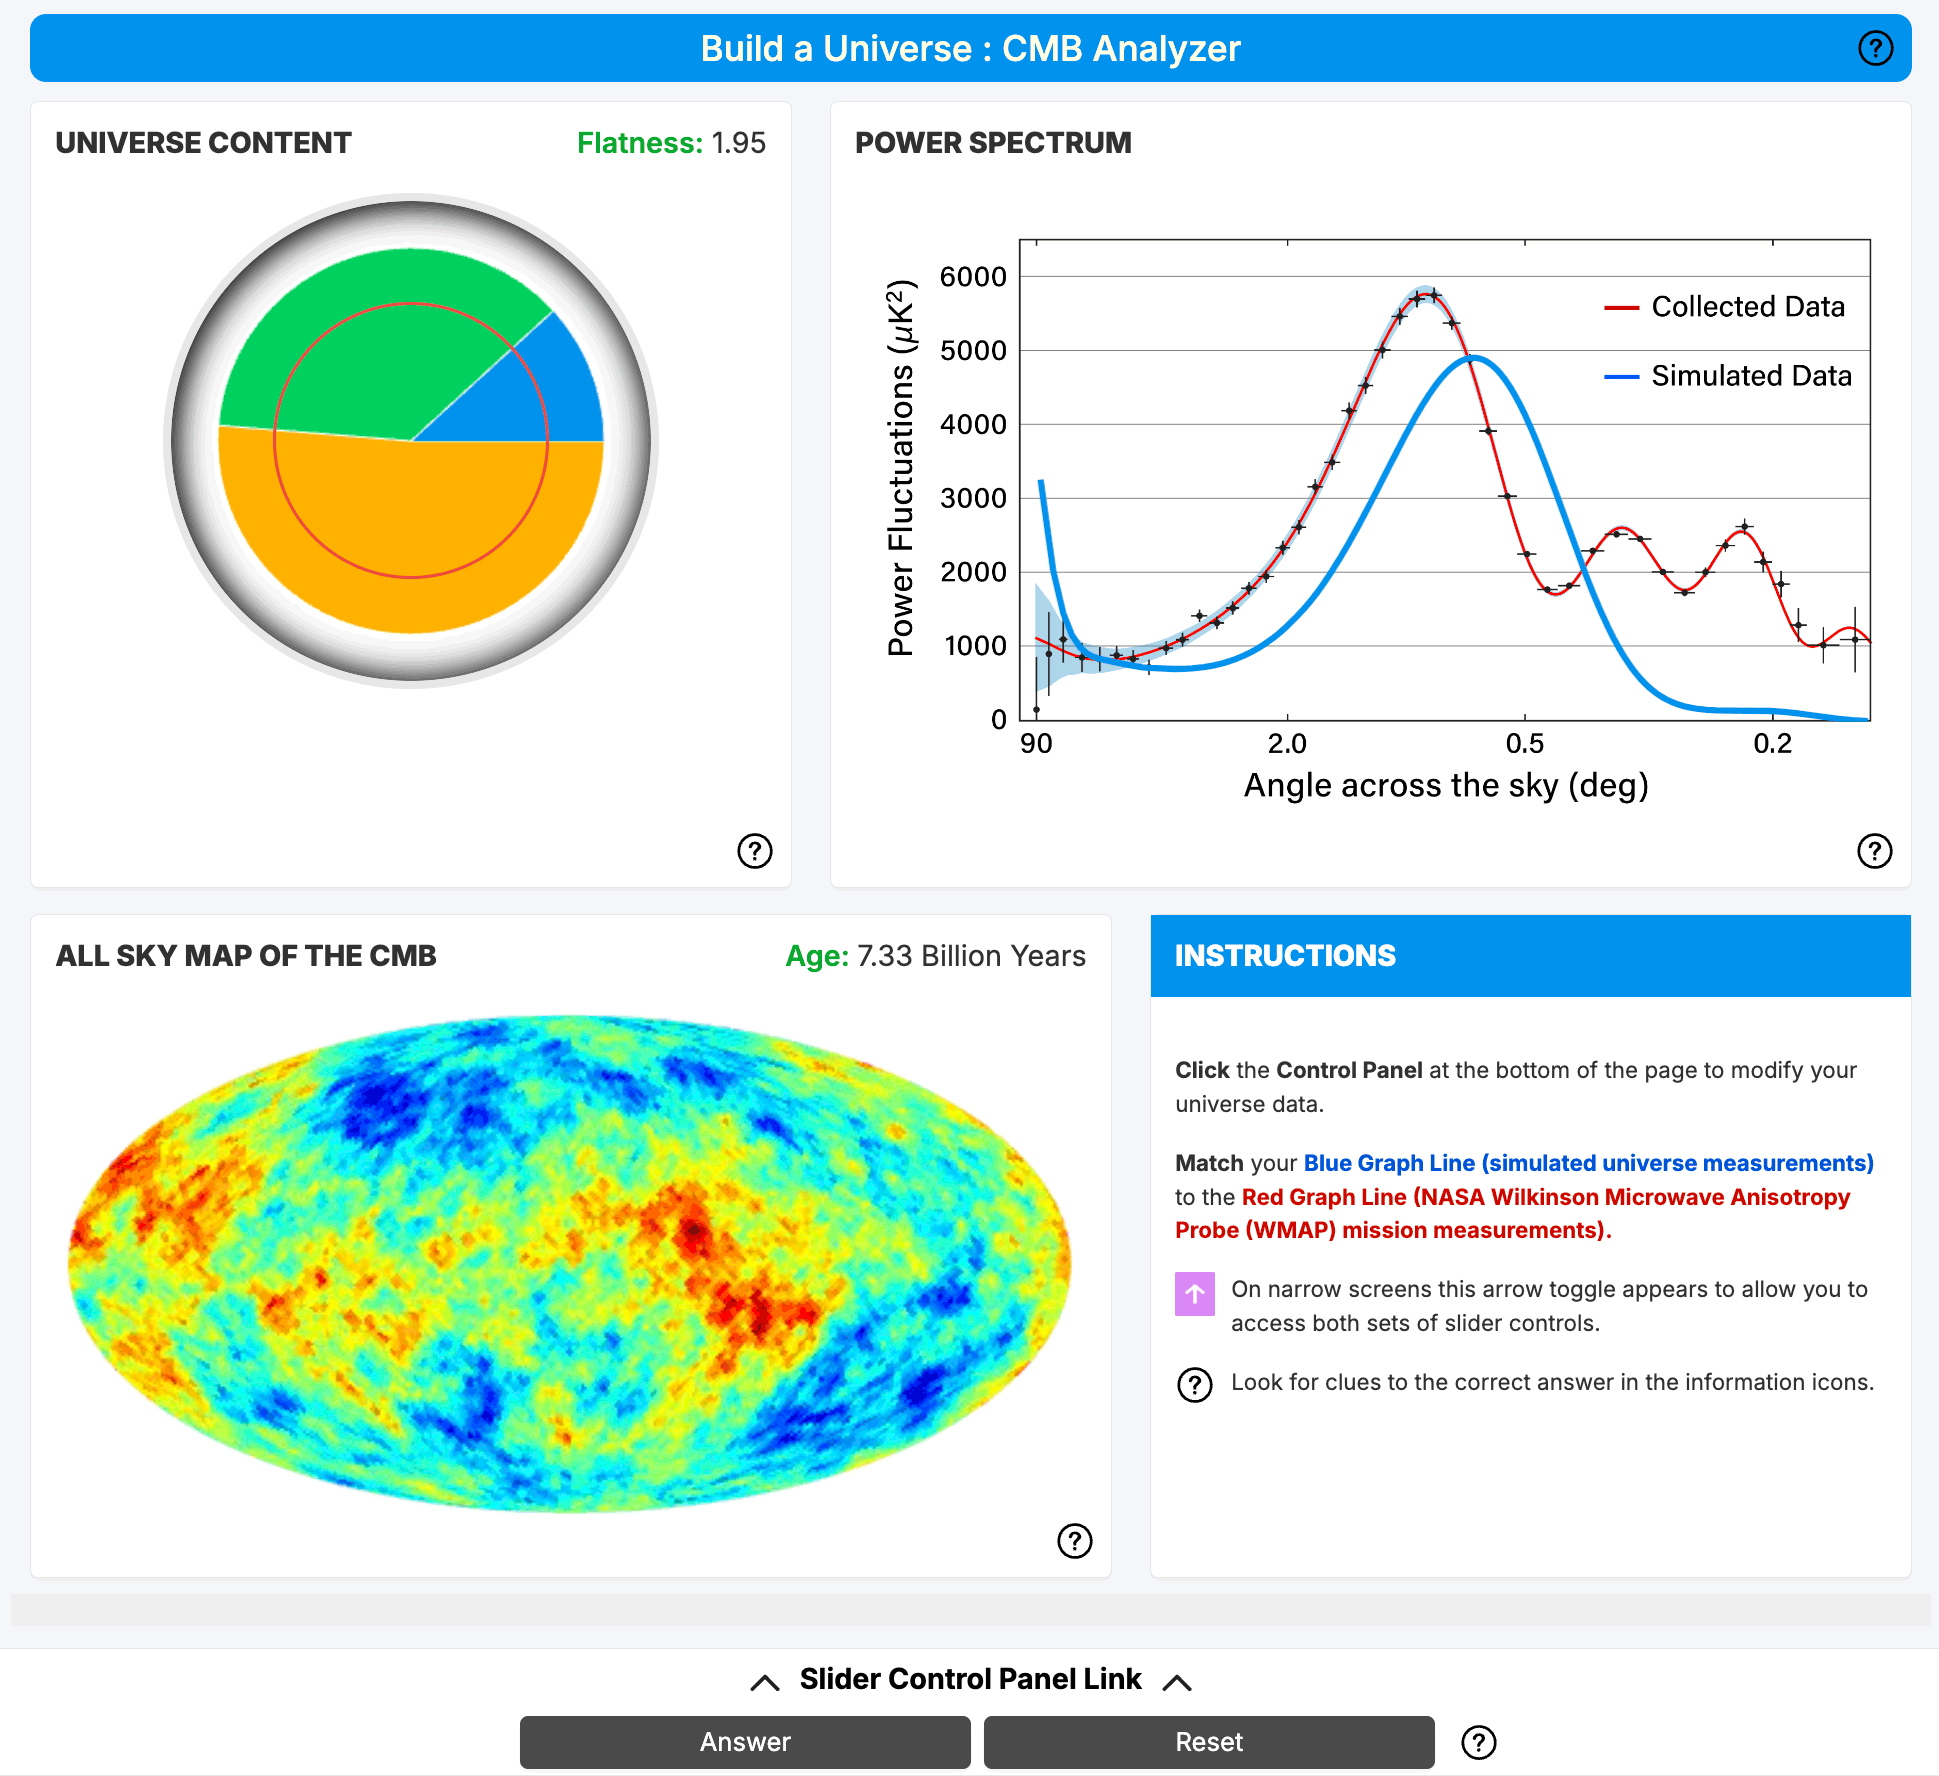
To address key cosmology scientific questions, WMAP measured small variations in the temperature of the cosmic microwave background radiation. For example: one part of the sky has a temperature of 2.7251° Kelvin (degrees above absolute zero), while another part of the sky has a temperature of 2.7249° Kelvin. In 1992, NASA's Cosmic Background Explorer (COBE) satellite discovered these tiny temperature differences on large angular scales. WMAP measured anisotropy with much finer detail and greater sensitivity than COBE did.
These measurements reveal the size, matter content, age, geometry and fate of the universe. They also reveal the primordial structure that grew to form galaxies and tested ideas about the origins of these primordial structures.
-
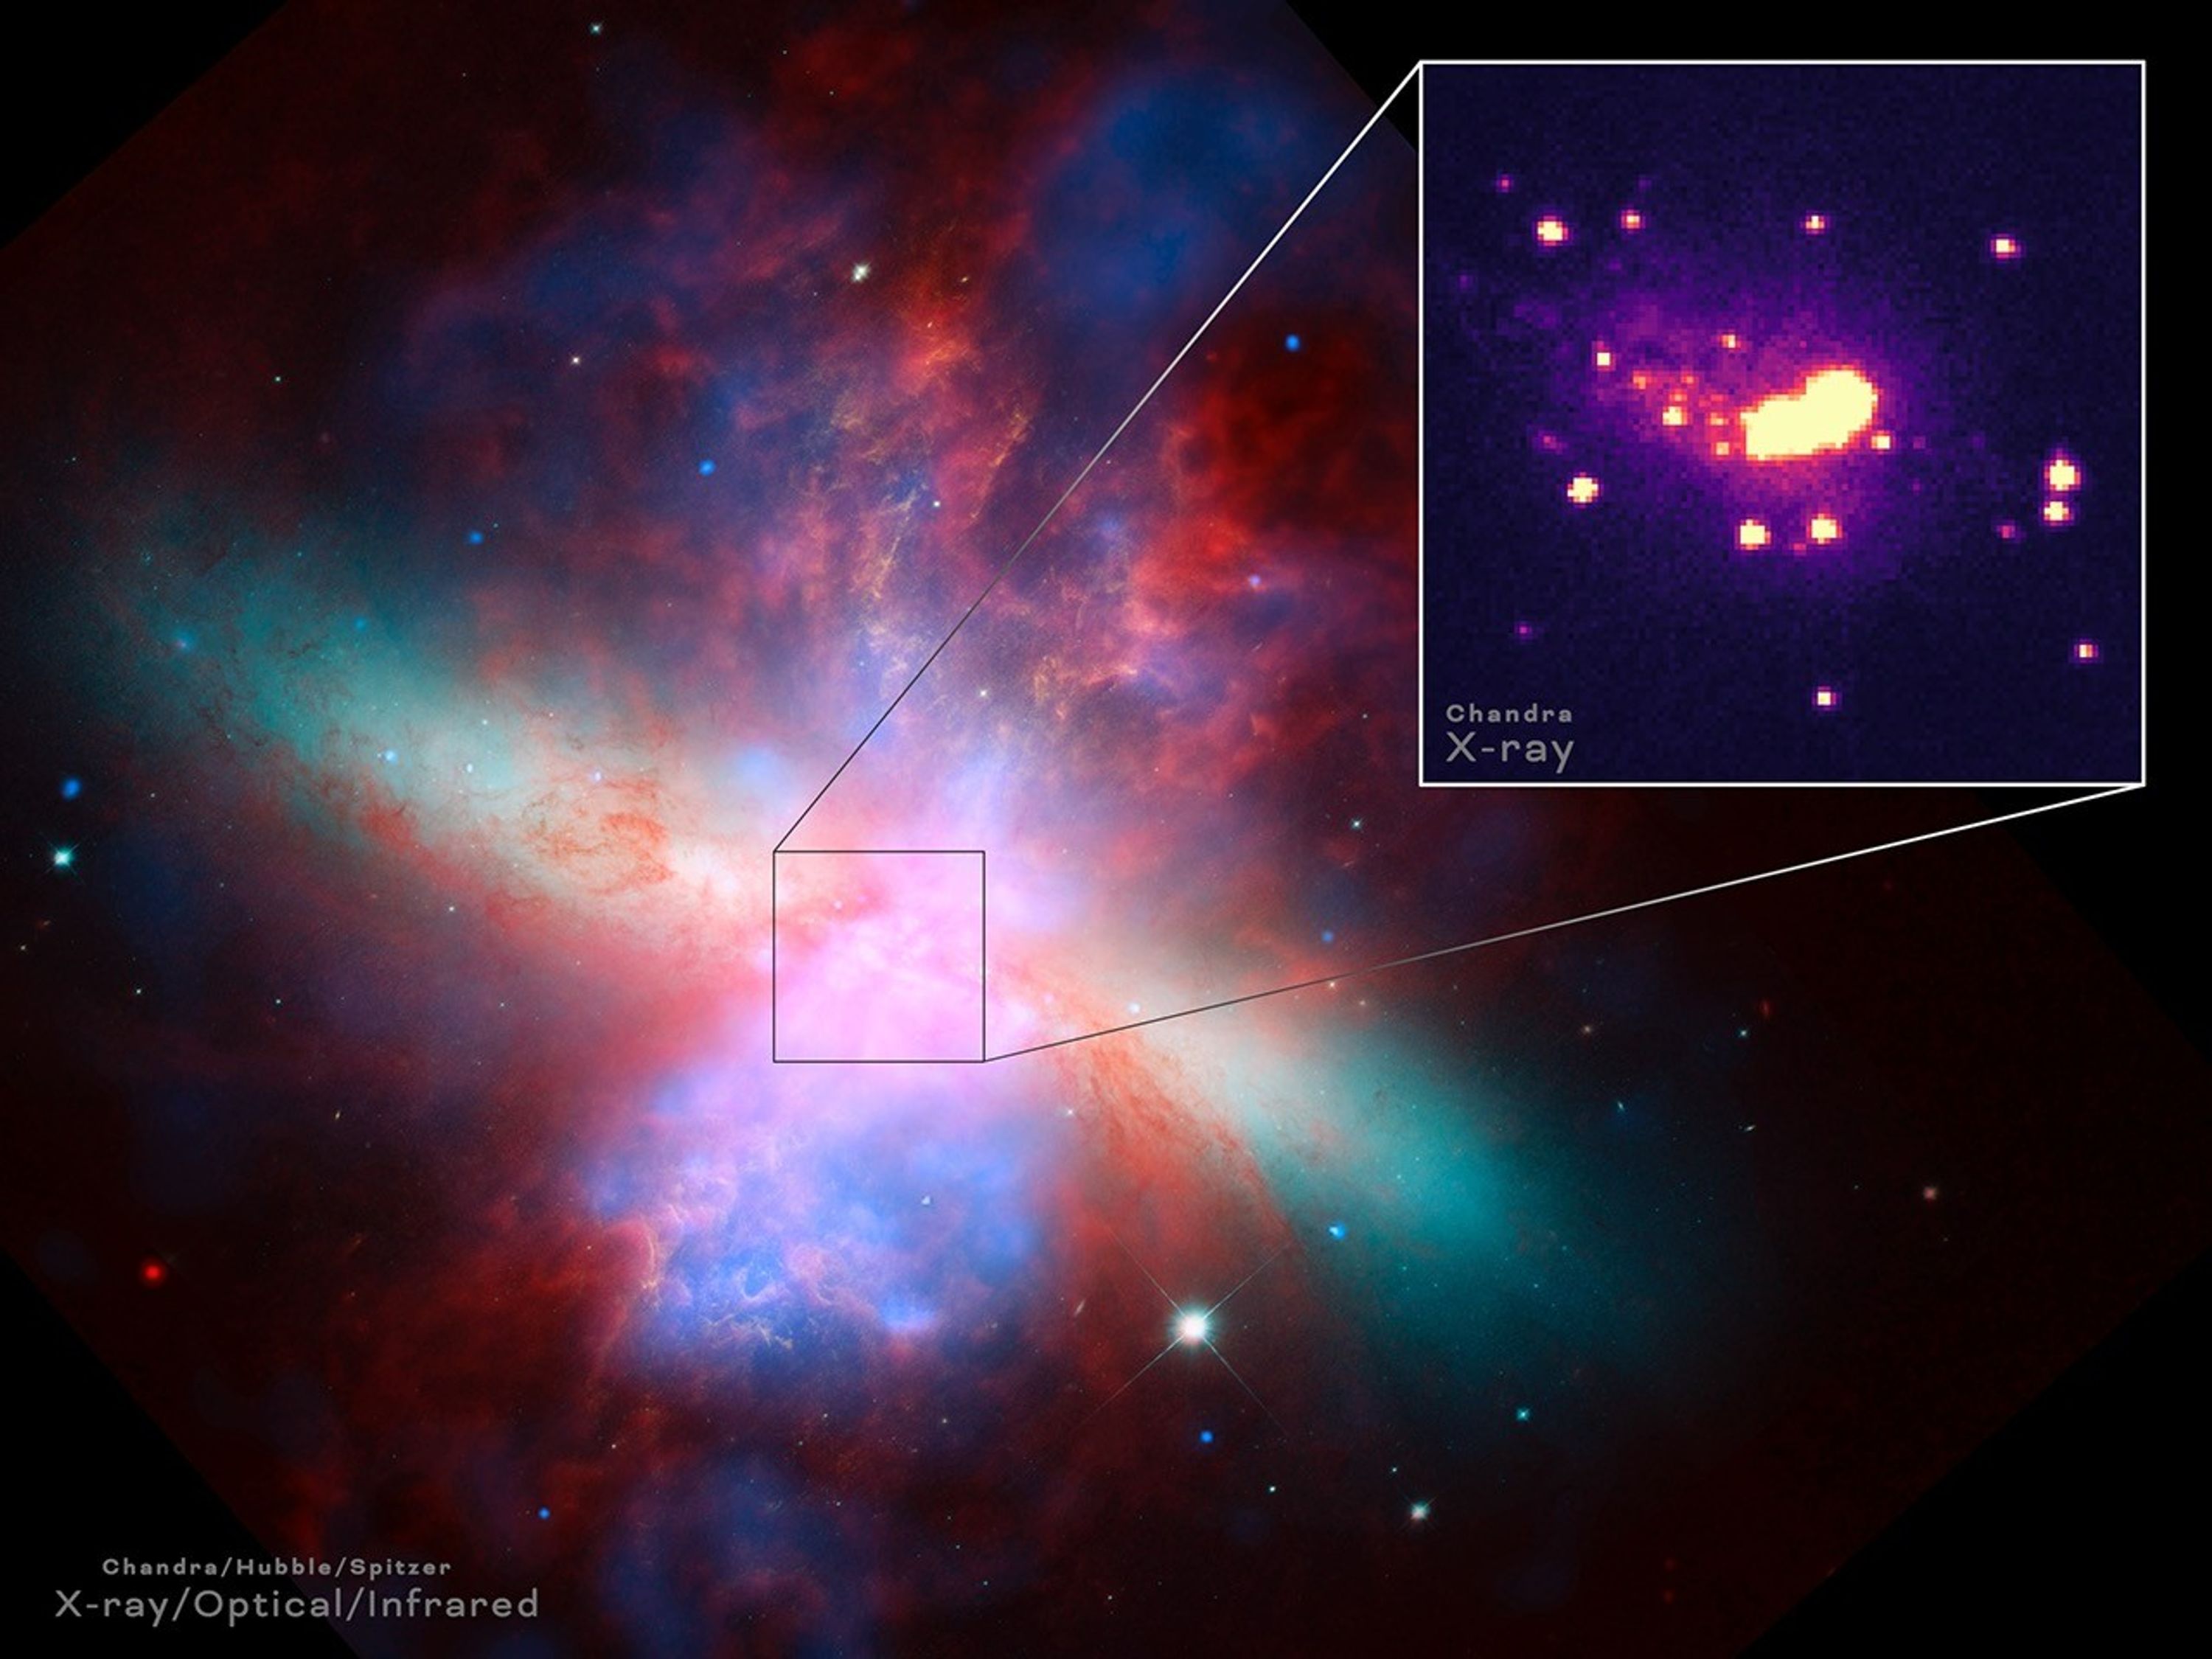
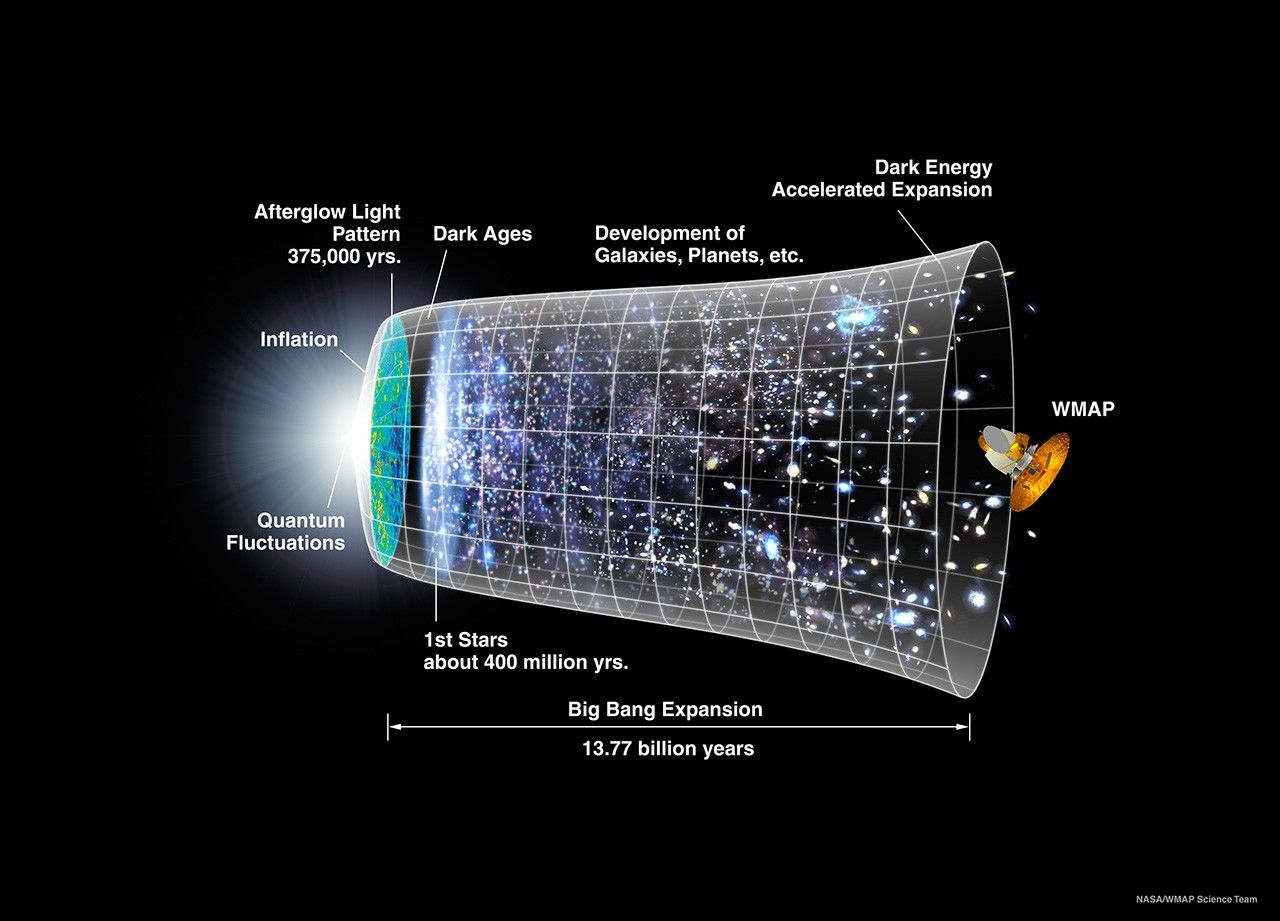
Evolution of the Universe
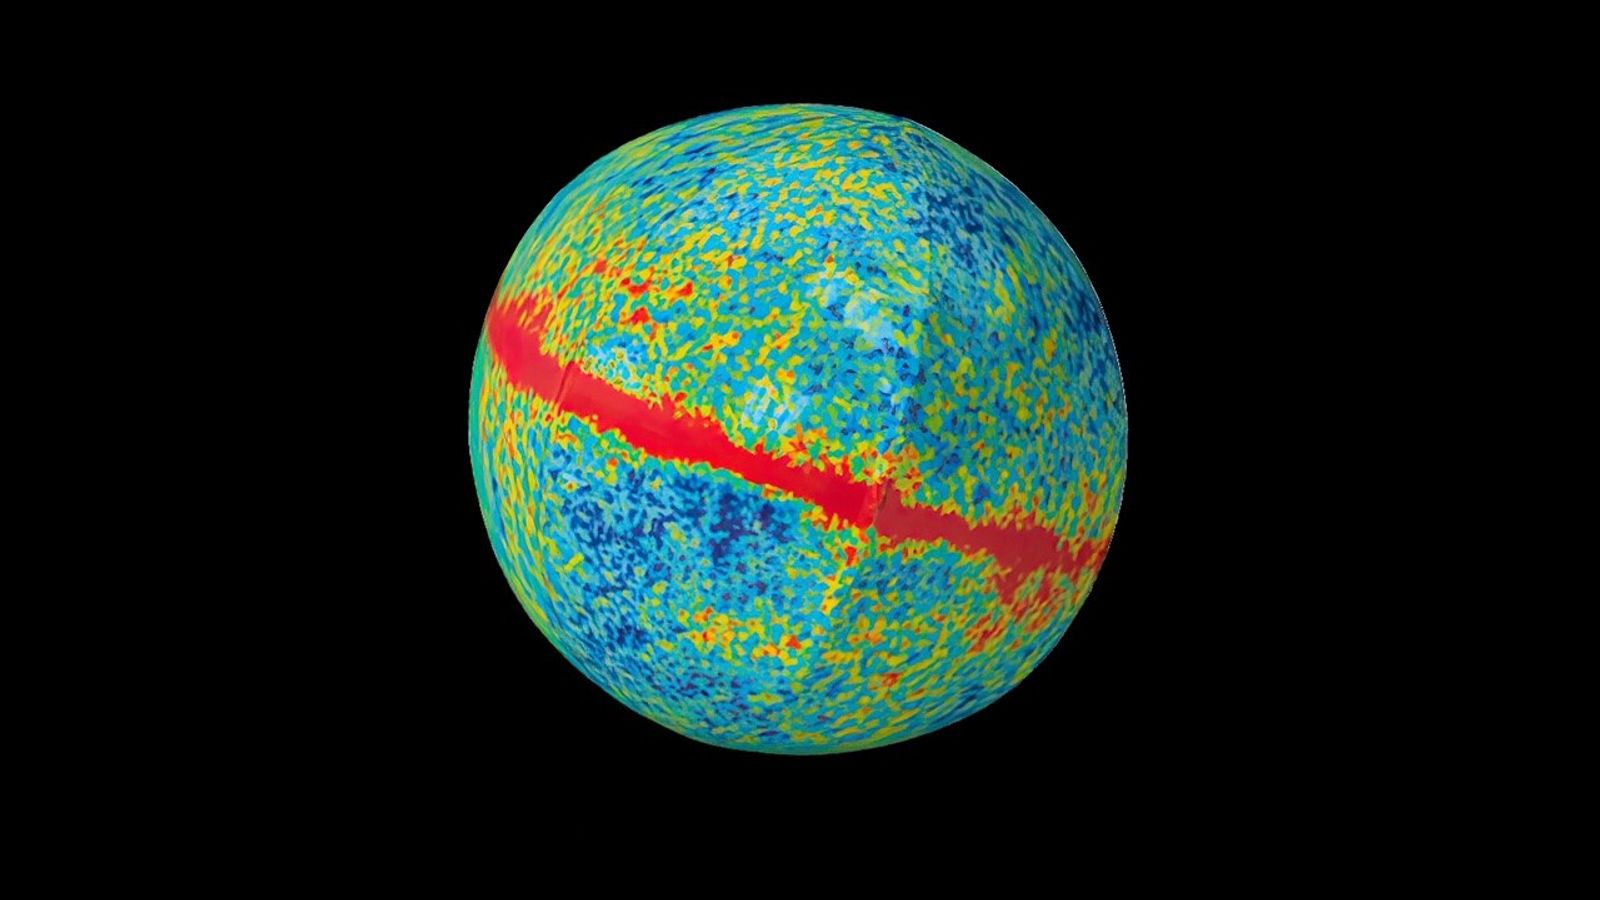
WMAP's "baby picture” shows the end of a process that begins with inflation and evolves to clumping of matter across the universe. This clumped matter eventually goes on to form stars and galaxies. When luminous objects form their radiation deionizes the Universe, ending the early “dark age” of the Universe.
Credit: NASA / WMAP Science Team
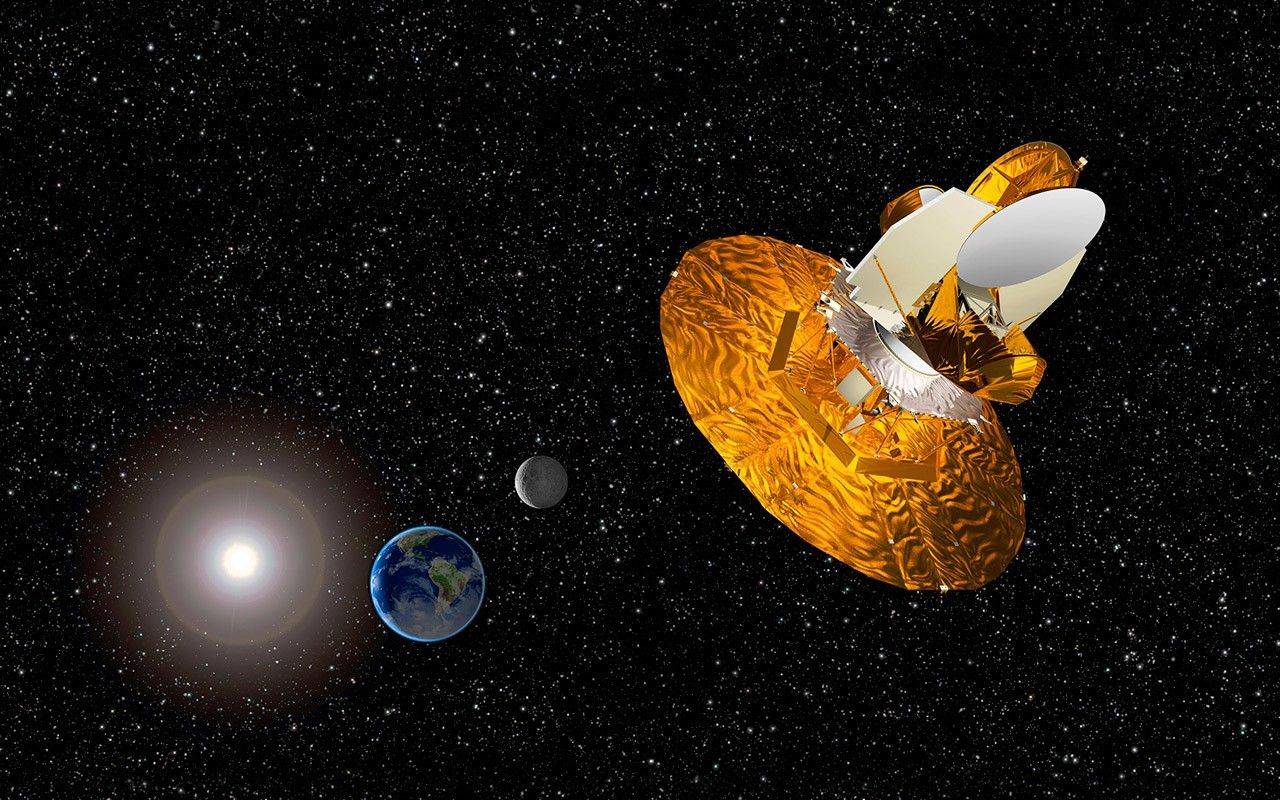
Mission
WMAP Trajectory to L2
The WMAP mission was proposed to NASA in 1995, approved in 1996 and launched in 2001. Operations were completed in 2010, and data analysis in 2013.
The Spacecraft was launched June 30, 2001 on a Med-Lite Delta II 7425-10 vehicle into a lunar assisted trajectory to the Sun-Earth L2 libration point for a nominal 27 month mission (3 months transit to L2, 24 months observing). The mission was subsequently extended to collect additional flight data. The total payload mass was about 830 kg. The WMAP instrument was continuously shaded from the Sun, Earth, and Moon by the spacecraft to allow lower thermal disturbances. WMAP ended the collection of science data on August 19th 2010.
The Spacecraft was launched with the name MAP (Microwave Anisotropy Probe), but was renamed WMAP after team member David T. Wilkinson (May 13, 1935 – Sept. 5, 2002)
-
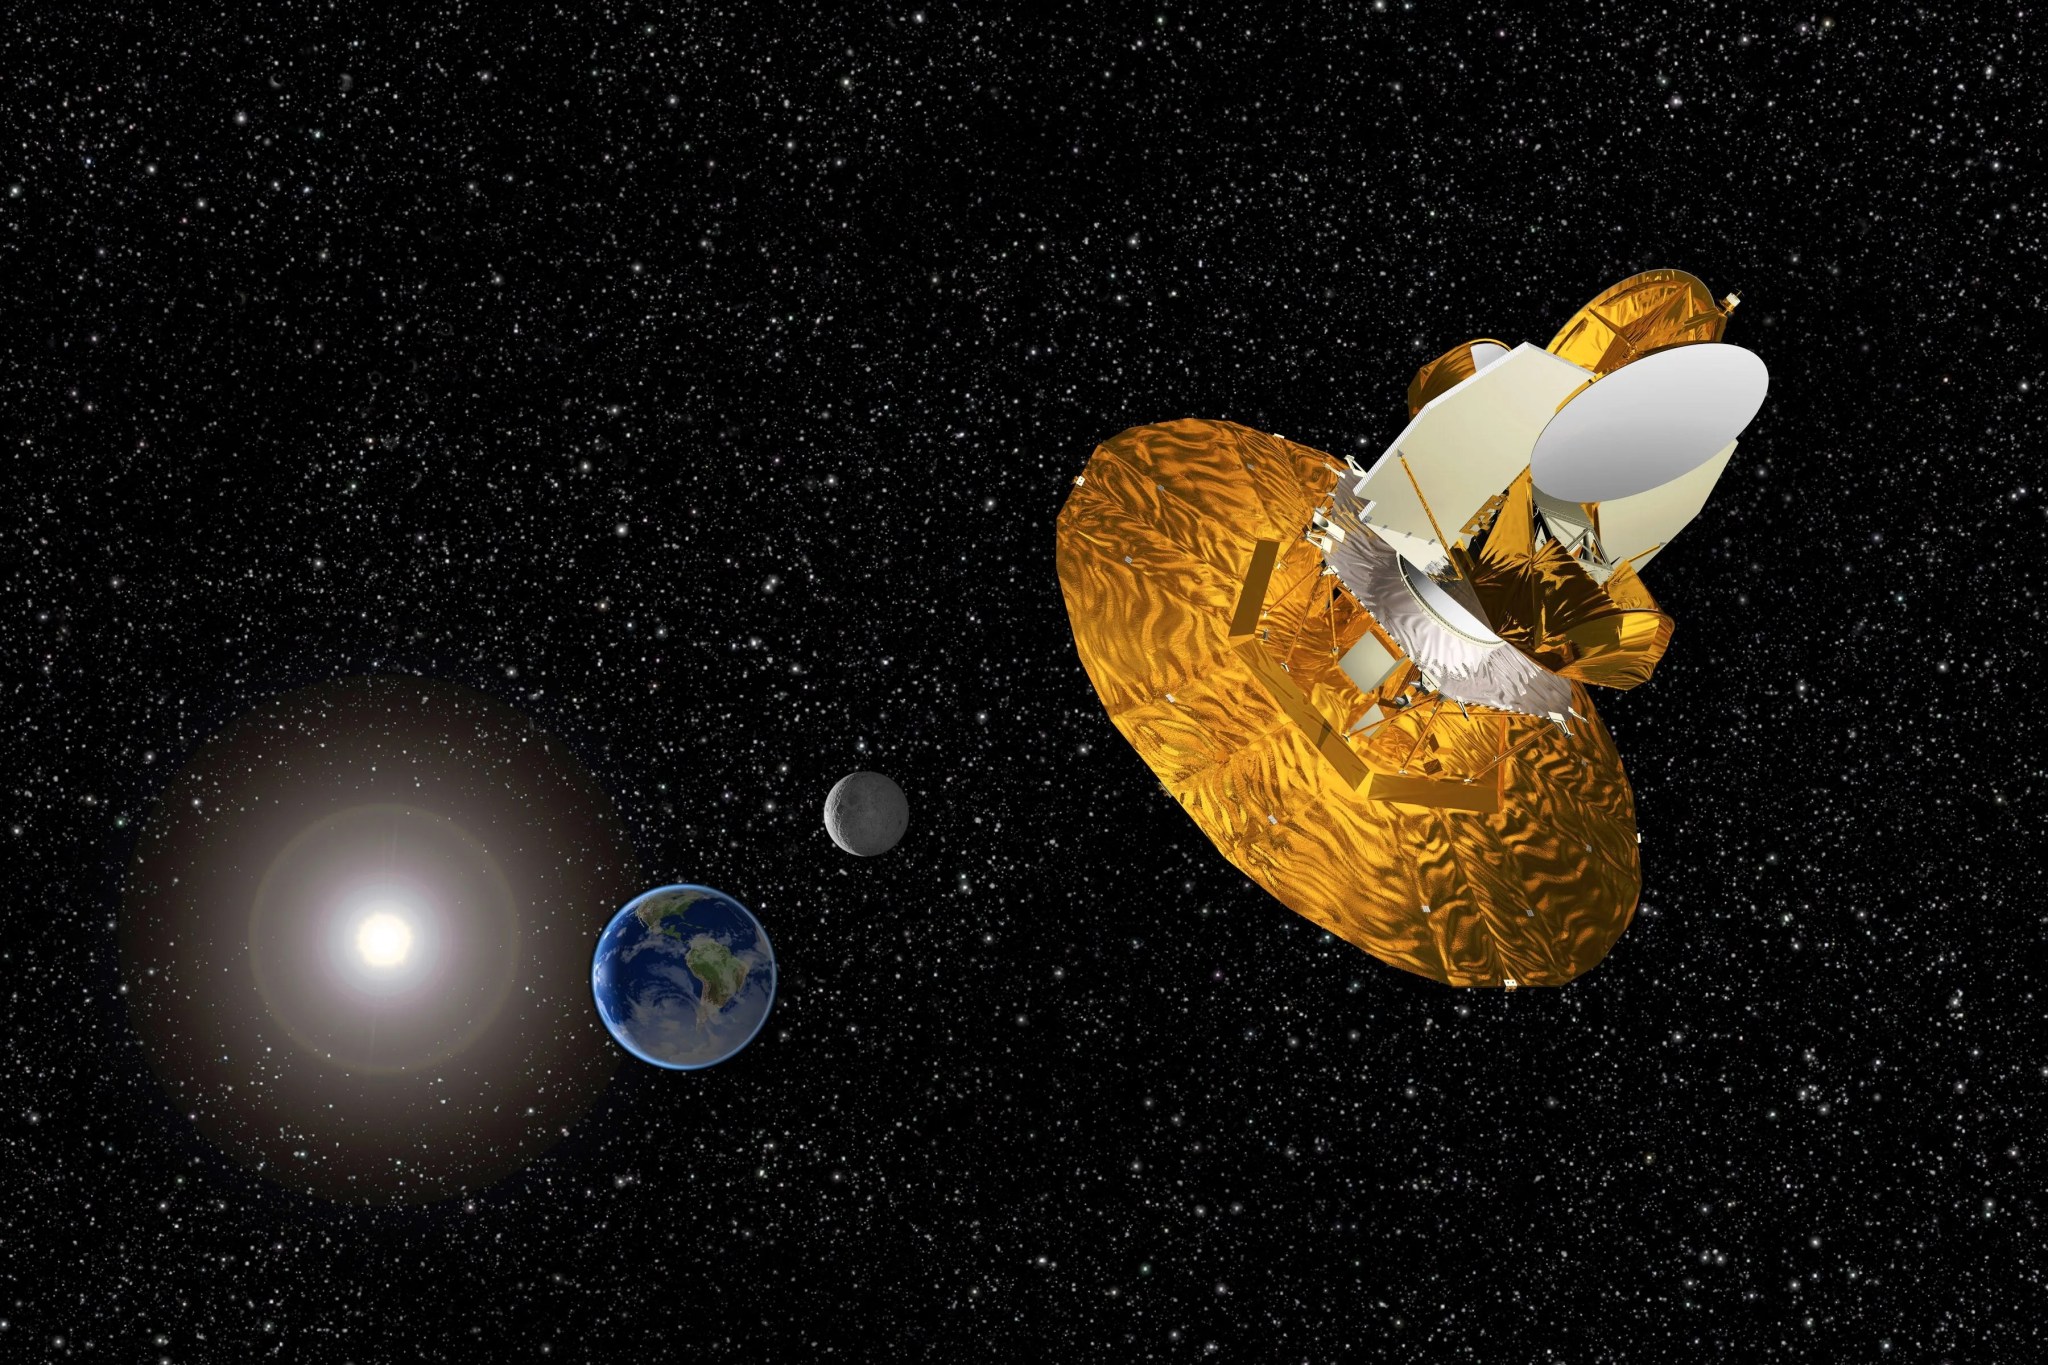
WMAP Fly-By at L2
WMAP orbits around the L2 Lagrange point, one million miles beyond Earth. The sun shield/solar panels always protect it from the radiation generated by the Sun. This animation is a slow pan of the spinning spacecraft as the camera travels by.
Credit: NASA / WMAP Science Team
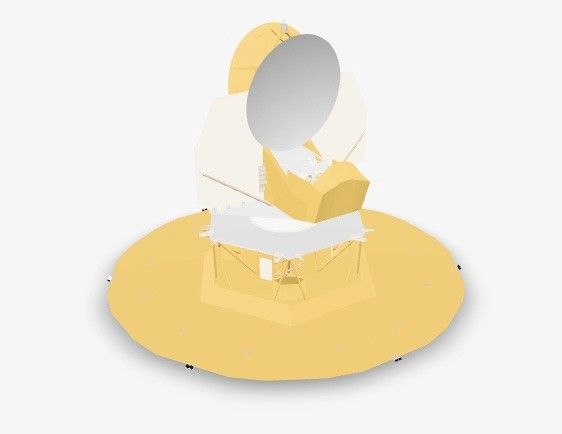
Observatory
The WMAP instrument consisted of a set of passively cooled microwave radiometers (connected to radiator panels with metal straps) with 1.4 x 1.6 meter diameter primary reflectors to provide the desired angular resolution. Measuring the temperature of the microwave sky to an accuracy of one millionth of a degree requires careful attention to potential sources of systematic errors. The avoidance of systematic measurement errors drove the design of WMAP:
- The instrument had five microwave frequency bands from 22 to 90 GHz to facilitate separation of galactic foreground signals from the cosmic background radiation.
- WMAP is a differential experiment: if you would like to know whether one piece of wood is longer than another, it is better to put the pieces directly next to each other than to measure them separately with a ruler. WMAP measured the temperature difference between two points in the sky rather than measuring absolute temperatures.
- An orbit about the Sun-Earth L2 libration point that provides for a very stable thermal environment and near 100% observing efficiency since the Sun, Earth, and Moon are always behind the instrument's field of view.
- The scan strategy rapidly sweeps the telescope view across the sky and allows for a comparison of many sky pixels on many time scales.
Location and Scan Strategy
-
WMAP Trajectory to L2
WMAP traveled for three months to reach L2
 Credit: NASA / WMAP Science Team
 -
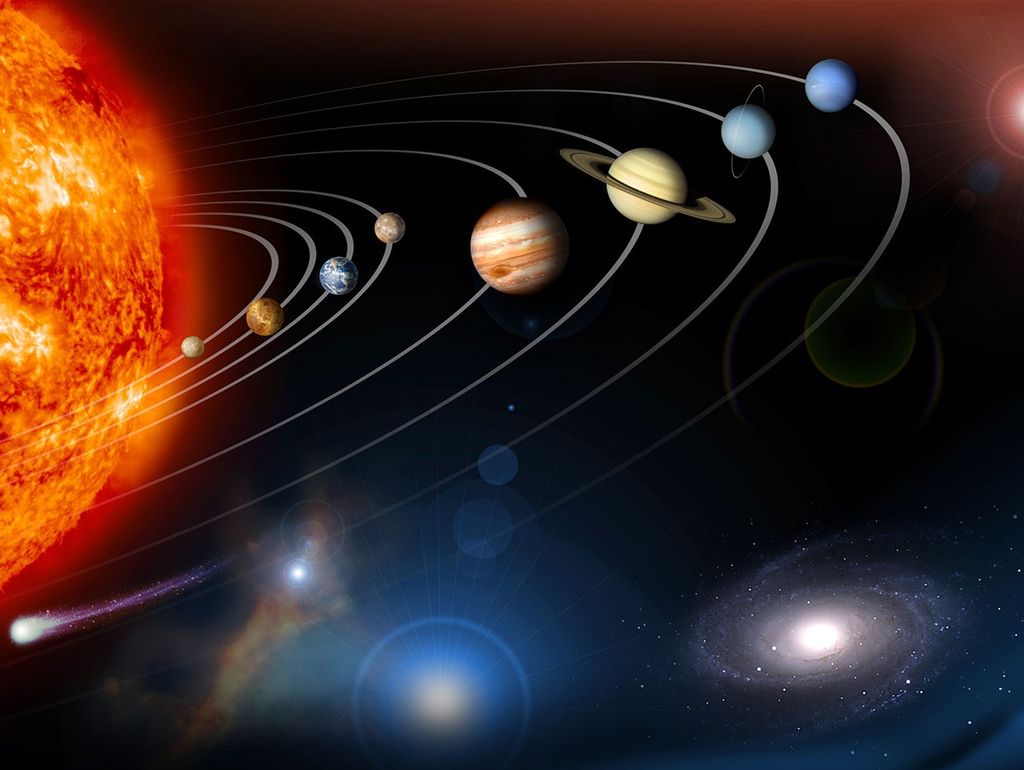
On Station at L2
Lagrange Points of the Earth-Sun system (not drawn to scale!). The L2 point of the Earth-Sun system was the home to the WMAP and Planck, and current home of James Webb Space Telescope. L2 is ideal for astronomy because a spacecraft is close enough to readily communicate with Earth, can keep Sun, Earth and Moon behind the spacecraft for solar power and (with appropriate shielding) provides a clear view of deep space for our telescopes. The gravitational features of L2 also allow for fuel savings to keep a staple position.
 Credit: NASA / WMAP Science Team
 -
WMAP Scan Strategy
The scan strategy that was ultimately adopted combines a "fast" spin about the spacecraft symmetry axis with a slow precession 22.5 ° about the Sun-WMAP line (which is always within 0.1° of the Sun-Earth line at L2). Since each telescope line of sight is ~70° off the symmetry axis, the path swept out on the sky by a given line of sight resembles a Spirograph® pattern that reaches from the north to south ecliptic poles.
 Credit: NASA / WMAP Science Team
Accomplishments
The WMAP science team has:
- Put the "precision" in "precision cosmology" by reducing the allowed volume of cosmological parameters by a factor in excess of 68,000. The three most highly cited physics and astronomy papers published in the 2000s are WMAP scientific papers - reflecting WMAP's enormous impact.
- Mapped the pattern of tiny fluctuations in the Cosmic Microwave Background (CMB) radiation (the oldest light in the universe) and produced the first fine-resolution (0.2 degree) full-sky map of the microwave sky.
- Determined the universe to be 13.77 billion years old to within a half percent.
- Nailed down the curvature of space to within 0.4% of "flat" Euclidean.
- Determined that ordinary atoms (also called baryons) make up only about 5% of the universe.
- Completed a census of the universe and finds that dark matter (matter not made up of atoms) is about 25.0%
- Determined that dark energy, in the form of a cosmological constant, makes up about 70% of the universe, causing the expansion rate of the universe to speed up.
- Mapped the polarization of the microwave radiation over the full sky, providing more complete data on the epoch of reionization.
- Detected that the amplitude of the variations in the density of the universe on big scales is slightly larger than smaller scales. This, along with other results, supports "inflation", the idea is that the universe underwent a dramatic period of expansion, growing by more than a trillion trillion fold in less than a trillionth of a trillionth of a second. Tiny fluctuations were generated during this expansion that eventually grew to form galaxies.
- Determined that the distribution of these fluctuations follows a bell curve with the same properties across the sky, and that there are equal numbers of hot and cold spots in the map. The simplest version of the inflation idea predicted these properties and remarkably, WMAP’s precision measurements of the properties of the fluctuations have confirmed these predictions, in detail.
- Other science experiments since WMAP have provided additional data and have significantly refined the details of our understanding of the Universe’s structure.
Awards
- 2019 Giuseppe and Vanna Cocconi Prize: for an outstanding contribution to Particle Astrophysics and Cosmology is awarded to the WMAP and Planck Collaborations for providing high-precision measurements of the cosmic microwave background temperature and polarization anisotropies, leading to detailed information on properties of the universe and tests of cosmological models and fundamental physics.
- 2018 Breakthrough Prize for Fundamental Physics: "WMAP wins the Fundamental Physics Award for detailed maps of the early universe that greatly improved our knowledge of the evolution of the cosmos and the fluctuations that seeded the formation of galaxies." - The prize is awarded to Charles L. Bennett, Gary Hinshaw, Norman Jarosik, Lyman Page Jr., David N. Spergel, and the 27 member WMAP Science Team.
- 2012 Gruber Prize for Cosmology medal: "The Gruber Foundation proudly presents the 2012 Cosmology Prize to Charles Bennett and the Wilkinson Microwave Anisotropy Probe team for their exquisite measurements of anisotropies in the relic radiation from the Big Bang---the Cosmic Microwave Background. These measurements have helped to secure rigorous constraints on the origin, content, age, and geometry of the Universe, transforming our current paradigm of structure formation from appealing scenario into precise science."
- 2010 Shaw Prize in Astronomy: Recognized, “Wilkinson Microwave Anisotropy Probe (WMAP) experiment, which has enabled precise determinations of the fundamental cosmological parameters, including the geometry, age and composition of the universe.”
- 2007 NASA Group Achievement Award (WMAP Polarization Maps)
- 2004 NASA Group Achievement Award (WMAP Temperature Maps)
- 2002 NASA Group Achievement Award (WMAP Mission)
- 2001 Popular Science “Best of What’s New” Award in Aviation and Space (for WMAP)
- Numerous other Recognitions and Awards for the contribution of Team Members to the WMAP Mission and Science
Plaudits from the science community were profuse:
-
"WMAP is the instrument that finally allowed scientists to hear the celestial music and figure out what sort of instrument our cosmos is... WMAP has nearly perfect pitch."
"It ends a decades-long argument about the nature of the universe and confirms that our cosmos is much, much stranger than we ever imagined."
"All the arguments of the last few decades about the basic properties of the universe—its age, its expansion rate, its composition, its density—have been settled in one fell swoop."
-Science Magazine 2003, "Breakthrough of the Year" article -
"In a sentence, the observations are spectacular and the conclusions are stunning. WMAP data support the notion that galaxies are nothing but quantum mechanics writ large across the sky." "To me, this is one of the marvels of the modern scientific age."
- Brian Greene (professor of physics and mathematics at Columbia University, string theory researcher) -
"The last word from WMAP marks the end of the beginning in our quest to understand the Universe. WMAP has brought precision to cosmology and the Universe will never be the same."
-Adam Riess, recipient of the 2011 Nobel Prize in physics
Pop Culture Influence
-
The Beach Ball
WMAP images appeared on TV, in newspapers, even cartoons around the world. To celebrate the astounding findings of WMAP, thousands of beachballs with the CMB microwave sky pattern (including the pesky foreground Galaxy signal for comparison) were distributed. This significant public outreach made an impact in both science and pop culture.
-
Stephen Hawking
Millions of social media posts and thousands of social media productions reference WMAP and its findings. This YouTube video from the UK Science Museum describes the usefulness of the beachball to cosmologist Stephen Hawking. These internet artifacts are also a part of the WMAP legacy.

-
Big Bang Theory
The beachball was displayed for years in the background of Sheldon’s apartment on the Big Bang Theory television series
 The beachball was displayed for years in the background of Sheldon’s apartment on the Big Bang Theory television seriesCredit: Warner Bros. Entertainment
WMAP Science Team Members
Chris Barnes, Rachel Bean, Charles L. Bennett, Olivier Doré, Joanna Dunkley, Benjamin M. Gold, Michael Greason, Mark Halpern, Robert Hill, Gary F. Hinshaw, Norman Jarosik, Alan Kogut, Eiichiro Komatsu, David Larson, Michele Limon, Stephan S. Meyer, Michael R. Nolta, Nils Odegard, Lyman Page, Hiranya V. Peiris, Kendrick Smith, David N. Spergel, Greg S. Tucker, Licia Verde, Janet L. Weiland, Edward Wollack, and Edward L. (Ned) Wright.