


T-58: Studying Titan's Northern Polar Vortex Region
", "credits": "", "zoom": 0, "fit": "fit", "parallax": "no", "focalPoint": {"x": ".50", "y": ".50"}}, "image_align": "wide", "migrated": true} -->
T-58: Studying Titan's Northern Polar Vortex Region
During T58, the Ultraviolet Imaging Spectrograph (UVIS) observed a long stellar occultation and a solar occultation. The two observations probe different parts of the atmosphere and are the most valuable Titan observations for UVIS because they provide detailed vertical profiles of nitrogen using the Extreme Ultraviolet (EUV) channel during solar occultations, and hydrocarbons, HCN, and aerosols using the Far Ultraviolet (FUV) channel during stellar occultations.
The solar occultation sampled the northern polar vortex region from about 900 kilometers altitude up to about 2,300 kilometers. This range overlaps the atmospheric region sampled by the Ion and Neutral Mass Spectrometer (INMS) and by Cassini¹s attitude control system, or AACS. Solar occultation measurements give a measure of the density profile of N2, the main constituent of the atmosphere, and the rate of change of the N2 density with altitude gives information on the temperature. There has been a long-running controversy about the density of the high atmosphere. AACS consistently gets a higher value than INMS and UVIS. This is one of the questions to address with the data from these observations.
Both the solar and stellar occultations show a complex picture of the upper atmosphere. Density profiles and mixing ratios cannot be described as a simple function of latitude and longitude. There is more going on, perhaps gravity wave activity, perhaps some other phenomena, which make the upper atmosphere more variable than simple models would predict. Continued observations like the ones in T58 will help us sort out these issues.
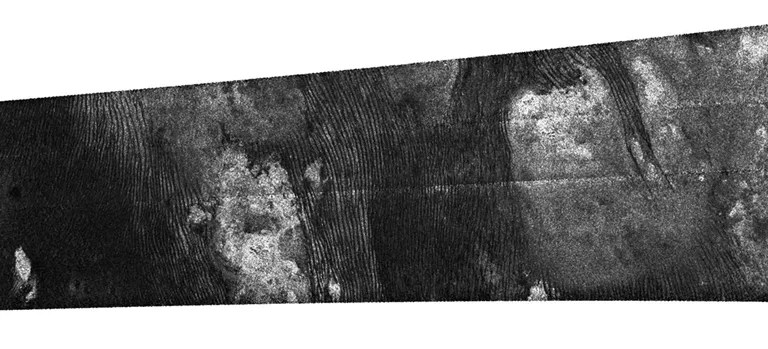
With INMS riding along, the RADAR instrument observed the western edge of Xanadu to study the boundary with Shangri-La using Synthetic Aperture Radar (SAR). The swath ran parallel to the T55/56/57 mapping sequence and covered Ontario Lacus. Altimetry observations of this same area will be obtained by RADAR during the T60 flyby.
The Composite Infrared Spectrometer (CIRS) performed a surface temperature scan and disk integration to search for new gases in far-IR, Imaging Science (ISS) acquired full-disk, global-mapping, and regional-mapping mosaics of the region southwest of Senkyo and northeast of Tsegihi at low phase angles, and rode along with the Visual and Infrared Mapping Spectrometer (VIMS) for high resolution imaging and cloud monitoring. VIMS ride-along observations provided information on the composition of Titan's atmosphere, and along with UVIS, observed during a stellar occultation that will provide information on the composition of Titan's atmosphere.
For the Magnetospheric and Plasma Science (MAPS) instruments, the Magnetospheric Imaging Instrument (MIMI) measured energetic ion and electron energy input to Titan¹s atmosphere, and the Radio and Plasma Wave Science (RPWS) instrument measured thermal plasmas in Titan's ionosphere and surrounding environment, searched for lightning in Titan's atmosphere, and investigated the interaction of Titan with Saturn's magnetosphere. As in T55, T56 and T57, Magnetometer measurements provided a description of the draping and the pileup of the external magnetic field around Titan on the night side hemisphere. This data set will be a good complement to those from T52, T53, T54, T55, T56 and T57 to characterize the background field for similar local times with respect to Saturn and different Saturn Kilometric Radiation longitudes.
Titan Flyby at a Glance
Date
July 8, 2009
Altitude
600 miles (965 km)
Speed
13,400 mph (6.0 km/sec)