4 min read
By Steve Cole, NASA Headquarters,
and Alan Buis, NASA’s Jet Propulsion Laboratory
NASA's new Soil Moisture Active Passive (SMAP) mission to map global soil moisture and detect whether soils are frozen or thawed has begun science operations.
Launched Jan. 31 on a minimum three-year mission, SMAP will help scientists understand links among Earth's water, energy and carbon cycles; reduce uncertainties in predicting climate; and enhance our ability to monitor and predict natural hazards like floods and droughts. SMAP data have additional practical applications, including improved weather forecasting and crop yield predictions.
During SMAP's first three months in orbit, referred to as SMAP's "commissioning" phase, the observatory was first exposed to the space environment, its solar array and reflector boom assembly containing SMAP's 20-foot (6-meter) reflector antenna were deployed, and the antenna and instruments were spun up to their full speed, enabling global measurements every two to three days.
The commissioning phase also was used to ensure that SMAP science data reliably flow from its instruments to science data processing facilities at NASA's Jet Propulsion Laboratory (JPL) in Pasadena, California, and the agency’s Goddard Space Flight Center in Greenbelt, Maryland.
"Fourteen years after the concept for a NASA mission to map global soil moisture was first proposed, SMAP now has formally transitioned to routine science operations," said Kent Kellogg, SMAP project manager at JPL. "SMAP's science team can now begin the important task of calibrating the observatory's science data products to ensure SMAP is meeting its requirements for measurement accuracy."
Together, SMAP's two instruments, which share a common antenna, produce the highest-resolution, most accurate soil moisture maps ever obtained from space. The spacecraft’s radar transmits microwave pulses to the ground and measures the strength of the signals that bounce back from Earth, whereas its radiometer measures microwaves that are naturally emitted from Earth’s surface.
"SMAP data will eventually reveal how soil moisture conditions are changing over time in response to climate and how this impacts regional water availability,” said Dara Entekhabi, SMAP science team leader at the Massachusetts Institute of Technology in Cambridge. “SMAP data will be combined with data from other missions like NASA's Global Precipitation Measurement, Aquarius and Gravity Recovery and Climate Experiment to reveal deeper insights into how the water cycle is evolving at global and regional scales."
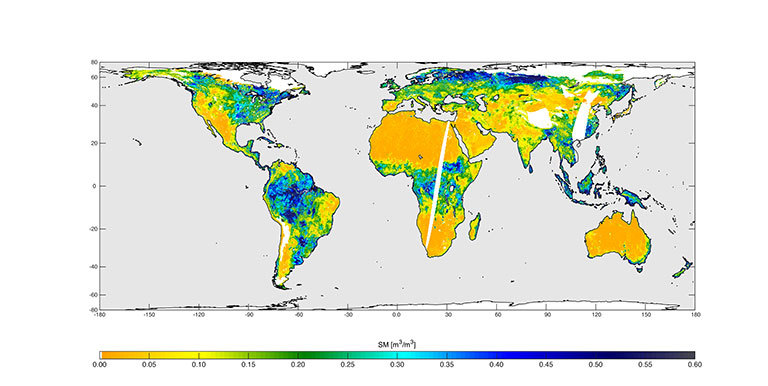
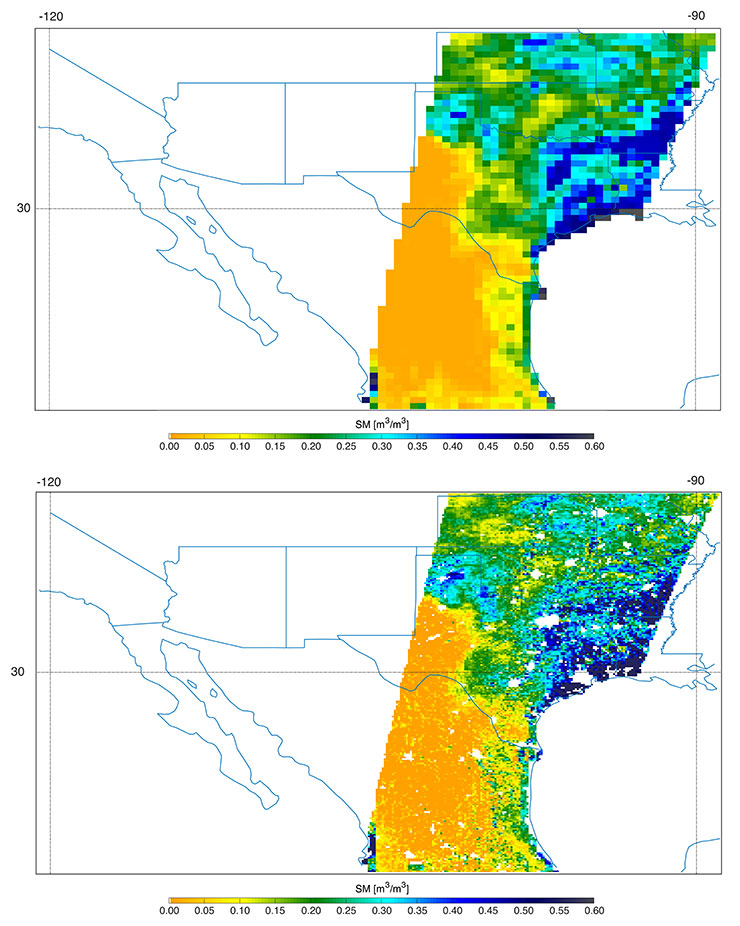
The first global view of SMAP's flagship product, a combined active-passive soil moisture map with a spatial resolution of 5.6 miles (9 kilometers), shows dry conditions in the Southwestern United States and in Australia's interior. Moist soil conditions are evident in the U.S. Midwest and in eastern regions of the United States, Europe and Asia. The far northern regions depicted in these SMAP maps do not indicate soil moisture measurements because the ground there was frozen.
Zooming in on the data allows a closer look at the benefits of combining SMAP's radar and radiometer data. A few days before SMAP collected data over the central and southern United States on April 27, intense rainstorms pounded northern Texas. The areas affected by the storm in northern Texas and the Gulf Coast are visible in great detail. Such detail can be used to improve local weather forecasts, assist in monitoring drought in smaller watersheds, and forecast floods.
Over the next year, SMAP data will be calibrated and validated by comparing it against ground measurements of soil moisture and freeze/thaw state around the world at sites representing a broad spectrum of soil types, topography, vegetation and ground cover. SMAP data also will be compared with soil moisture data from existing aircraft-mounted instruments and other satellites.
Preliminary calibrated data will be available in August at designated public-access data archives, including the National Snow and Ice Data Center in Boulder, Colorado, and Alaska Satellite Facility in Fairbanks. Preliminary soil moisture and freeze/thaw products will be available in November, with validated measurements scheduled to be available for use by the general science community in the summer of 2016.

