


SWOT (Surface Water and Ocean Topography)
Filters

The SWOT satellite caught the leading edge of the tsunami wave that rolled through the Pacific Ocean on July 30,…
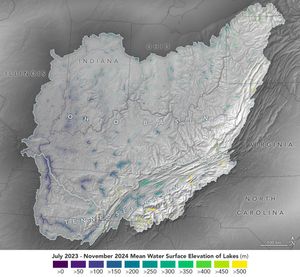
Data from the SWOT satellite was used to calculate average water levels for lakes and reservoirs in the Ohio River…
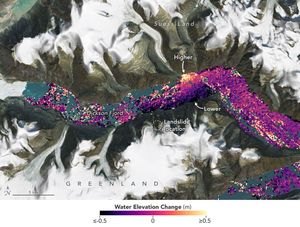
A SWOT data visualization shows high water levels on the northern side of Greenland's Dickson Fjord on Sept. 17, 2023.…
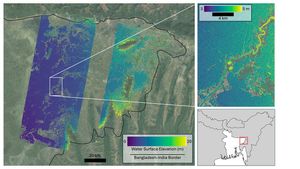
Flooding from monsoon rains covers a wide region of northeast Bangladesh in this Oct. 8, 2023, image showing data from…
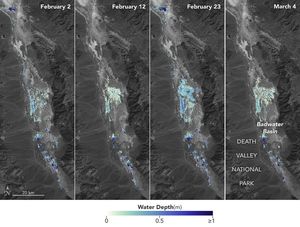
Water depths in Death Valley's temporary lake ranged between about 3 feet (or 1 meter, shown in dark blue) to…
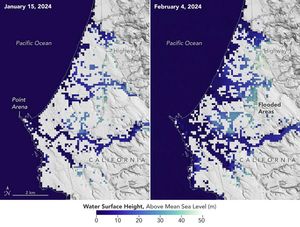
This image shows SWOT satellite data for water surface height in part of Mendocino County, Northern California, on Jan. 15,…
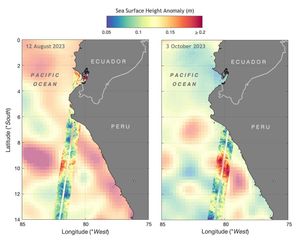
Data from the SWOT satellite shows sea level anomalies off the coast of Ecuador and Peru on Aug. 12, 2023,…
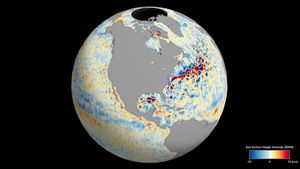
This animation shows global sea level data collected by the Surface Water and Ocean Topography satellite from July 26 to…
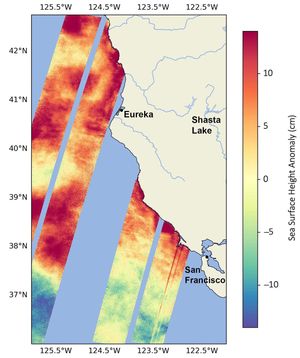
This data visualization shows sea surface heights off the northern California coast in August, 2023, as measured by the SWOT…