


Introduction
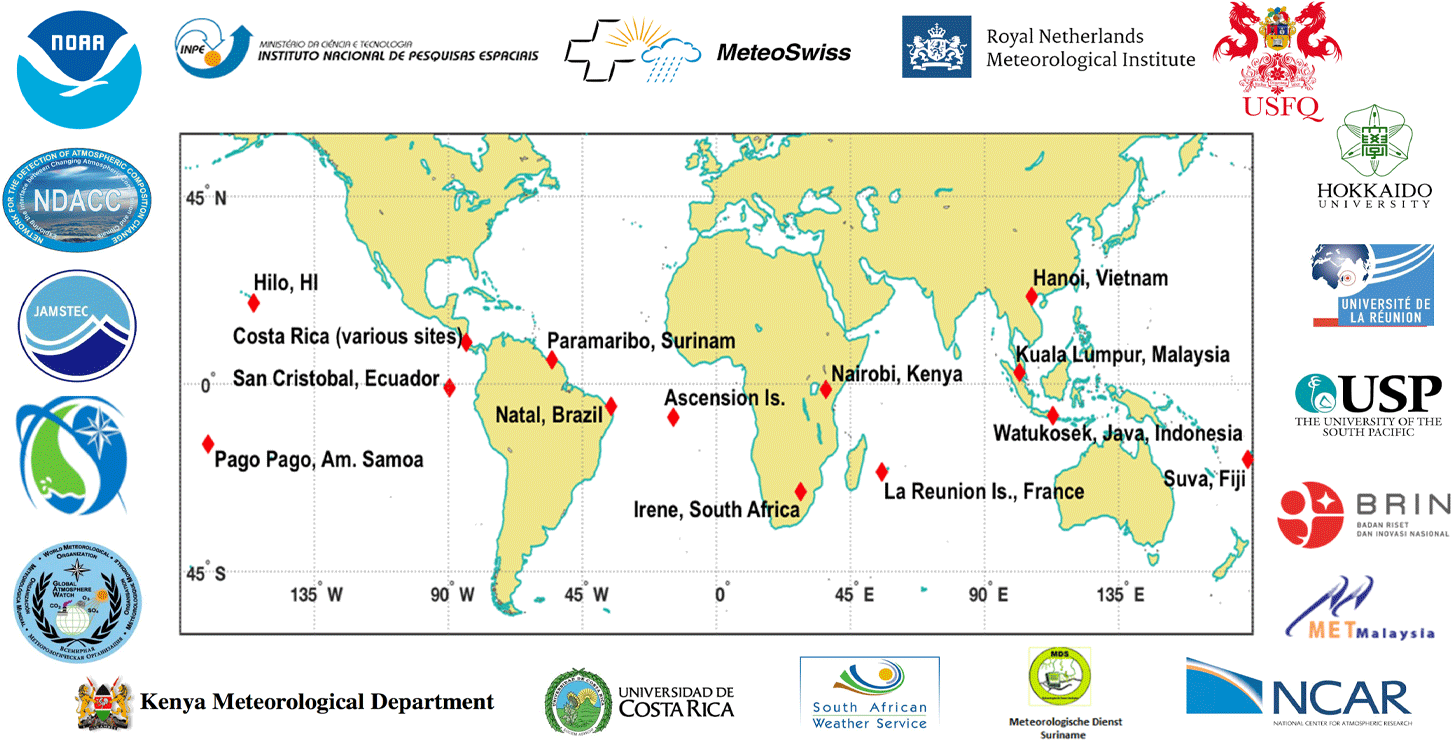
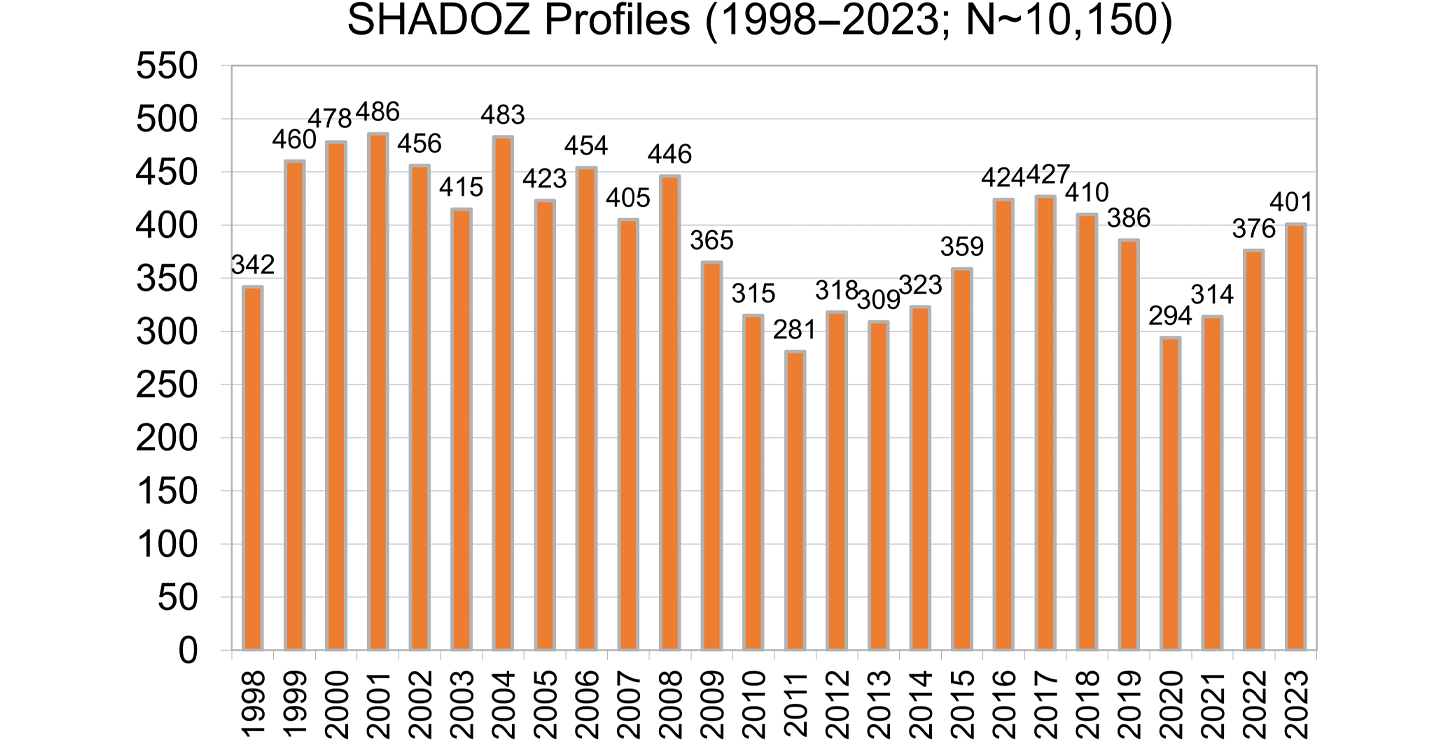
NASA’s Goddard Space Flight Center’s (GSFC) Southern Hemisphere Additional OZonesondes (SHADOZ) network, which coordinates balloon-borne ozonesonde launches from 14 tropical sites through global partnerships (see Figure 1 and Table, below), has reached two milestones: 25 years of operation and the archiving of 10,000 ozone and pressure-temperature-humidity (P-T-U) datasets. The 2023 archive amassed 400 profile pairs from the 14 stations—bouncing back from reduced operations during the COVID-19 pandemic. SHADOZ data are always in high demand for trend studies, ozone assessments, development of new satellite algorithms, and model evaluations. In 2023, more than 20 publications referenced SHADOZ data and on average the SHADOZ archive has over 300,000 data user hits in a year.
The SHADOZ leadership team consists of Ryan Stauffer [GSFC—SHADOZ Principal Investigator (PI) since 2021], Anne Thompson [GSFC, Emeritus—Founding SHADOZ PI, 1998–2021], and Debra Kollonige [Emeritus—GSFC/Science Systems and Applications Inc. (SSAI)—Data Archiver and Website Manager]. Several sources provide data for SHADOZ including: GSFC, NASA’s Wallops Flight Facility, NOAA’s Global Monitoring Laboratory, as well as international partners—from 14 nations on five continents.
Originally proposed as a three-year project to enhance the number of ozone profiles used for satellite algorithms in an under-sampled region of the world, SHADOZ has far exceeded its original scope and transformed our view of tropical ozone chemistry and dynamics as well as operational practices throughout the entire 60-station global sonde network. This article will summarize how SHADOZ has:
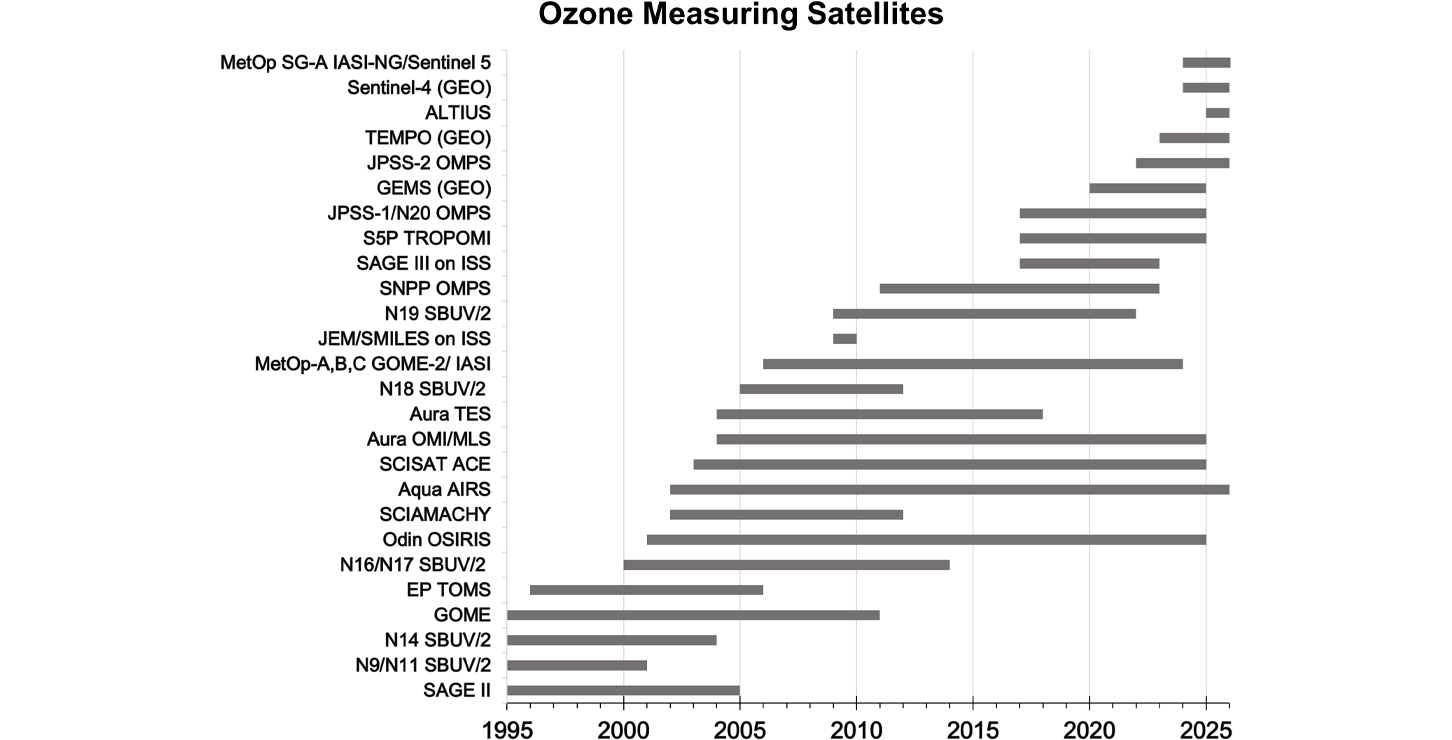
- coordinated ozonesonde launches to support more than 20 spaceborne instruments, which have led to advances in satellite ozone retrieval algorithms and enabled detection of instrument drift—see Figure 2.
- built capacity at network sites, by promoting “twinning” sponsorships—see Figure 1—that empower data providers through training, participation in laboratory tests of ozonesondes, and regular online meetings.
- enabled technological advances, by working within the World Meteorological Organization (WMO)/Global Atmosphere Watch (GAW) framework to facilitate instrument intercomparisons that have improved ozone profile data quality from 10–15% uncertainty in 1998 to ~5% uncertainty at present; and
- contributed data leading to scientific advances, in which SHADOZ profiles have been used to: study stratospheric and tropospheric ozone to assess impacts of climate oscillations on ozone distributions; determine sources of tropospheric and tropical tropopause layer (TTL) ozone; determine the structure of the zonal wave-one in tropospheric ozone and interactions with convection; and establish trends in TTL ozone—which provides a standard reference for satellite and model-derived estimates.
Celebration of both its 25-year milestone and collection of its 10,000th total ozone profile in 2023 offers another opportunity for reflection on the transformative scientific contributions of the SHADOZ program. This report builds on a previous article in The Earth Observer to mark the 20th anniversary of SHADOZ published in 2019. While this article summarizes some of the same information included in the 2019 article, the focus here is on new developments over the past five years and an assessment of the impact of a quarter-century of SHADOZ observations. The following sections review the origins and establishment of the SHADOZ network, the current status of the SHADOZ archive, SHADOZ leadership in advancing ozonesonde quality assurance, and recent SHADOZ discoveries through analysis of ozone trends in the lowermost stratosphere and free troposphere.
SHADOZ Origins and History
The original aim of the SHADOZ ozonesonde network was to enhance the development of a more robust ozone profile climatology for satellite algorithm refinement. In contrast to the well-established sounding stations in mid- and polar latitudes 25 years ago, the tropics remained undersampled. Natal, Brazil (6° S, 35° W), with intermittent soundings from American Samoa and Hawaii (see Table lower down in the article), provided the only soundings in the 1970s and 1980s, with minimal soundings over tropical Africa or Asia. During campaigns such as NASA’s Transport and Atmospheric Chemistry Experiment-Atlantic (TRACE-A) in 1992 and Pacific Exploratory Mission (PEM)-Tropics-A in 1996, sondes operated in the tropics and subtropics, complementing aircraft measurements by adding profile data above flight altitudes. The existing infrastructure for resuming soundings, including facilities, launch gas, and personnel, was already in place in these regions. In addition, Japanese researchers had established partnerships with agencies in Malaysia and Indonesia, providing additional motivation for NASA to establish SHADOZ.
The SHADOZ network design concept was innovative in aiming to:
- supply existing stations with additional ozonesonde expendables (approximately $1000/launch) to achieve a frequency of approximately four launches per month;
- collect all sonde data from a given station and distribute it through a simple-format website at GSFC without then-standard passwords or account setup;
- select stations to cover the entire tropical zone;
- establish ongoing collaborations with local entities (e.g., meteorological services, space agencies, universities) and sponsors (e.g., Japanese and European agencies) to leverage resources for sustaining long-term operations; and
- provide operational training where needed, and collaborate with in-country data providers in publication of results.
Current Network Status and Data Archive
Figure 1 illustrates the 14 SHADOZ stations with at least 10 years of operation, and the accompanying Table provides information on sponsoring organizations and the number of available ozone profiles as of October 2023. Note that the SHADOZ data archive includes profiles from three stations that only launched sondes for several years: Tahiti (1998–1999); Malindi, in coastal Kenya (1999–2006); Cotonou, Benin (2005–2007). Four stations are located in the subtropics: Hanoi and Hilo in the north, and Irene and La Réunion Island in the south—refer to Figure 1 for their respective locations. Additionally, 10 of the SHADOZ stations feature nearby or colocated, ground-based, total-column ozone instruments, such as the Brewer spectrophotometer, Dobson spectrophotometer, and Système D’Analyse par Observations Zénithales (SAOZ) spectrometer, for satellite calibration purposes.
| Station [latitude, longitude] | Partner Organization | Years Operational | Number of Profiles Obtained* |
| Hanoi, Vietnam [21.02° N, 105.81° E] | Vietnam Meteorological and Hydrological Administration and Japan Agency for Marine-Earth Science and Technology (JAMSTEC) | 2004–Present | 403 |
| Hilo, Hawaii [19.72° N, 155.05° W] | Mauna Loa Observatory (NOAA/GML) | 1998–Present | 1279 |
| San Pedro, Costa Rica [9.94° N, 84.04° W] | Universidad de Costa Rica | 2005–Present | 705 |
| Paramaribo, Surinam [5.81° N, 55.21° W] | Meteorological Service of Surinam and KNMI | 1999–Present | 908 |
| Kuala Lumpur, Malaysia [2.72° N, 101.70° E] | Malaysian Meteorological Department | 1998–2010; 2012–Present | 527 |
| San Cristóbal, Galapagos, Ecuador [0.90° S, 89.61° W] | Universidad San Francisco de Quito (USFQ) | 1998–2008; 2012–2016; 2021–Present | 508 |
| Nairobi, Kenya [1.30° S, 36.76° E] | Kenyan Meteorological Dept. and MéteoSwiss | 1998–Present | 1020 |
| Natal, Brazil [5.84° S, 35.21° W] | Instituto Nacional de Pesquisas Espaciais (INPE) [Brazilian Space Agency], GSFC, and NASA’s Wallops Flight Facility | 1998–2011; 2013–Present | 763 |
| Watukosek, Java, Indonesia [7.57° S, 112.68° E] | Badan Riset dan Inovasi Nasional (BRIN) [National Research and Innovation Agency] | 1998–2013; 2021–2022 | 372 |
| Ascension Island [7.97° S, 14.40° W] | U.S. Space Force and GSFC | 1998–2010; 2016–Present | 876 |
| Pago Pago, American Samoa [14.33° S, 170.71° W] | American Samoa Observatory (NOAA/GML) | 1998–Present | 915 |
| Suva, Fiji [18.15° S, 178.45° E] | University of the South Pacific and NOAA/GML | 1998–Present | 499 |
| La Réunion, France [20.89° S, 55.53° E] | Université La Réunion, Météo-France, and Centre National de la Recherche Scientifique (CNRS) | 1998–Present | 842 |
| Irene, South Africa [25.91° S, 28.21° E] | South African Weather Service | 1998–2008; 2012–Present | 428 |
Table. SHADOZ stations and partners with at least 10 years of data, with stations beginning between 1998–1999 except for Costa Rica (2005) and Hanoi (2004).
* These values represent the total number of profiles archived from each station as of October 2023.
In addition to the sustained support of SHADOZ operations, the popularity and growing applications of the data have contributed to the network reaching its milestone 10,000th profile—see Figure 3. In any given year, SHADOZ profiles average 350–400 profiles per year and represent about 20% of the data from all long-term ozonesonde stations across the globe. Furthermore, SHADOZ samples over a region that is equivalent to about 35–40% of Earth’s surface. The 2023 totals—shown in Figure 3—suggest that SHADOZ has fully rebounded from a downturn in data collection associated with COVID-19 shutdowns.
Technological Advances: SHADOZ Leads Data Quality Assurance Activities
With a few exceptions, the ozonesonde instrument’s basic construction has remained relatively constant since its invention in the 1960s. Generally, each ozonesonde is considered expendable and is “launched and lost,” meaning special care must be taken to characterize the instrument’s performance in the lab prior to launch. Much has been learned about the mechanical and chemical properties of the ozonesonde in the past few decades, which has led to ever-increasing data quality and accuracy through international cooperative efforts often spearheaded by the GSFC SHADOZ Team.
SHADOZ Data Accuracy: JOSIE and ASOPOS
The high accuracy and reliability of the SHADOZ (and global network) high-vertical-resolution ozone profiles—and thus their prominence in scientific studies—is a result of the GSFC SHADOZ team’s leading role in ozonesonde data quality assurance. For the past ~25 years, a series of Jülich Ozonesonde Intercomparison Experiments (JOSIE) have been held at Forschungszentrum Jülich (FZJ), Germany, including the GSFC co-led 2017 JOSIE–SHADOZ that was discussed at length in the 2019 article referenced in footnote 2. By carefully controlling temperature and ozone amount in the FZJ World Calibration Centre for Ozonesondes (WCCOS) test chamber, the JOSIE experiments evaluate various ozonesonde manufacturers, ozone sensing solution types, operating procedures, and the overall performance of the ozonesondes under simulated flight conditions. Analysis of JOSIE–SHADOZ 2017 and field experiment results led to the prescription of standard operating procedures (SOPs) by the Assessment of Standard Operating Procedures for OzoneSondes (ASOPOS and ASOPOS 2.0) as described in the landmark August 2021 ASOPOS 2.0 Report that are then implemented into the global network. The JOSIE–SHADOZ results were published first in a 2019 paper in Bulletin of the American Meteorological Society, on which Anne Thompson was lead author. They showed that, on average, total column ozone integrated from the ozonesondes matched the WCCOS ozone reference within ±3%. The most recent achievement from SHADOZ and the global ozonesonde network is the traceability of every ozonesonde profile to the world standard ozone reference at the WCCOS. Thanks to the ASOPOS-derived SOPs, ozonesonde data accuracy has seen a remarkable improvement from decades ago when ozonesonde biases of 10% or more were common.
Stability of SHADOZ Ozone Time Series
Because each ozonesonde is launched and lost, and procedures or instrument manufacturers may change over time, ASOPOS recommends tracking data quality according to the practices that SHADOZ developed. This means carrying out routine comparisons of ozonesonde measurements against satellite and colocated, ground-based, total column ozone data, including the Aura satellite’s Microwave Limb Sounder (MLS) stratospheric profiles, and a series of satellites carrying ultraviolet/visible (UV/VIS) instruments measuring ozone profiles and column ozone amounts. While the ozonesondes have historically been used to validate the satellite data (not the other way around), the best-calibrated satellite ozone instruments have matured to the point where they provide a useful reference to assess the long-term stability of ozonesonde network data. An example time series of comparisons among the ozonesonde data at the La Réunion SHADOZ station and various satellite sensors since the launch of Aura in 2004 is shown in Figure 4. The La Réunion profiles (both in the stratosphere and the integrated total column ozone) are exceptionally stable relative to the satellite data, with comparisons varying by just a few percent over the last two decades.
Even Better Data on the Way: Future Data Reprocessing
The publication of SHADOZ Version 6 (V06) data and associated manuscripts in the late-2010s marked a milestone for tropical ozonesonde data quality. Furthermore, the SHADOZ team anticipates using the results generated from the various JOSIE campaigns and laboratory experiments to eventually produce new V07 data. The two major changes to data processing between V06 and V07 will be:
- a correction for a sudden reduction in the efficiency of the ozonesonde pump for one of the two manufacturers, which has caused a recent stratospheric low ozone bias, documented in three recently published papers; and
- accounting for the time-response delay of the ozonesonde instrument sensor, making the ozone profile data more accurate in the tropopause region, where ozone amounts quickly change with altitude by up to an order of magnitude.

Recent SHADOZ Scientific Accomplishments
Progress made toward higher-quality ozonesonde data and the release of reprocessed V06 profiles drove many of SHADOZ’ recent scientific accomplishments. Namely, SHADOZ ozone profiles were sufficiently accurate to calculate reliable trends over a more than two-decade period and serve as the gold-standard for ground- and satellite-based ozone instrument intercomparisons.
25 Years of Definitive Ozone Profile Trends
The demonstration of the improved accuracy of SHADOZ V06 data motivated a re-examination of tropical ozone trends. SHADOZ trends of free-tropospheric (FT) ozone, which is defined as 5–15 km (~3–9 mi), and lowermost stratospheric (LMS) ozone, which is defined as 15–20 km (~9–12 mi), were calculated from 1998–2019. The results of this research were published in a landmark 2021 paper in Journal of Geophysical Research (JGR): Atmospheres with Anne Thompson as first author. The analysis identified both common and distinct patterns across five well-distributed tropical SHADOZ stations (combining records from three of them). Among the findings:
- FT ozone trends were seasonally and longitudinally varying, ranging from about +1 to +4% per decade across the sites on an annual basis, but up to +20% per decade in certain months;
- All stations exhibited peak FT ozone trends in the first half of the year—generally coinciding with the convectively active, typically low ozone times of year; however, FT ozone trends were generally weak thereafter; and
- Most stations exhibited significant negative LMS ozone trends in the second half of the year during which positive trends in tropopause height were discovered. Trends computed in tropopause height-relative coordinates showed that this negative trend disappeared. This result signals an “artifact” negative trend in LMS ozone and a likely manifestation of climate change, instead of chemical loss of ozone.
This article provides an update to the 1998–2019 SHADOZ trends study (summarized above) to determine the robustness of the LMS and tropopause height trends with three more years of profiles (1998–2022). Figure 5 depicts monthly trend output from the GSFC Multiple Linear Regression (MLR) model for the five stations: San Cristóbal and Paramaribo (SC-Para), Natal and Ascension Island (Nat–Asc), Nairobi, Kuala Lumpur and Watukosek (KL–Java), and Samoa.

As with the original study, there is a strong anticorrelation among ozone trends at 15–20 km (9–12 mi) (Figure 5, top) and the 380 K potential temperature (θ) surface (Figure 5, middle) trends. Referencing the altitude coordinates to the tropopause height (Figure 5, bottom), the LMS ozone trends disappear, and the conclusions of the 2021 study remain robust when adding three years of additional SHADOZ data and computing 25 years of trends. Additional follow-on work is currently underway to link the early part of the year positive FT trends described above with a decrease in convective activity over the Kuala Lumpur and Watukosek stations.
Tropospheric Ozone Trends and Assessment Report
The extensive SHADOZ record and highly-accurate ozone data along with the network of in-situ tropical ozone profiles played a key role in the International Global Atmospheric Chemistry (IGAC) community-sponsored Tropospheric Ozone Assessment Report, Phase I (TOAR-I) from 2014–2019, and the currently ongoing Phase II (TOAR-II) which ends in 2024. The follow-on assessment seeks to understand the distribution, recent trends, future projections of tropospheric ozone, and the harmful effects of tropospheric ozone on crop production and human health. The SHADOZ team participates in three of the TOAR-II Working Groups: Harmonization and Evaluation of Ground Based Instruments for Free Tropospheric Ozone Measurements (HEGIFTOM), the Ozone and Precursors in the Tropics (OPT), and the Ozone over the Oceans.
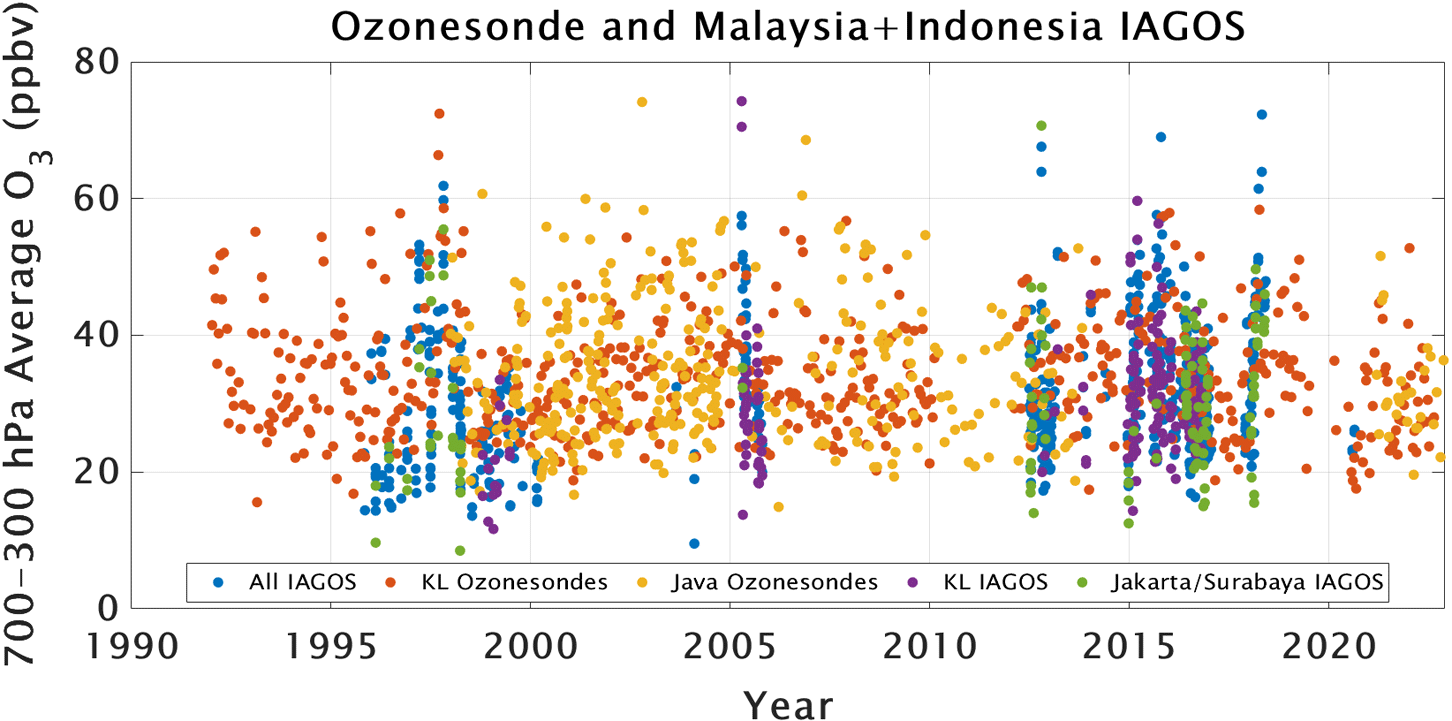
SHADOZ profiles are the gold standard and thus are used in TOAR-II to evaluate other sources of ozone data such as profiles from the In-service Aircraft for a Global Observing System (IAGOS) program and ground-based measurements from Brewer and Dobson spectrophotometers, Fourier transform infrared (FTIR) instruments, and lidar. The SHADOZ trends for the FT produce results by which other instrument platforms and model simulations will be judged. Figure 6 provides an example of ozone time series, including the SHADOZ Kuala Lumpur (KL) and Watukosek (Java) stations, and IAGOS from the same Malaysia + Indonesia region. These data display generally good agreement between SHADOZ and IAGOS over tropical Southeast Asia. Note that Figure 6 also includes pre-SHADOZ data from KL, extending the available data set for ozone trends calculations and comparisons with other sources of ozone data, including from satellites over several decades.
Conclusion and Looking Ahead
The SHADOZ ozonesonde network has amassed a remarkable 25-year data set from its currently 14 active stations, with the milestone 10,000th ozonesonde profile archived in 2023. The GSFC SHADOZ team continues to lead the way on ozone science and data quality assurance for the entire global network of ~60 stations. The success of the network is due, in no small part, to the prolific use of the high-quality data by hundreds of scientists across the globe, the dedication of local institutions and station operators, and the unwavering support for the data collection and GSFC archive implementation from NASA Headquarters.
SHADOZ has innovated from the start, with the concept of leveraged resources to sustain operations; open access and simple formats; engage operators in standardizing ozonesonde best practices; develop quality indicators; and host regular online meetings with station managers, technicians, and data archivers.
SHADOZ will continue to push the boundaries of what is possible regarding the accuracy from ozonesonde data. With the eventual reprocessing and publication of V07 data, the user community can expect new science and more advanced satellite products derived using SHADOZ in the near-future.

Acknowledgments
The authors of this article are grateful for the steady support received from NASA’s Science Mission Directorate and, in particular, the support of the Upper Atmosphere Research Program (UARP) managers at NASA Headquarters: Michael Kurylo, [1998–2007] and Kenneth Jucks,[2008–present].
Ryan Stauffer
NASA’s Goddard Space Flight Center
ryan.m.stauffer@nasa.gov
Anne Thompson
NASA’s Goddard Space Flight Center, Emeritus/University of Maryland, Baltimore County
anne.m.thompson@nasa.gov
Debra Kollonige
NASA’s Goddard Space Flight Center, Emeritus/Science Systems and Application, Inc.
debra.e.kollonige@nasa.gov