


Introduction
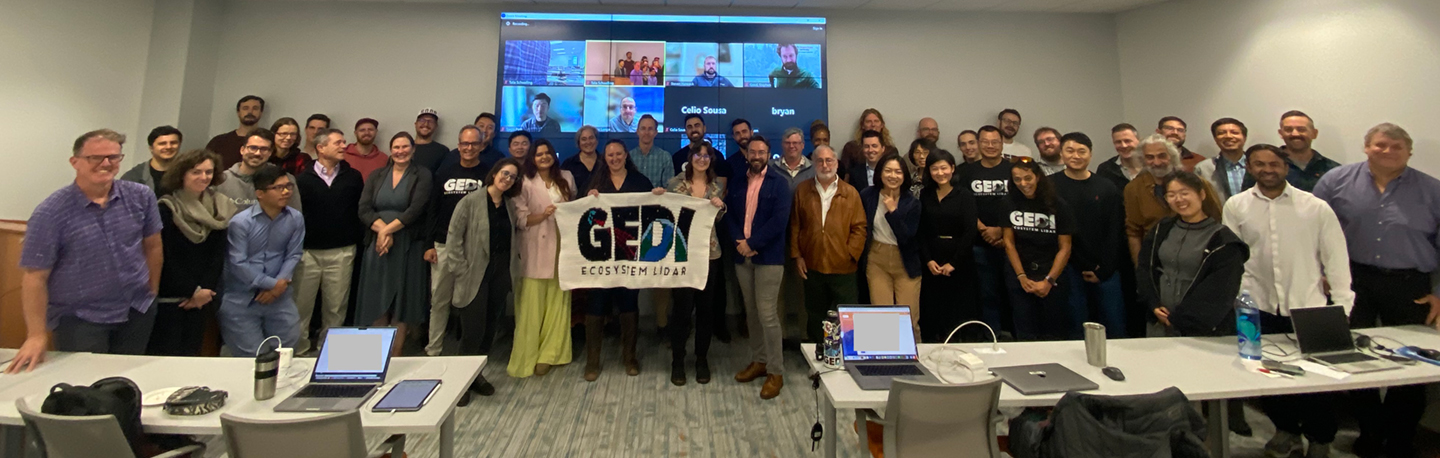
The 2023 Global Ecosystem Dynamics Investigation (GEDI) Science Team Meeting (STM) took place October 17–19, 2023, at the University of Maryland, College Park (UMD), in College Park, MD. Upwards of 80 people participated in the hybrid meeting (around 50 in-person and the rest virtually). Included among them were GEDI Science Team (ST) members, collaborators, and stakeholders – see Photo. The primary goals of the meeting included providing a status update on the GEDI instrument aboard the International Space Station (ISS), receiving final project updates from the inaugural cohort of the GEDI completed ST, and understanding the present status and future goals of data product development.
After a short mission status update, the remainder of this article will summarize the content of the STM. For those desiring more information on these topics, some of the full meeting presentations are posted online. Readers can also contact the GEDI ST with specific questions.
Mission Status Update: GEDI Given New Lease on Life
A lot has changed since the publication of the last GEDI STM summary. (See Summary of the GEDI Science Team Meeting in the July–August 2022 issue of The Earth Observer [Volume 34, issue 4, pp. 20–24]). When the GEDI ST convened in November 2022, the fate of GEDI was hanging in the balance, with the plan being to release GEDI from the ISS at the end of its second extension period.
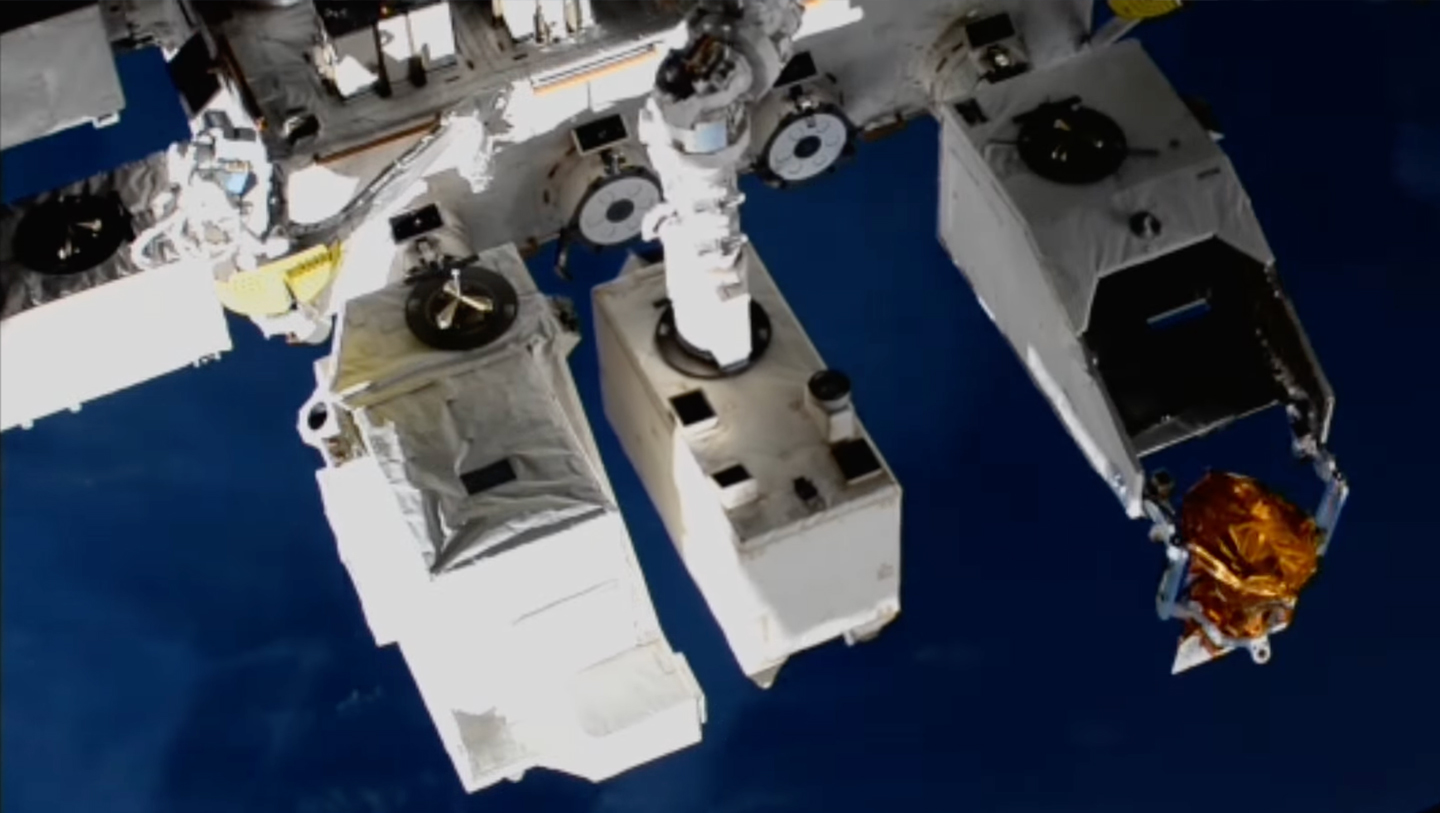
NASA saved the instrument, however, and a new plan went into effect: in order to extend its tenure on the ISS, the GEDI mission entered a temporary period of “hibernation” in March 2023 after nearly four years in orbit. This hibernation period and movement of the instrument from Exposed Facility Unit (EFU)-6 (operating location) to EFU-7 (storage location) made way for another mission – see Figure 1. (UPDATE: After being in storage for roughly 13 months, the GEDI instrument was returned to its original location on the Japanese Experiment Module–Exposed Facility (JEM–EF) on Earth Day this year, April 22, 2024, and is now once again back to normal science operations using its three lasers.)
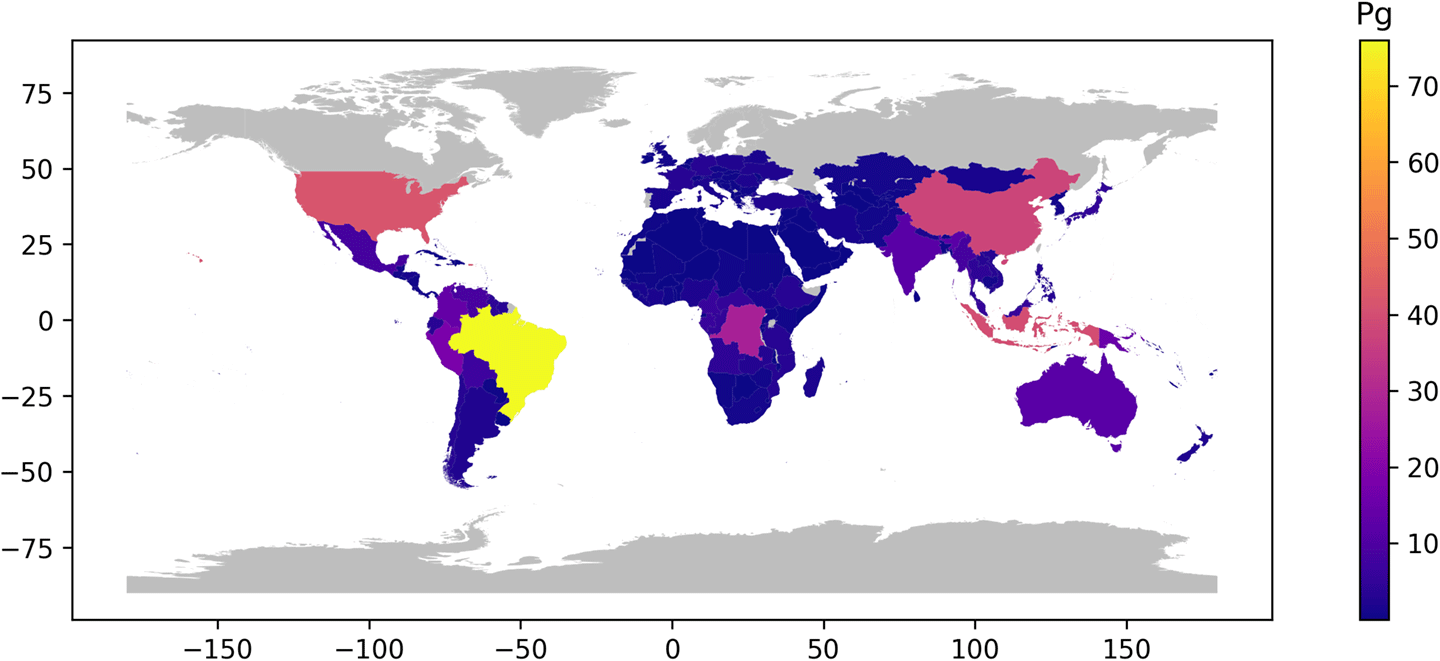
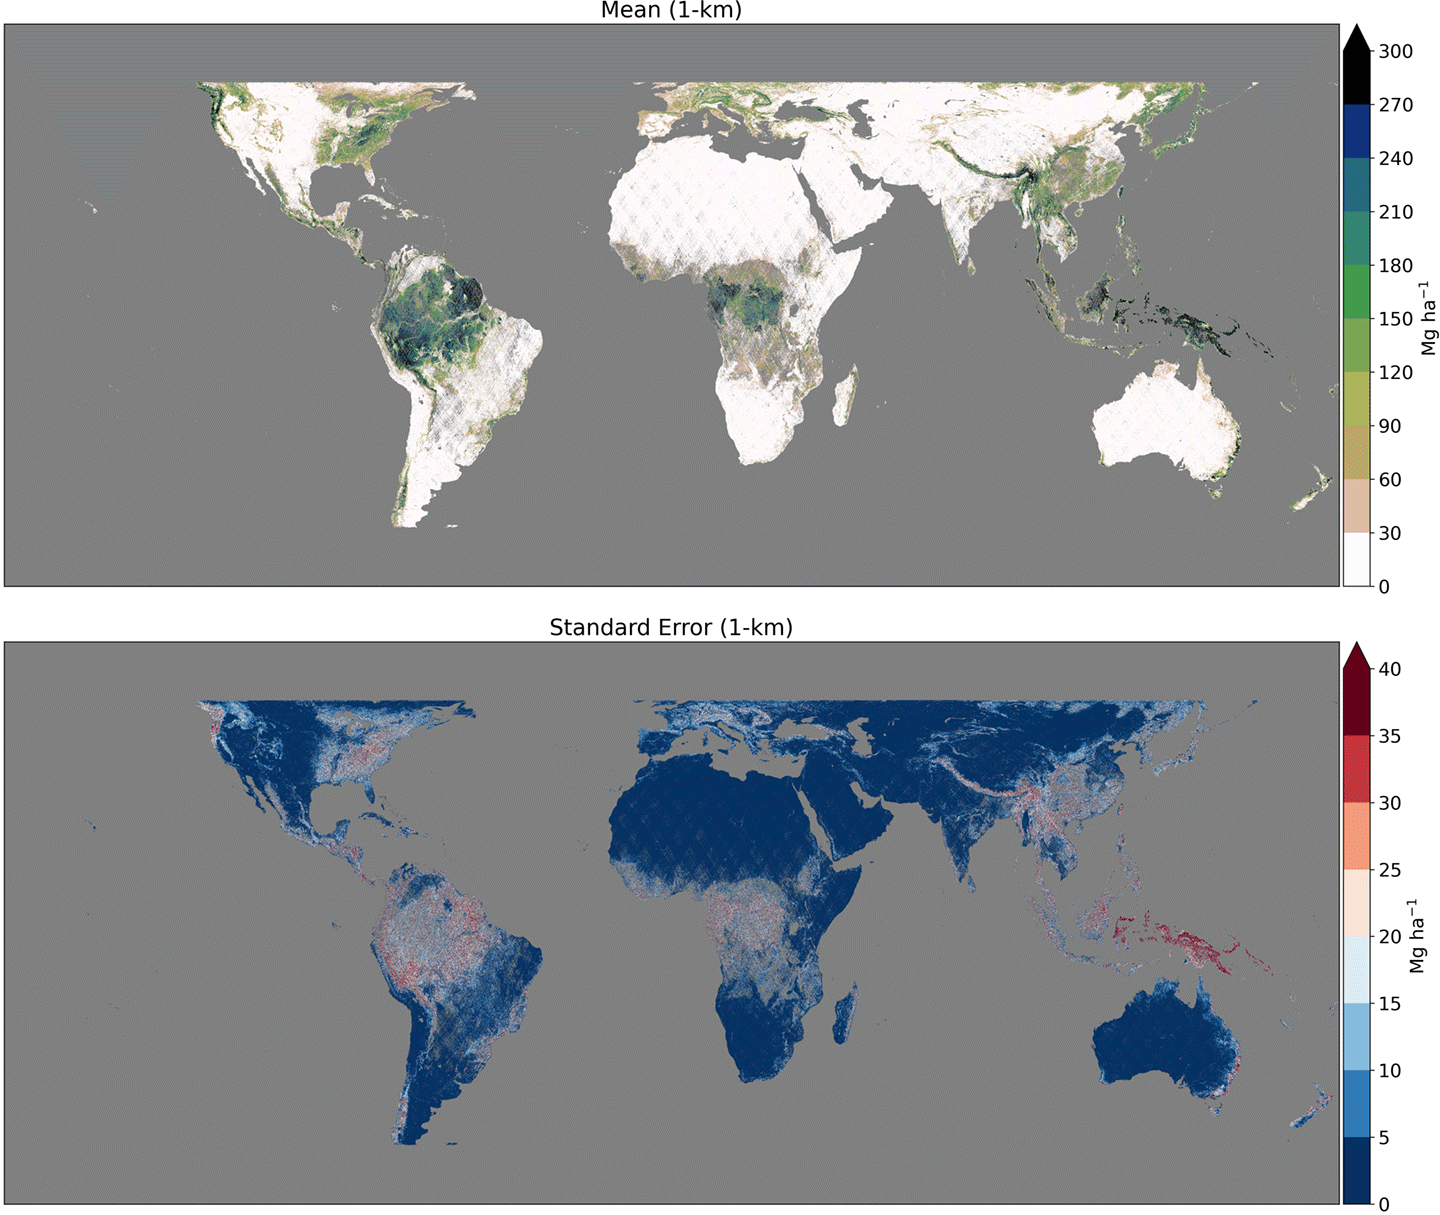
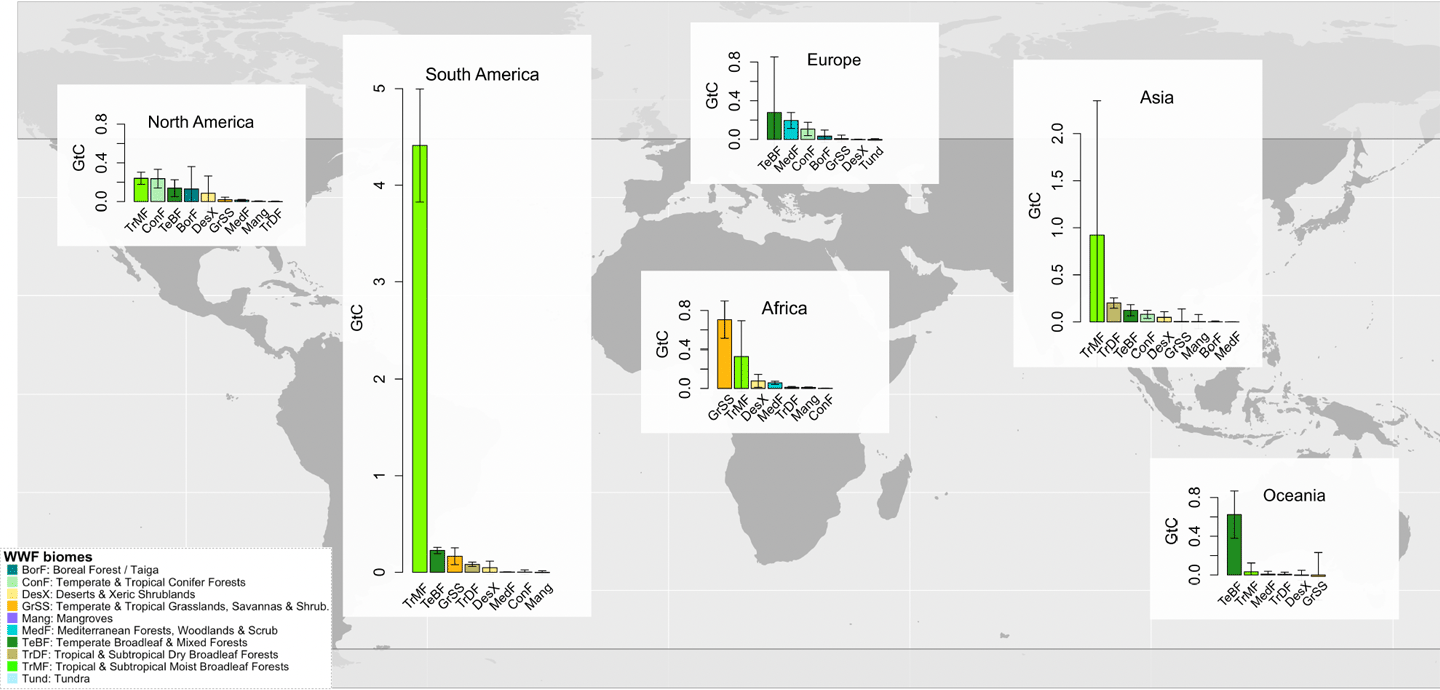
As The Earth Observer reported in 2023, data from GEDI are being used for a wide range of applications, including biomass estimation, habitat characterization, and wildfire prediction (See page 4 of The Editor’s Corner in the March–April 2023 issue of The Earth Observer [Volume 35,Issue 2, pp. 1–4]. This section also reports on GEDI’s extension via out-of-cycle Senior Review in 2022). GEDI data is used to develop maps to quantify biomass that are unique in both their accuracy and their explicit characterization of uncertainty and are a key component in the estimation of aboveground carbon stocks, as absorbed carbon is used to drive plant growth and is stored as biomass – see Figure 2. These estimations help quantify the impacts of deforestation and subsequent regrowth on atmospheric carbon dioxide (CO2) concentration. NASA’s choice to extend the GEDI mission has significantly broadened the capacity to collect more of these important data.
DAY ONE
GEDI Mission Operations, Instrument Status, and Data Level Updates
Ralph Dubayah [UMD—GEDI Principal Investigator (PI)] opened the meeting with a summary of the current status of the mission and GEDI data products. After reviewing the details of GEDI’s hibernation (described in the previous section) he went on to describe what GEDI has accomplished over the past 4.5 years of operations, noting that the instrument collected over 26 billion footprints over the land surface.
All the data collected by GEDI during its first epoch (i.e., before its hibernation) have been processed and released to the appropriate Distributed Active Archives Centers (DAACs) as Version 2 (V2) products. (To learn more about the DAACs and other aspects of Earth Science data collection and processing, see Earth Science Data Operations: Acquiring, Distributing, and Delivering NASA Data for the Benefit of Society, in the March–April 2017 issue of The Earth Observer, [Volume 29, Issue 2, pp. 4–18]. The DAACs – including URL links to each – are listed in a Table on page 7–8 of this issue). The two DAACs directly involved with GEDI data processing are the Land Processes DAAC (LP DAAC) and Oak Ridge National Laboratory (ORNL) DAAC. The LP DAAC houses GEDI Level-1 (L1) data, which consists of geolocated waveforms, and L2 data, which is broken down into L2A and L2B. L2A data includes ground elevation, canopy height, and relative height metrics. (Waveform measurements are described in detail in a sidebar on page 32 of the Summary of the Second GEDI Science Team Meeting in the November–December 2016 issue of The Earth Observer [Volume 28, Issue 6, pp. 31–36].) L2B data includes canopy cover fraction (CCF) and leaf area index (LAI). The ORNL DAAC houses GEDI L3 gridded land surface metrics data, L4A footprint level aboveground biomass density data, and L4B gridded aboveground biomass density data – e.g., see Figure 2.
Dubayah went on to explain that while GEDI hibernated, the mission team would work to enhance existing data products as well as produce new products. Version 3 (V3) datasets for all data products are expected to be released by the fall of 2024, and new data products are in development, including a waveform structural complexity index (WSCI) and a topography and canopy height product that blends data from GEDI and the Ice, Clouds, and land Elevation Satellite–2 (ICESat–2) mission. A new dataset, the GEDI L4C footprint level waveform structural complexity index (WSCI) product, was added to the ORNL DAAC catalogue in May 2024. To further improve data quality and coverage, the GEDI team is hoping to organize an airborne lidar field campaign to southeast Asia in the coming years. Dubayah concluded his updates by highlighting a set of six papers published in 2023 in Nature and Science family or partner journals that focused on the use of GEDI data. Visit our website for a comprehensive list of publications related to GEDI.
After receiving a general update from the mission PI, the next several presentations gave meeting participants a more in-depth look at GEDI science data planning and individual data products. Scott Luthcke [NASA’s Goddard Space Flight Center (GSFC)—GEDI Co-Investigator (Co-I)] presented status updates for the GEDI Science Operating Center (SOC), including the Science Planning System (SPS) and Science Data Processing System (SDPS) automation, development, and processing. In addition, he reported on the status of the L1 geolocated waveform data product and the L3 gridded land surface metrics product. At the time of this meeting, the SPS had completed operations through mission week 223 – almost 4.5 years of data – and was beginning to transition to improving processes on the back end while GEDI hibernates. The SDPS had completed processing and delivery of all V2 data products to the LP DAAC and ORNL DAAC.
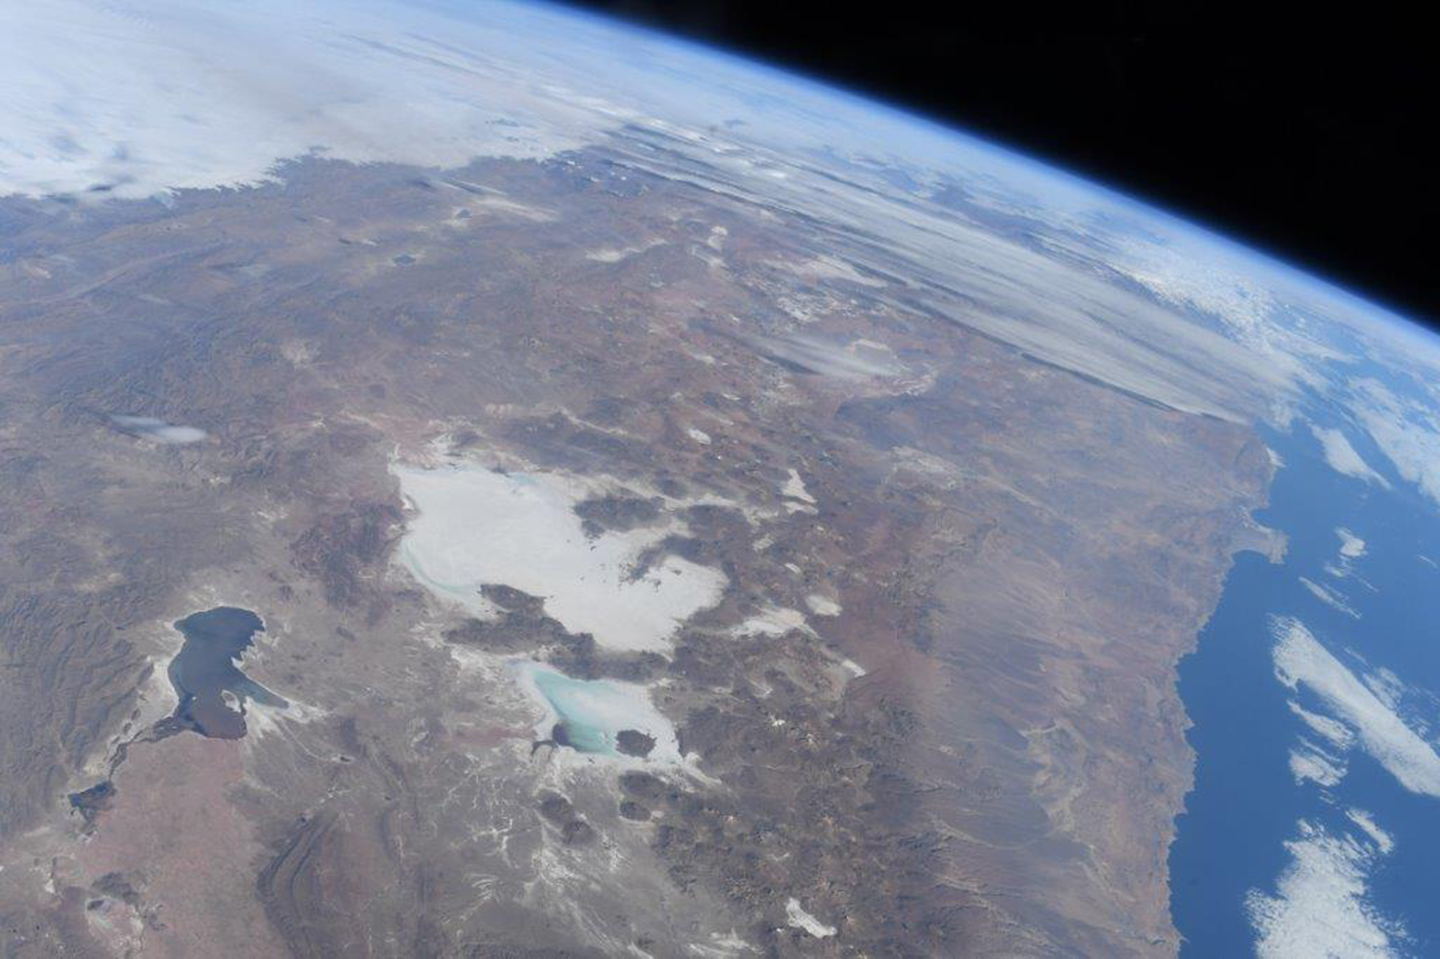
Luthcke reported on GEDI’s current observed and estimated geolocation performance, including detailed summaries of component analysis and steps towards improving Precision Orbit Determination (POD), Precision Attitude Determination (PAD), Pointing Calibration, time-tag correction, and Oven Controlled Crystal Oscillator (OCXO) calibration. GEDI passes over Salar de Uyuni, the world’s largest salt flat located in Bolivia – see Figure 3, are being used to assess the PAD high-frequency and low-frequency errors. Estimated errors are shown to be consistent with observed geolocation errors. Finally, Luthcke gave a summary of completed L3 products and new wall-to-wall 1-km (0.62-mi) resolution and high-resolution products.
John Armston [UMD—GEDI Co-I] updated attendees on GEDI L2 products. L2A consists of elevation and height metrics, and L2B consists of canopy cover and vertical profile metrics. To assess GEDI ground and canopy top measurement accuracy and improve algorithm performance, the mission team is using data collected from NASA Land, Vegetation, and Ice Sensor (LVIS) campaigns from 2016 to present. Armston reported that L2B estimates of canopy and ground reflectance were completed for the first mission epoch (April 2019–March 2023) and the GEDI team continues to work on algorithm improvements for cover estimates in challenging conditions (e.g., steep slopes). Data users can expect improved waveform processing for ground elevation and canopy height, new reflectance estimation, and revised quality metrics and flags in the L2A and L2B not-yet-released V3 products.
Jim Kellner [Brown University—GEDI Co-I] shared the current status of and planned algorithm improvements to the L4A data product, or the footprint-level aboveground biomass density product. The algorithm theoretical basis document for L4A data products was published in November 2022; it describes how models were developed and the importance of quality filtering. L4A data product development continues in tandem with updates to L2A data and improvements to existing calibration and validation data and ingestion of new data.
Sean Healey [U.S. Forest Service—GEDI Co-I] reviewed coverage and uncertainties of the recently produced V2 L4B data products – see Figure 4. Ongoing GEDI-relevant research includes:
- investigating a statistical method called bootstrapping, which may allow more complex types of models;
- conducting theoretical statistical studies aimed at decomposing mean square error for model-based methods; and
- developing ways to estimate biomass change over time – which will become more important as the extended mission potentially stretches to a decade.
Competed Science Team Presentations—Session 1
This GEDI STM was the last convergence of the first iteration of the GEDI competed ST. Attendees received final in-person updates on the cohort’s projects and plans for future research. Over the course of the three-day meeting, there were several sections dedicated to Competed ST Presentations. For purposes of organization in this report, each section has been given a session number.
Taejin Park [NASA’s Ames Research Center (ARC) and Bay Area Environmental Research Institute (BAERI)] kicked off the ST presentations with an overview of his group’s progress in enhancing the predictions of forest height and aboveground biomass by incorporating GEDI L2, L3, and L4 data products into a process-based model, called Allometric Scaling Resource Limitation (ASRL), over the contiguous United States (CONUS). The ASRL model effectively captures large-scale, maximum tree size distribution and facilitates prognostic applications for predicting future aboveground biomass changes under various climate scenarios. Park also described collaborative research efforts with international partners to map changes in aboveground biomass in tropical and temperate forests using a carbon management systems (CMS).
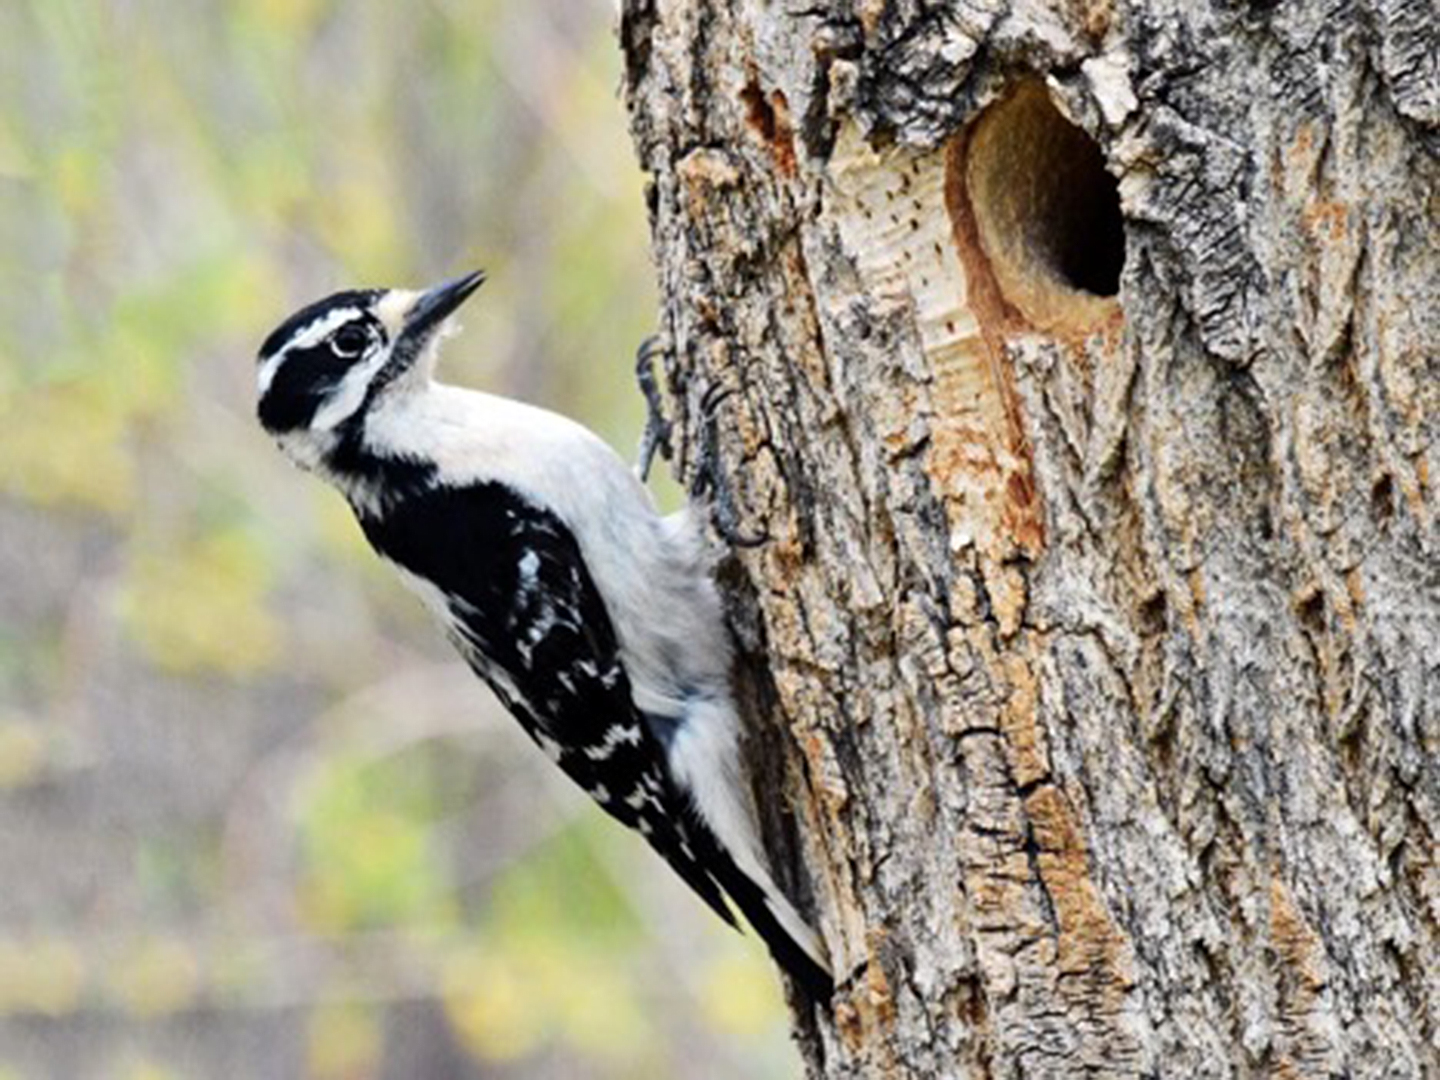
Kerri Vierling [University of Idaho] shared the results from her team’s projects demonstrating the use of GEDI data fusion products to describe patterns of bird and mammal distributions in western U.S. forests. The focal species for these projects include a suite of vertebrate forest carnivores, prey, and ecosystem engineer species that modify their environments in ways that create habitat for other creatures, e.g., woodpeckers – see Figure 5. Many of these species are of interest for management by a variety of state and federal agencies. Vierling also discussed ongoing analyses identifying biodiversity hotspots and land ownership patterns.
Sean Healey presented on his competed ST research on Online Biomass Inference using Waveforms and iNventory (OBI-WAN), a Google Earth Engine application. This forest-carbon reporting tool harnesses GEDI waveforms, biomass models, and statistics to make estimates of mean biomass and biomass change for areas specified by online users. Healey explained the statistical methods applied to operate OBI-WAN and gave context for the use of sensor fusion to provide biomass change information that is critical for monitoring, reporting, and verification.
Keith Krause [Battelle] presented his work evaluating vertical structural similarity of LVIS classic and GEDI large-footprint waveforms. At the GEDI and LVIS footprint scale (20–23 m, or 65–75 ft, spot on the ground), lidar waveforms over forests represent canopies of leaves and branches from several trees. Krause presented results comparing waveforms against each other to show similarities in shape (i.e., if the trees in their footprints have a similar vertical structure). He also described how he used data clustering techniques to group similar waveforms into distinct structural classes. From there, he could map waveforms with similar vertical structure to better understand the spatial distribution of the structural groups.
Breakout Sessions—Session 1
GEDI STMs offer a rare opportunity for members of the competed and mission STs, a variety of stakeholders, and other individuals to convene and discuss ideas and goals for their own research and for the GEDI mission. Toward that end, breakout sessions were held on the first and second day of the meeting – referred to as Session 1 and Session 2 in this report. The individual breakout meetings used a hybrid format allowing in-person and online participants to join the discussion that was most relevant to their interests and expertise.
Chris Hakkenberg [Northern Arizona University (NAU)] led a breakout session on structural diversity, including the horizontal and vertical components. Different structural attributes, (e.g., stand structure, height, cover, and vegetation density) have different – but related – metrics and measurement approaches. Participants discussed biodiversity-structure relationships (BSRs), how to better characterize horizontal structural diversity, and how to define which metrics (i.e., scale, sampling unit, and spatial resolution) are most meaningful in different situations.
Jim Kellner led a session that focused on biomass calibration and validation and how to create the best data products given global environmental variation. Special cases – e.g., mangroves – pose challenges for calibration and validation because they don’t always have as much plot-level data as other environments. Participants discussed how to determine strata while considering climactic and environmental covariates as well as constraints of data availability and consistency.
Competed Science Team Presentations—Session 2
The FORest Carbon Estimation (FORCE) Project is exploring the use of GEDI-derived canopy structure metrics to map forest biomass in the U.S. and Canada. Daniel Hayes [University of Maine] presented comparisons of GEDI metrics and canopy height models derived from airborne lidar and photo point clouds over different forest types and disturbance history in managed forests of Maine. Co-PI Andy Finley [Michigan State University] presented new work that adjusts GEDI L4B biomass estimates to plot data over the continental U.S. from Forest Inventory and Analysis (FIA) program of the U.S. Department of Agriculture’s Forest Research and Development Branch. The project’s next steps are to fuse GEDI canopy structure metrics with other covariates in a spatial model to produce wall-to-wall estimates of biomass for boreal–temperate transition forests in northeast North America.
GEDI data is also being used to study tropical forests. Chris Doughty [NAU] described how he and his team analyzed GEDI L2A data across all tropical forests and found that tropical forest structure was less stratified and more exposed to sunlight than previously thought. Most tropical forests (80% of the Amazon and 70% of southeast Asia and the Congo Basin) have a peak in the number of leaves at 15 m (49 ft) instead of at the canopy top. Doughty and his team have found that deviation from more ideal conditions (i.e., lower fertility or higher temperatures) lead to shorter, less-stratified tropical forests with lower biomass.
Paul Moorcroft [Harvard University] reported on studies of current and future carbon dynamics across the Pacific Coast region based on forest structure and rates of carbon uptake. Moorcroft's group examined how these ecosystems will behave in the future under different climate scenarios and have plans to conduct similar studies in other regions.
DAY TWO
Naikoa Aguilar-Amuchastegui [World Bank] kicked off day two with his perspective on the importance of streamlining the monitoring, reporting, and validation (MRV) process from scientific estimation to actual use of the data. Once scientific data is generated, end users are often faced with challenges related to transparency and understandability. Scientists can better communicate how to use their datasets properly, by familiarizing themselves with who wants to use their data, why they want to use it, and what their needs are. With this information in mind, data can be presented in more practical ways that allow for a variety of institutions with different standards and frameworks to integrate GEDI data more easily into their reporting. As the GEDI team continues to produce high-quality maps, efforts are underway to connect with end users and provide tutorials, workshops, and other resources.
GEDI Demonstrative Products
Demonstrative products show how GEDI data can be used in practice and in combination with other resources. Ecosystem modeling is one way that GEDI data are being used to address questions about aboveground carbon balance, future atmospheric CO2 concentrations, and habitat quality and biodiversity. George Hurtt [UMD—GEDI Co-I] shared his progress on integrating GEDI canopy height measurements with the Ecosystem Demography model to estimate current global forest carbon stocks and project future sequestration gaps under climate change – see Figure 6. Hurtt emphasized that this unprecedented volume of lidar data significantly enhances the ability of carbon models to capture spatial heterogeneity of forest carbon dynamics at 1 km (0.6 mi) scale, which is crucial for local policymaking regarding climate mitigation.
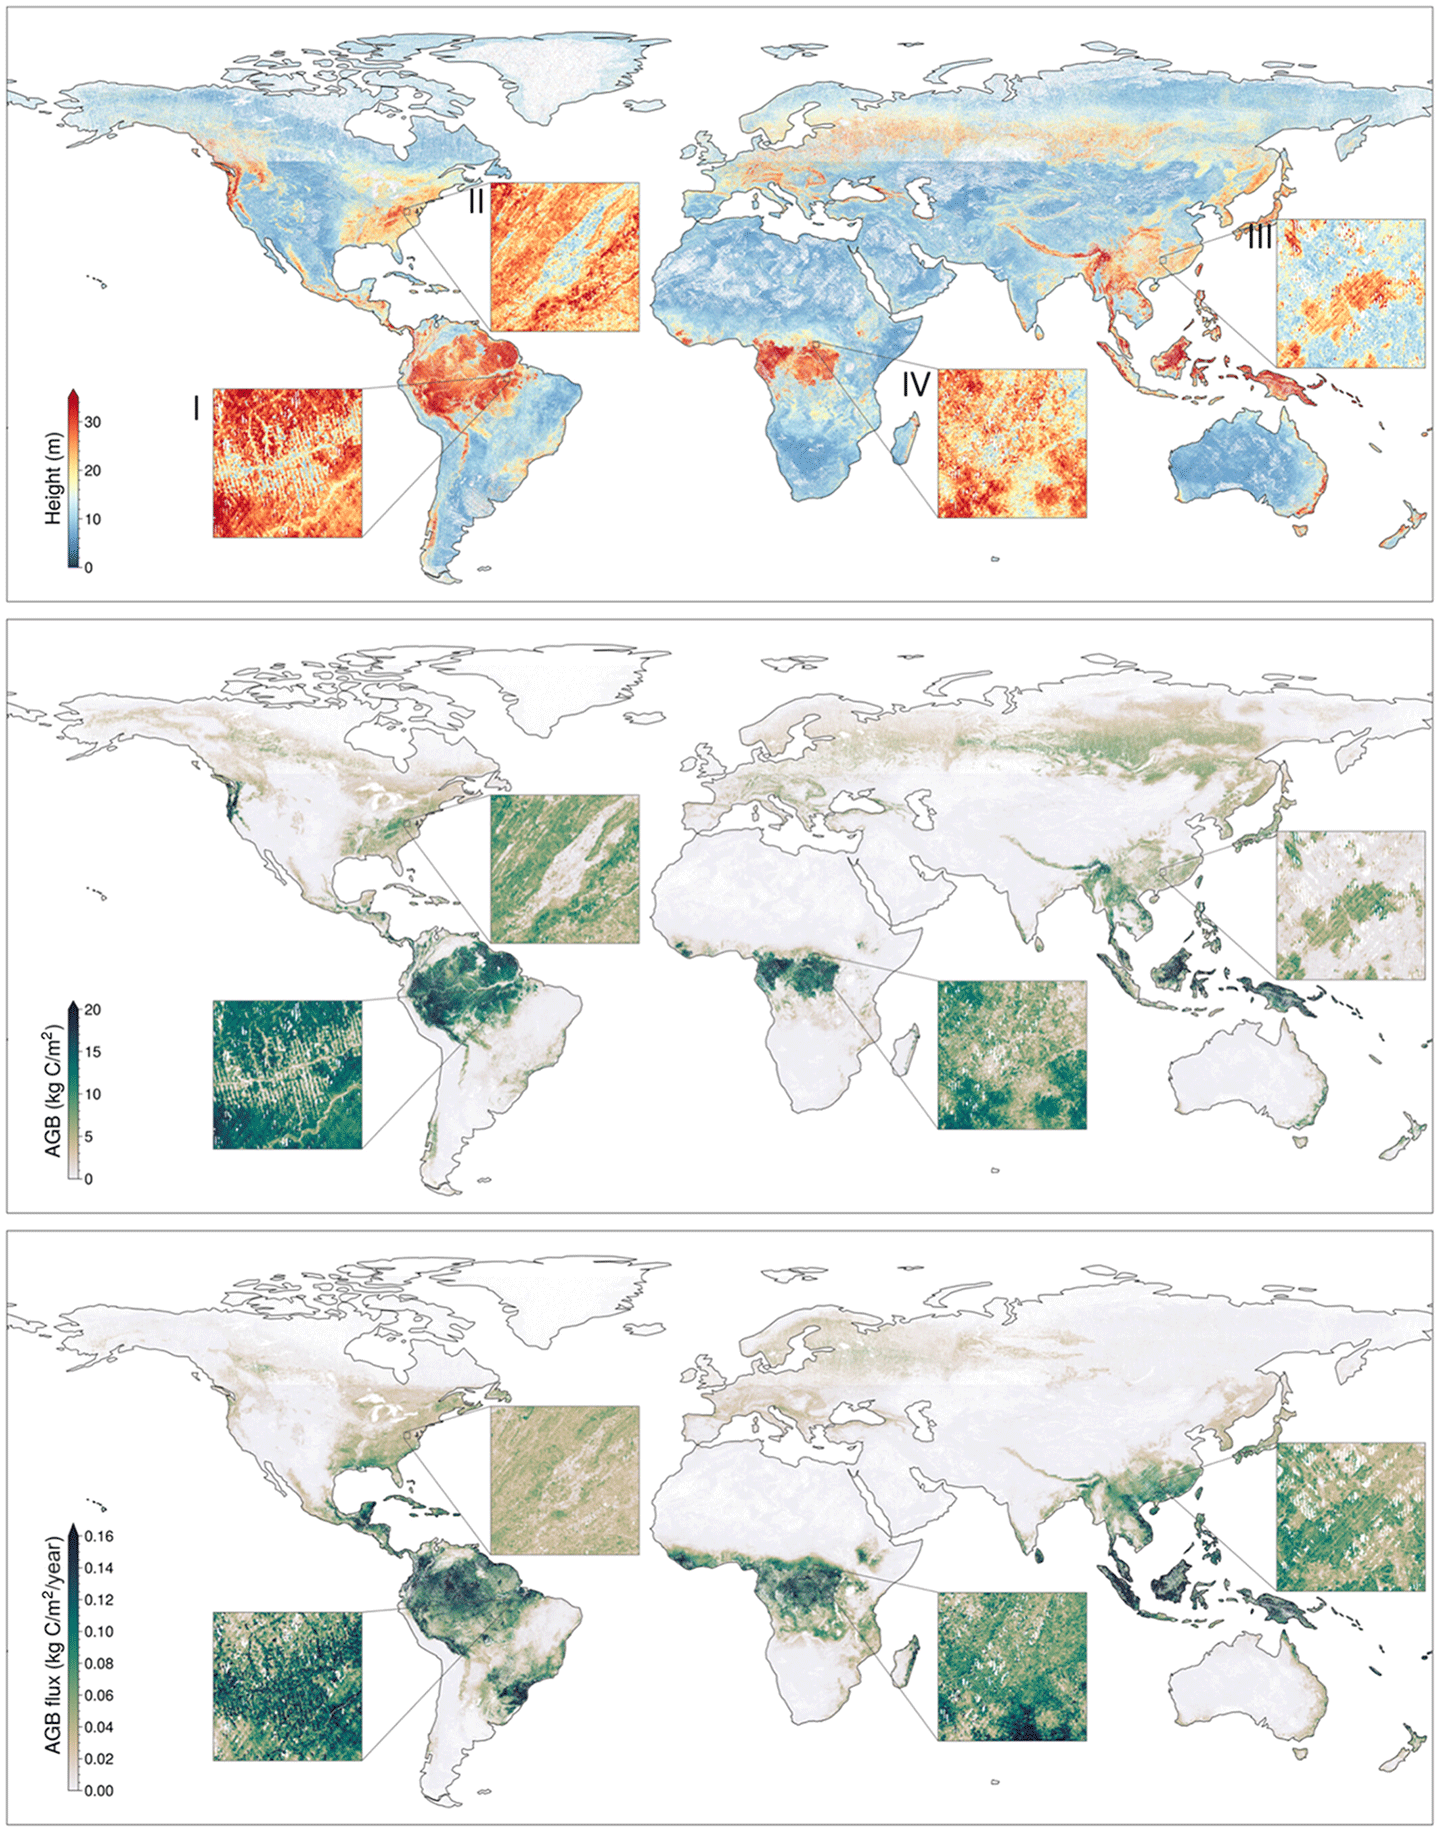
There is also great potential for the development and application of methods for mapping forest structure, carbon stocks, and their changes by fusing data from GEDI and the Deutsches Zentrum für Luft- und Raumfahrt’s (DLR) [German Space Operations Center] TerraSAR-X Add-oN for Digital Elevation Measurement (TanDEM-X) satellite mission, which uses synthetic aperture radar (SAR) to gather three-dimensional (3D) images of Earth’s surface. This fusion product is being spearheaded by Wenlu Qi [UMD], who presented on efforts to create maps of pantropical canopy height, biomass, forest structure, and biomass change using the fusion product as well as maps of forests in temperate U.S. and Hawaii.
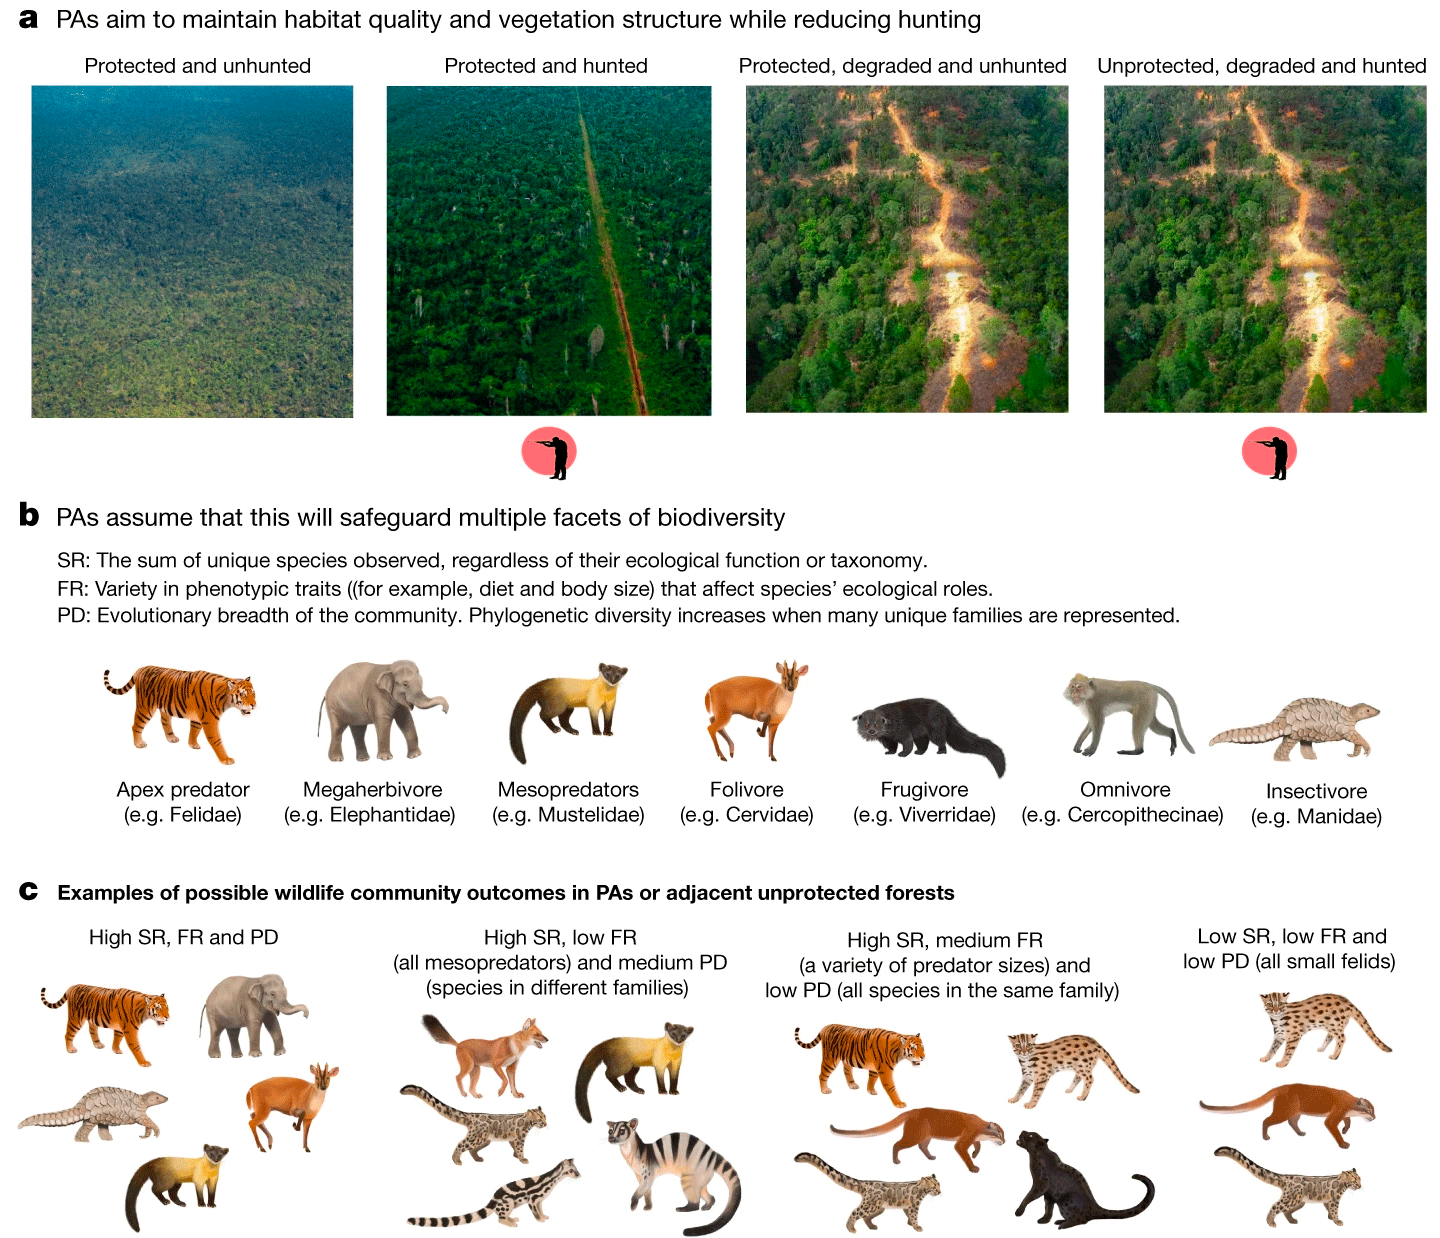
Data from the GEDI mission are also being used to quantify the spatial and temporal distribution of habitat structure, which influences habitat quality and biodiversity. Scott Goetz [NAU—GEDI Deputy PI] presented on biodiversity-related activities, citing a 2023 paper in Nature that examined the effectiveness of protected areas (PAs) across southeast Asia using GEDI data to compare canopy structure within and outside of PAs – see Figure 7. He also presented an analysis of tree and plant diversity across U.S. National Ecological Observation Network (NEON) sites that showed similar capabilities of GEDI with airborne laser scanning (ALS) for tree diversity.
Competed Science Team Presentations—Session 3
One unique application of GEDI data is using lidar height to improve radiative transfer models for snow processes. Steven Hancock [University of Edinburgh, Scotland] reported on his group’s work studying snow, forest structure, and heterogeneity in forests, explaining that the majority of land surface models used for climate and weather forecasting use one-dimensional (1D) radiative transfer (RT) models driven by leaf area alone. Heterogeneous forests cast shadows and cause the surface albedo to depend upon sun angle and tree height for moderate leaf area indices (LAI), i.e., LAI values from 1-3 – which are common in snow-affected areas. This complexity cannot be represented in 1D models. An RT model can represent the effect of tree height and horizontal heterogeneity to simulate the observed change in albedo with height, which itself spatially varies.
In contrast to a snowy study area, Ovidiu Csillik [NASA/Jet Propulsion Laboratory] and his team are developing statistical models to link GEDI relative height metrics to tropical forest characteristics traceable to inventory measurements. This dataset of forest structure variables over the Amazon will be used to initialize a demographic ecosystem model to produce projections of future potential tropical forest carbon, as demonstrated by Amazon-wide simulations using initializations from airborne lidar sampling.
Wenge Ni-Meister [Hunter College of the City University of New York] is working on improving aboveground biomass estimates using GEDI waveform measurements. Ni-Meister and her team are testing models in both domestic and international tropical and temperate forests.
Breakout Sessions—Session 2
Two more breakout sessions occurred on day two:
Sean Healey led a discussion on modes of inference for GEDI data. Inference – formally derived uncertainty for area estimates of biomass, height, or other metrics – can take different forms, each of which includes specific assumptions. In this breakout session, participants considered the strengths and limitations of different inference types (e.g., intensity of computation or the ability to use different models).
Laura Duncanson [UMD—GEDI Co-I] led a discussion about facilitation of open science, in other words, how to make GEDI data more accessible and digestible for data users. While GEDI data area free and publicly available via the LP DAAC and ORNL DAAC, gaining access to said data can be intimidating. Sharing more about existing resources and creating new ones can help remove barriers. The LP DAAC and ORNL DAAC have excellent tutorials on GitHub (a cloud-based software development platform that is primarily Python-based), and Google Earth Engine applications are available for accessing and visualizing GEDI data. Future endeavors may include more webinars, R-based tutorials, workshops, and trainings on specific topics and ways to use GEDI data. More information is available via an online compilation of GEDI-related tutorials.
Perspective: A NUVIEW of Earth’s Land Surface
For the second perspective presentation of day two, meeting attendees heard from Clint Graumann, CEO and co-founder of NUVIEW, a company whose mission is to build a commercial satellite constellation of lidar-imaging satellites that will produce 3D maps of the Earth’s entire land surface. Graumann shared NUVIEW’s intent to produce land surface maps on an annual basis and provide a variety of products and services, including digital surface models (DSMs), digital terrain models (DTMs), and a point cloud generated by laser pulses.
Competed Science Team Presentations—Session 4
Laura Duncanson began the second round of science presentations with her group’s research on global forest carbon hotspots. She discussed her 2023 paper in Nature Communications on the effectiveness of global PAs for climate change mitigation – see Figure 8, which found that the creation of PAs led to more biomass – especially in the Amazon. Within GEDI-domain terrestrial PAs, total aboveground biomass (AGB) storage was found to be 125 Pg, which is around 26% of global estimated AGB. Without the existence of PAs, 19.7 Gt of the 125 Pg would have likely been lost.
Another unique application of GEDI data has to do with water on the Earth’s surface. Kyungtae Lee [UMD], who works with Michelle Hofton [UMD—GEDI Co-I], reported that GEDI appears to capture the monthly annual cycle of lake elevation, showing good correlation with the ground-based observations. Lee explained that even though the GEDI lake elevation estimates show systematic biases relative to the local gauges, GEDI captures lake elevation dynamics well – especially the annual cycle variations. This work has the potential to expand knowledge of hydrological significance of lakes, particularly in data-limited areas of the world. Stephen Good [Oregon State University] presented a survey of his team’s recent work integrating observations from GEDI into hydrology and hydraulics studies of how vegetation can block and intercept moving water. The team found important nonlinear relationships between inferred canopy storage and canopy biomass and were able to estimate canopy water storage capacities and map these globally.
Finally, Patrick Burns [NAU], who works with Scott Goetz, presented results using GEDI canopy structure metrics in mammal species distribution models across southeast Asia (specifically focusing on Borneo and Sumatra). The team’s early results indicate that GEDI canopy structure metrics are important in many mammal distribution models and improve model performance for another smaller subset of species. In other words, when looking at predictors like mean annual precipitation or forest structure (forest structure being a metric that GEDI data provide), the GEDI-derived structure metrics are more intuitive and help us understand distributional changes and fine-scale habitat suitability. In a region like southeast Asia, for example, which has undergone high rates of deforestation in the recent decades, forest structure may be a more relevant predictor in a species distribution model (SDM) than other metrics like climate or vegetation composition. The team will continue to produce models for additional species and expand the extent of the analysis to include mainland Asia.
DAY THREE
Competed Science Team Presentations—Session 5
Day three began with the meeting’s last round of competed ST presentations. John Armston presented the progress of GEDI L2B Plant Area Volume Density (PAVD) product validation using a global Terrestrial Laser Scanning (TLS) database and fusion of the L2B product with Landsat time-series for quantifying change in canopy structure from the Australian wildfires of 2019–2020. Participants then heard from Jim Kellner on using machine-learning algorithms for L4A aboveground biomass density (AGBD). The performance of machine-learning algorithms on a testing data set was comparable to linear regressions used for the first releases of GEDI AGBD data products on average – although there were important geographical differences associated with machine learning. One application under investigation is using machine learning to identify new potential stratifications for GEDI footprint aboveground biomass density.
Lastly, Jingyu Dai [New Mexico State University (NMSU)], who works with Niall Hanan [NMSU], presented on her analysis of the global limits to tree height. Her study shows that hydraulic limitation is the most important constraint on maximum canopy height globally. This result is mediated by plant functional type. In addition, rougher terrain promotes forest height at sub-landscape scales by enriching local niche diversity and probability of larger trees.
Perspective from the Data Side
As described in the summary of Ralph Dubayah’s introductory remarks, the LP DAAC and ORNL DAAC play essential roles in the dissemination of GEDI data and the success of the GEDI program. Representatives from each of these DAACs addressed the ST to summarize recent GEDI-related activities.
Aaron Friesz [United States Geological Survey (USGS)] represented the LP DAAC and gave an update on the current archive size, distribution metrics, and outreach activities. He also discussed plans to support the growth and sustainability of the community through collaboration activities that will leverage the GitHub application; he described some of the resources that are available. Friesz then highlighted the USGS Eyes on Earth podcast and the Institute of Electrical and Electronics Engineers (IEEE) Geoscience and Remote Sensing Society (GRSS)’s Down to Earth podcast, which have featured Ralph Dubayah and Laura Duncanson, and shared plans to update the current GitHub tutorials and how-to guides in the Earthdata Cloud of GEDI V2 and V3.
Rupesh Shrestha [ORNL] represented the ORNL DAAC and shared the status of GEDI L3, L4A, and L4B datasets archived there. He gave an overview of data tools and services for the GEDI datasets, which can be found on the GEDI website and GitHub tutorials website. GEDI L3, L4A, and L4B are available on NASA’s Earthdata Cloud and various enterprise-level services, such as NASA’s WorldView, Harmony, and OpenDAP. GEDI data usage metrics, data tutorials and workshops, and outreach activities, as well as other published community and related datasets were also highlighted. GEDI L3, L4A, and L4B have been downloaded over four million times collectively.
Neha Hunka [UMD] gave the final presentation of the meeting on biomass harmonization activities. She reported that the GEDI estimates of aboveground biomass are capable of directly contributing to the United Nations Framework Convention on Climate Change Global Stocktake. Hunka and her colleagues’ research is aimed at bridging the science–policy gap to enable the use of space-based aboveground biomass estimates for policy reporting and impact – see Figure 9.
Conclusion
Overall, the 2023 GEDI STM showcased an exceptional array of scientific research that is highly relevant to addressing pressing global challenges and answering key questions about global forest structure, carbon balance, habitat quality, and biodiversity among other topics. As the GEDI instrument enters its second epoch, we are excited to welcome a new competed GEDI science team cohort and look forward to the release of V3 data products later this year.
Ralph Dubayah concluded the STM with a summary of hibernation period goals and a farewell to this iteration of the competed ST. He extended a heartfelt thank you and farewell to Hank Margolis [NASA Headquarters, emeritus] who has been the NASA Program Scientist for the GEDI mission since 2015. Thank you, Hank. We will miss you.
Talia Schwelling
University of Maryland, College Park
tschwell@umd.edu