


Introduction
Observations of the Sun and Earth from space continue to revolutionize our view and understanding of how solar variability and other natural and anthropogenic forcings impact Earth’s atmosphere and climate. For more than four decades (spanning four 11-year solar cycles and now well into a fifth), the total and spectral solar irradiance and global terrestrial atmosphere and surface have been observed continuously, providing an unprecedented, high-quality time series of data for Sun–climate studies, such as the Total Solar Irradiance (TSI) composite record – see Figure 1.

Sun–Climate Symposia, originally called SOlar Radiation and Climate Experiment (SORCE) Science Team Meetings, have been held at a regular cadence since 1999 – before the launch of SORCE in 2003. These meetings provide an opportunity for experts from across the solar, Earth atmosphere, climate change, stellar, and planetary communities to present and discuss their research results about solar variability, climate influences and the Earth-climate system, solar and stellar variability comparative studies, and stellar impacts on exoplanets.
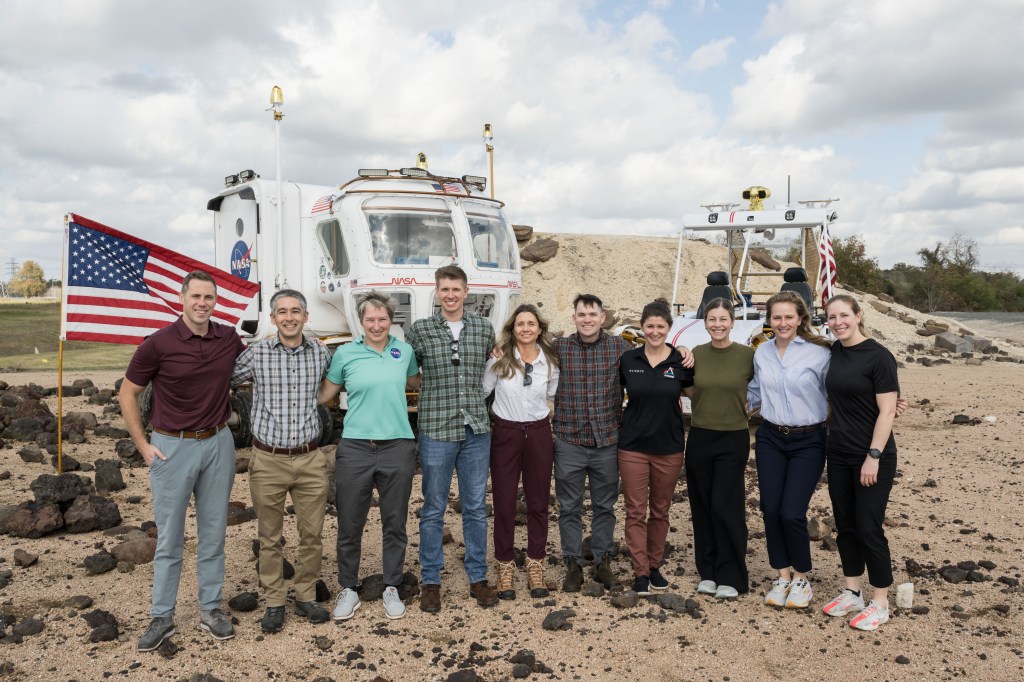
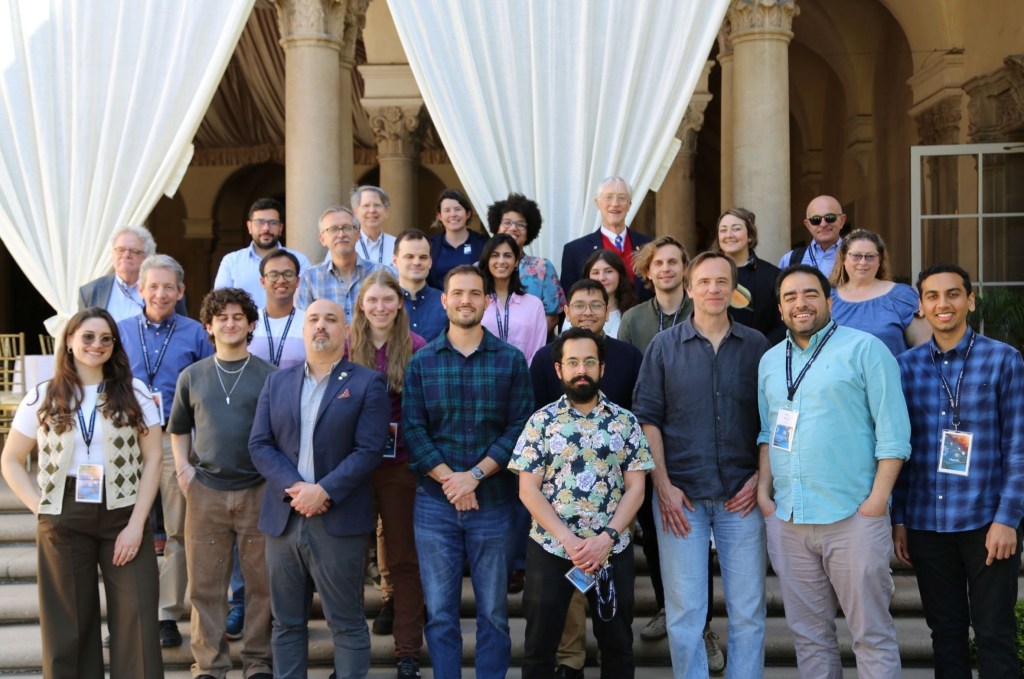
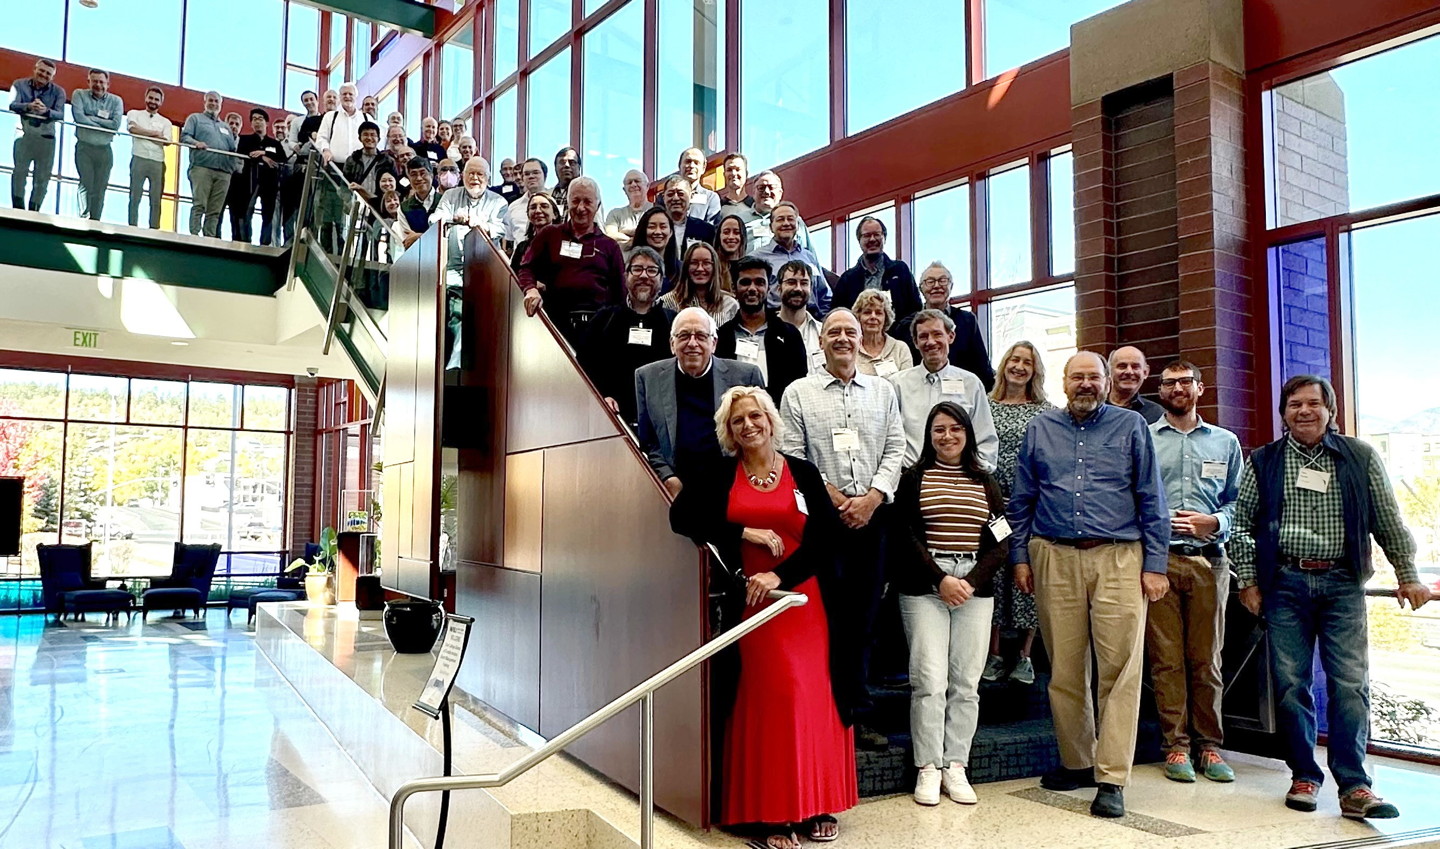
The latest iteration was the eighteenth in the series and occurred in October 2023. (As an example of a previous symposium, see Summary of the 2022 Sun–Climate Symposium, in the January–February 2023 issue of The Earth Observer [Volume 35, Issue 1, pp. 18–27]). The 2023 Sun–Climate Symposium took place October 17–20 in Flagstaff, AZ – with a focus topic of “Solar and Stellar Variability and its Impacts on Earth and Exoplanets.” The Sun–Climate Research Center – a joint venture between NASA’s Goddard Space Flight Center (GSFC) and the Laboratory for Atmospheric and Space Physics (LASP) at the University of Colorado (UC) with the Lowell Observatory hosting the meeting. The in-person meeting had 75 attendees – including 7 international participants – with diverse backgrounds covering a wide range of climate change and solar-stellar variability research topics – see Photo.
Update on NASA’s Current and Planned TSIS Missions
The current NASA solar irradiance mission, the Total and Spectral Solar Irradiance Sensor (TSIS-1), marks a significant advance in our ability to measure the Sun’s energy input to Earth across various wavelengths. Following in the footsteps of its predecessors, most notably SORCE, TSIS-1 contributes to the continuous time series of solar energy data dating back to 1978 – see Figure 1. The two instruments on TSIS-1 improve upon those on previous missions, enabling scientists to study the Sun’s natural influence on Earth’s ozone layer, atmospheric circulation, clouds, and ecosystems. These observations are essential for a scientific understanding of the effects of solar variability on the Earth system.
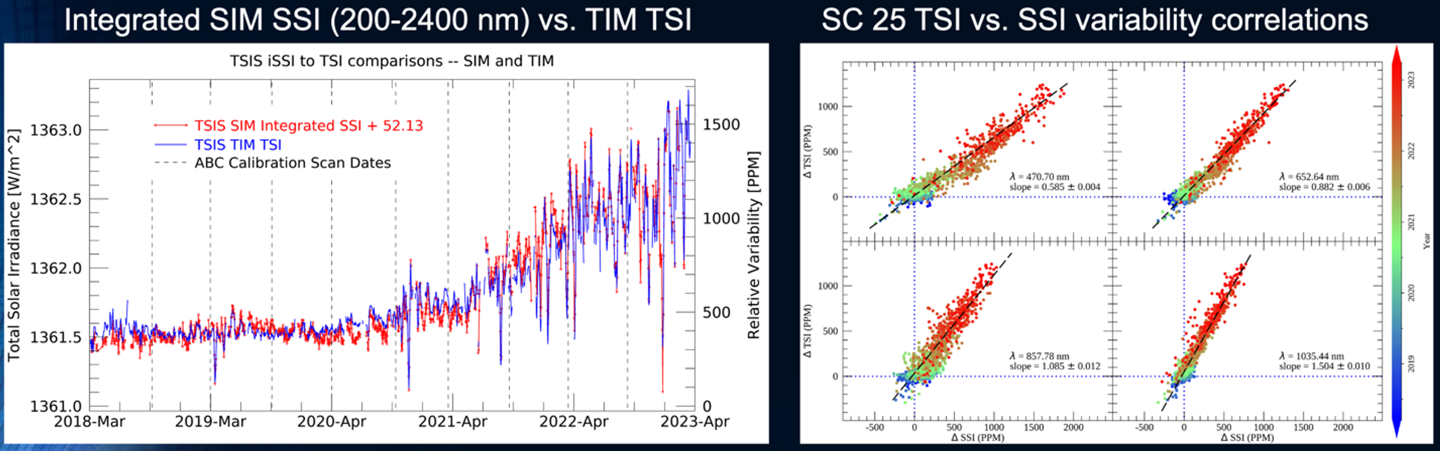
TSIS-1 launched to the International Space Station (ISS) in December 2017 and is deployed on the Station’s EXpedite the PRocessing of Experiments to Space Station (ExPRESS) Logistics Carrier–3 (ELC-3). Its payload includes the Total Irradiance Monitor (TIM) for observing the TSI and the Spectral Irradiance Monitor (SIM) for measuring the Solar Spectral Irradiance (SSI) – see comparison in Figure 2. The mission completed its five-year prime science mission in March 2023. SIM measures from 200–2400 nm with variable spectral resolution ranging from about 1 nm in the near ultraviolet (NUV) to about 10 nm in the near infrared (NIR). TSIS-1 has been extended by at least three more years as part of the Earth Sciences Senior Review process.
TSIS-2 is intended as the follow-on to TSIS-1. The mission is currently in development at LASP and GSFC with a planned launch around mid 2025. The TSIS-2 payload is nearly identical to that of TSIS-1, except that the payload will ride on a free-flying spacecraft rather than be mounted on a solar pointing platform on the ISS. NASA hopes to achieve 1–2 years of overlap between TSIS-1 and TSIS-2. Achieving such measurement overlap between missions is crucial to the continuity of the long-term records of the TSI and SSI without interruption and improving the solar irradiance composite.
In addition to the current solar irradiance mission and its planned predecessor, NASA is always looking ahead to plan for the inevitable next solar irradiance mission. Two recent LASP CubeSat missions – called Compact SIM (CSIM) and Compact TIM (CTIM) – have tested miniaturized versions of the SIM and TIM instruments, respectively. Both CSIM and CTIM have performed extremely well in space – with measurements that correlate well with the larger instruments – and are being considered as continuity options for the SSI and TSI measurements. Based on the success of CSIM and CTIM, LASP has developed a concept study report about the Compact-TSIS (CTSIS) as a series of small satellites viable for a future TSIS-3 mission.
Meeting Overview
After an opening plenary presentation in which Erik Richard [LASP] covered the information on TSIS-1, TSIS-2, CSIM, and CTIM presented in the previous section on “NASA’s Current and Planned Solar Irradiance Missions,” the remainder of the four-day meeting was divided into five science sessions each with oral presentations, and a poster session featuring 23 contributions.
The five session topics were:
- Solar and Stellar Activity Cycles
- Impacts of Stellar Variability on Planetary Atmospheres
- Evidence of Centennial and Longer-term Variability in Climate Change
- Evidence of Short-term Variability in Climate Change
- Trending of Solar Variability and Climate Change for Solar Cycle 25 (present and future)
There was also a banquet held on the final evening of the meeting (October 19) with special presentations focusing on the water drainage system and archaeology of the nearby Grand Canyon – see Sun-Climate Symposium Banquet Special Presentation on the Grand Canyon National Park.
The remainder of this report summarizes highlights from each of the science sections. To learn more, the reader is referred to the full presentations from the 2023 Sun–Climate Symposium, which can be found on the Symposium website by clicking on individual presentation titles in the Agenda tab.
Session 1: Solar and Stellar Activity Cycles
Sun-like stars (and solar analogs, solar twins) provide a range of estimates for how the Sun’s evolution may affect its solar magnetic cycle variability. Recent astrophysics missions (e.g., NASA’s Kepler mission) have added thousands of Sun-like stars to study, compared to just a few dozen from a couple decades ago when questions remained if the Sun is a normal G star or not.
Tom Ayres [UC Center for Astrophysics and Space Astronomy (CASA)] gave the session’s keynote presentation on Sun-like stars. He pointed out that the new far ultraviolet (FUV) and X-ray stellar observations have been used to clarify that our Sun is a normal G-type dwarf star with low activity relative to most other G-type dwarf stars.
Travis Metcalfe [White Dwarf Research Corporation (WDRC)] discussed the recent progress in modeling of the physical processes that generate a star’s magnetic field – or stellar dynamo. He explained how the presence of stellar wind can slow down a star’s rotation, which in turn lengthens the period of the magnetic cycle. He related those expectations to the Sun and to the thousands of Sun-like stars observed by Kepler.
Continuing on the topic of solar dynamo, Lisa Upton [Space Systems Research Corporation (SSRC)] and Greg Kopp [LASP] discussed their recent findings using a solar surface magnetic flux transport model, which they can use to reconstruct an estimated TSI record back in time to the anomalously low activity during the Maunder Minimum in the 1600s. Dan Lubin [University of California San Diego (UCSD)] described efforts to identify grand-minimum stars – which exhibit characteristics similar to our Sun during the Maunder Minimum. Using Hamilton Echelle Spectrograph observations, they have identified about two dozen candidate grand-minimum stars.
In other presentations and posters offered during this session, Adam Kowalski [LASP]) discussed stellar and solar flare physics and revealed that the most energetic electrons generated during a flare are ten times more than previously thought, while Moira Jardine [University of St. Andrews, Scotland]) discussed the related subject of space weather on the Sun and stars and how the coronal extent was likely much larger for the younger Sun. Three presenters – Debi Choudhary [California State University, Northridge], Garrett Zills [Augusta University], and Serena Criscuoli [National Solar Observatory] –discussed how solar emission line variability from both line intensity and line width are good indicators of magnetic activity on the Sun and thus relevant for studies of Sun-like star variability. Andres Munoz-Jaramillo [Southwest Research Institute (SWRI)] highlighted the importance of archiving large datasets showing the Harvard dataverse as an example. Juan Arjona [LASP] discussed the solar magnetic field observations made using the Max Planck Institute for Solar System Research’s GREGOR solar telescope.
Session 2: Impacts of Stellar Variability on Planetary Atmospheres
Presenters in this session focused on how the stellar variability can impact exoplanet evolution and climate. By analyzing data from NASA’s Kepler mission, scientists have discovered numerous Earth-like planets orbiting other stars – or exoplanets, which has enabled comparative studies between planets in our Solar System and exoplanets.
Aline Vidotto [University of Leiden, Netherlands] gave this session’s keynote presentation in which he discussed the impact of stellar winds on exoplanets. In general, younger stars rotate faster and thus have more stellar variability. The evolution of the exoplanet’s atmosphere is dependent on its star’s variability and also modulated by the exoplanet’s own magnetic field. Robin Ramstad [LASP] further clarified a planetary magnetic field’s influences on atmospheric evolution for planets in our solar system.
Vladimir Airapetian [GSFC] presented an overview of how laboratory measurements used to simulate pre-biosignatures – characteristics that precede those elements, molecules, or substances that would indicate past or present life – could be created in an exoplanet atmosphere by highly energetic particles and X-rays from stars with super flares, very large-scale magnetic eruptions on a star that can be thousands of times brighter than a typical solar flare. While the probability of a super flare event is low for our Sun (perhaps 1 every 400 years), super flares are routinely observed on more active stars.
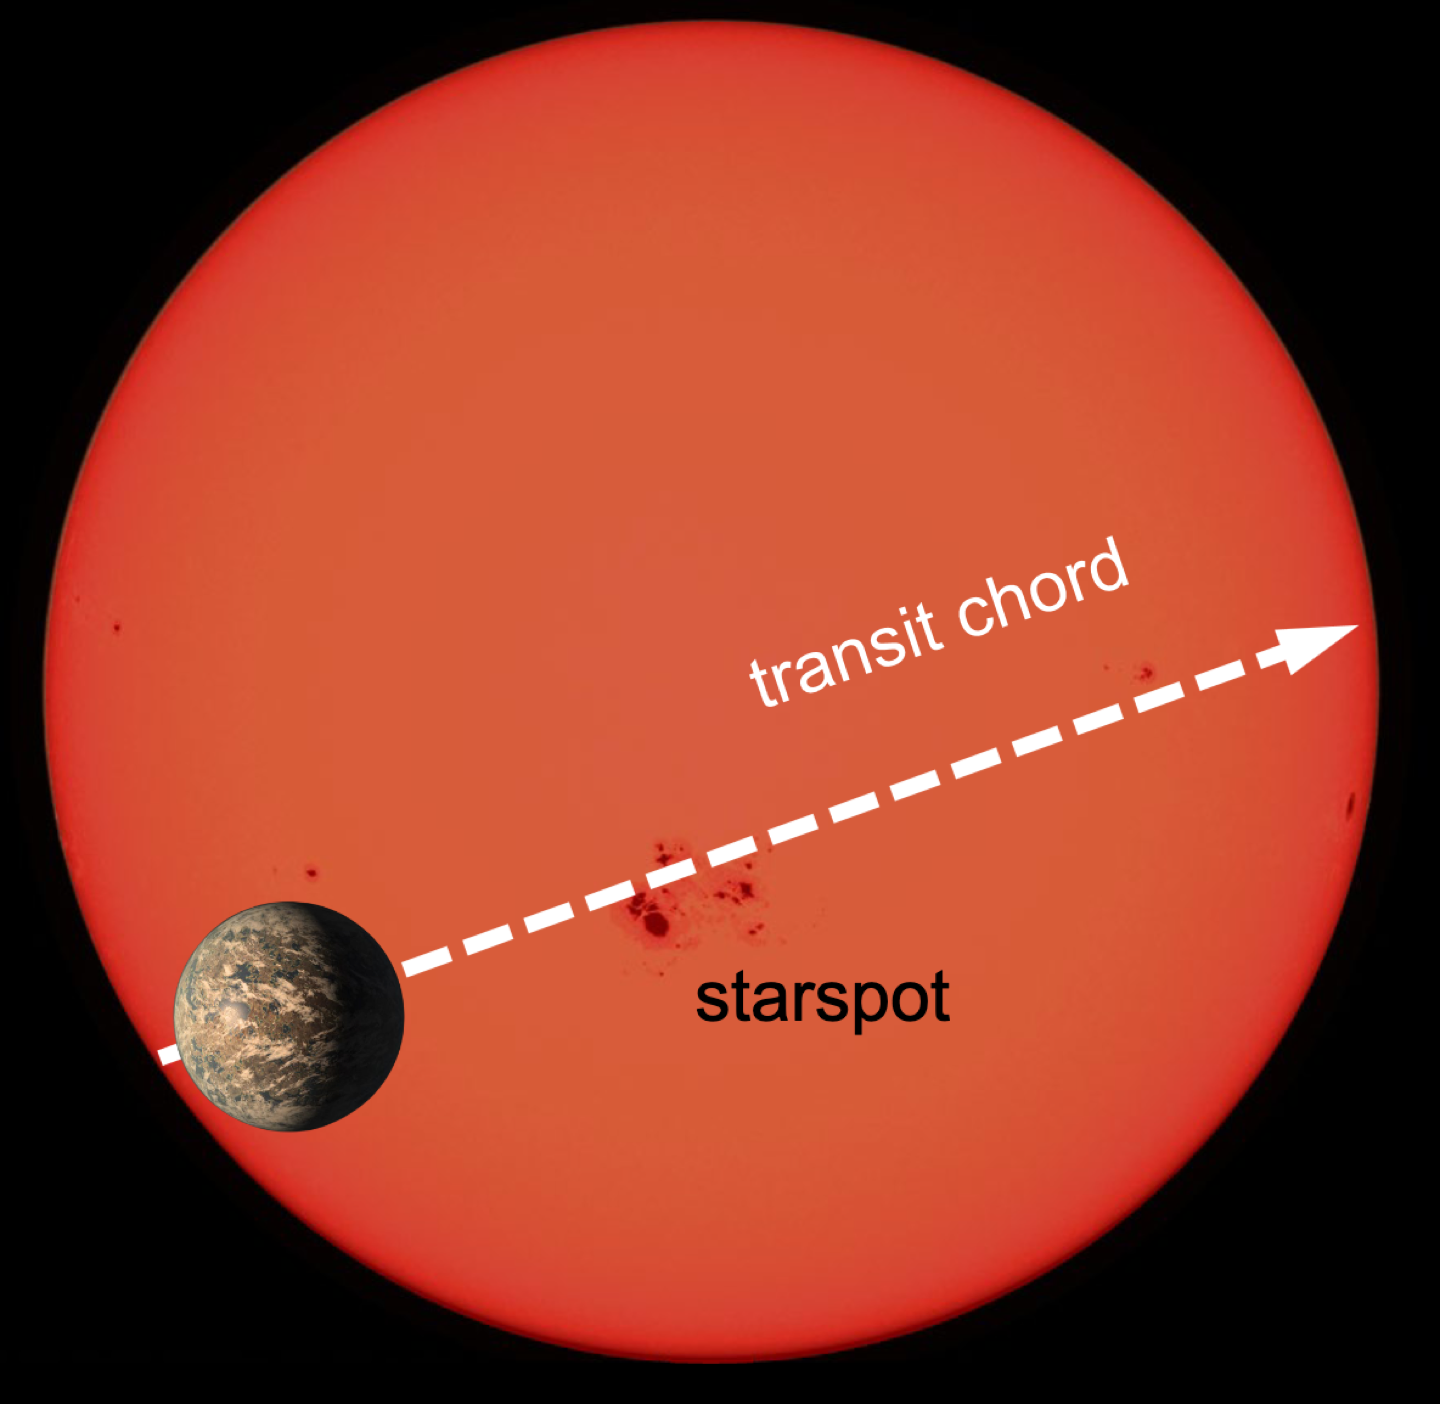
The stellar flares and the spectral distribution of the flare’s released energy can have large impacts on exoplanet’s atmospheres. Laura Amaral [Arizona State University] presented on the super-flare influences on the habitable zone of exoplanets and explained how the flare’s significantly enhanced X-ray emissions would greatly accelerate water escape from the exoplanet’s atmosphere. Ward Howard [ UC CASA] showed that exoplanet transits can also provide information about starspots (akin to the dark sunspots on the Sun) when a transit event happens to occult a starspot – see Figure 3. Ward also explained the importance of observing the transit events at multiple wavelengths, referred to as transit spectroscopy, to understand the physical characteristics of the starspots. Yuta Notsu [LASP] compared the energetics observed in many different stars using X-ray and far ultraviolet (FUV) observations to estimate stellar magnetic field strengths, which in turn can be used to estimate the stellar extreme ultraviolet (EUV) spectra. Those results provide new information on how the stellar spectra could evolve during the lifetime of Sun-like stars, and how those spectral changes can affect the atmospheric escape rates on their exoplanets.
Nina-Elisabeth Nemec [University of Göttingen, Germany] described how Kepler observations of exoplanets rely on tracking their transits across its host star’s disk. She explained some of the challenges that arise with analyzing such transits when there are large starspots present.
Session 3: Evidence of Centennial and Longer-term Variability in Climate Change
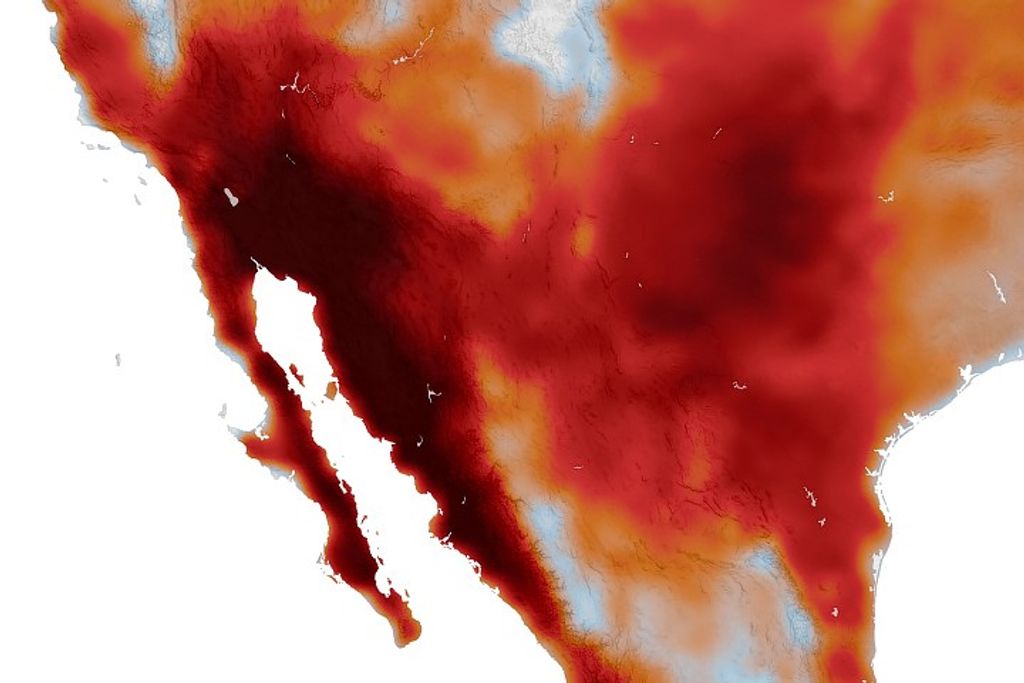
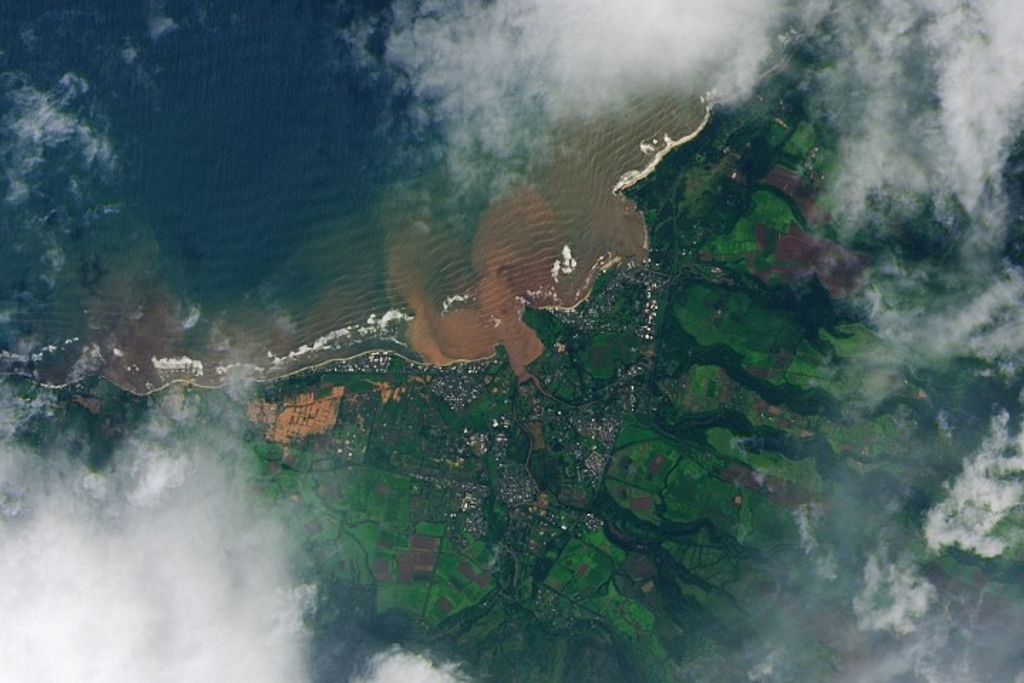
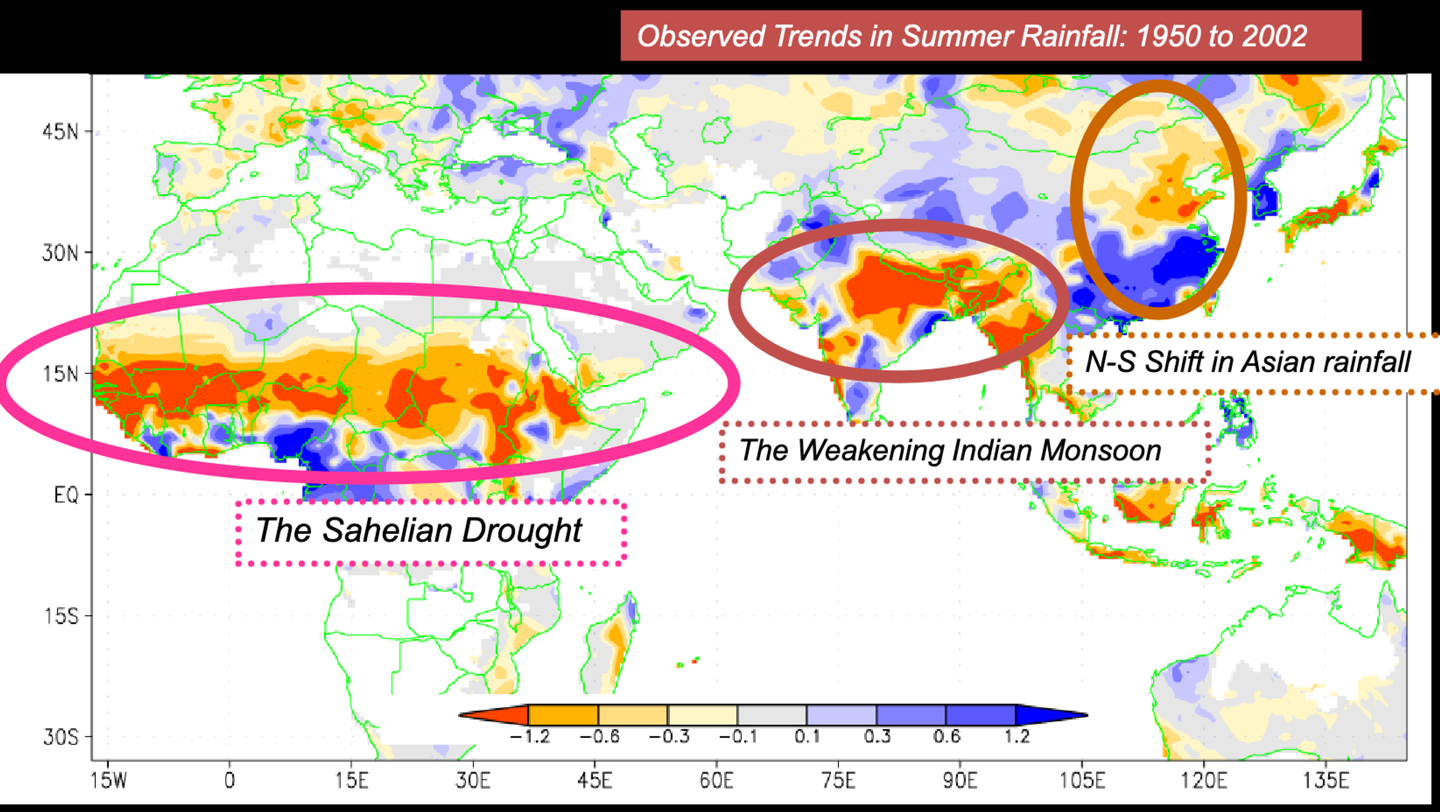
Venkatachalam “Ram” Ramaswamy [National Oceanic and Atmospheric Administration’s (NOAA) Geophysical Fluid Dynamics Laboratory (GFDL)] gave the keynote for this session in which he discussed Earth’s variable climate change over the past two centuries. He explained in detail Earth’s energy budget and energy imbalance, which leads to less land and sea ice, warmer temperatures at the surface and in the atmosphere and ocean, and more extreme weather. These weather changes have different regional impacts, such as more floods in some regions and more drought in different regions – see Figure 4.
Bibhuti Kumar Jha [SWRI], Bernhard Hofer [Max Planck Institute for Solar System Research, Germany], and Serena Criscuoli [National Solar Observatory] discussed long-term solar measurements from the Kodaikanal Solar Observatory and showed that the chromospheric plages (Ca K images) have 1.6% faster solar rotation rate than sunspots (white light images). Timothy Jull [University of Arizona (UA)], Fusa Miyake [Nagoya University, Japan], Georg Fueulner [Potsdam Institute for Climate Impact Research, Germany], and Dan Lubin discussed the impact that solar influences (i.e., solar flares, solar energetic particles) have had on Earth’s climate over hundreds of years through their impact on phenomena such as the natural distribution of carbon dioxide in the atmosphere and fluctuations in the North Atlantic Oscillation.
Hisashi Hayawawa [Nagoya University] and Kalevi Mursula [University of Oulu, Finland] discussed the influence that ever-changing sunspots and magnetic fields on the Sun are having on climate – with a focus on the Maunder Minimum period. Irina Panyushkina [UA] and Timothy Jull presented tree ring radioisotope information as it relates to climate change trends as well as long-term, solar variability trends. According to Lubin, if a reduction in solar input similar to what happened during the Maunder Minimum would happen today, the resulting reduction in temperature would be muted due to the higher concentration of greenhouse gases (GHG) in the atmosphere.
Session 4: Evidence of Short-term Variability in Climate Change
Session 4 focused on discussions that examined shorter-term variations of solar irradiance and climate change. Bill Collins [Lawrence Berkeley National Laboratory (LBNL)] started off the session with a presentation on Earth albedo asymmetry across the hemispheres from Nimbus-7 observations, and then showed some important differences when looking at the Clouds and the Earth’s Radiant Energy System (CERES) record – shown in Figure 5. Lon Hood [UA] discussed the changes in atmospheric circulation patterns which might be the consequence of Arctic sea ice loss increasing the sea level pressure over northern Eurasia. Alexi Lyapustin [GSFC] described how higher temperatures are causing an extension of the wildfire season in the Northern hemisphere by 1–3 months.

Jae Lee [GSFC/University of Maryland, Baltimore County] discussed changes in the occurrence and intensity of the polar mesosphere clouds (PMCs), showing high sensitivity to mesospheric temperature and water, and fewer PMCs for this solar cycle. In addition, some presenters discussed naturally driven climate changes. Luiz Millan [JPL], whose research has found that the water-laden plume from the Hunga-Tonga-Hunga-Ha’apai (HT-HH) volcano eruption in January 2022 has had a warming effect on the atmosphere as well as the more typical cooling effect at the surface from the volcanic aerosols. In another presentation, Jerry Raedar [University of New Hampshire, Space Science Center] showed results from his work indicating about 5% reductions in temperature and pressure following major solar particle storms, but noted differences in dependence between global and regional effects.
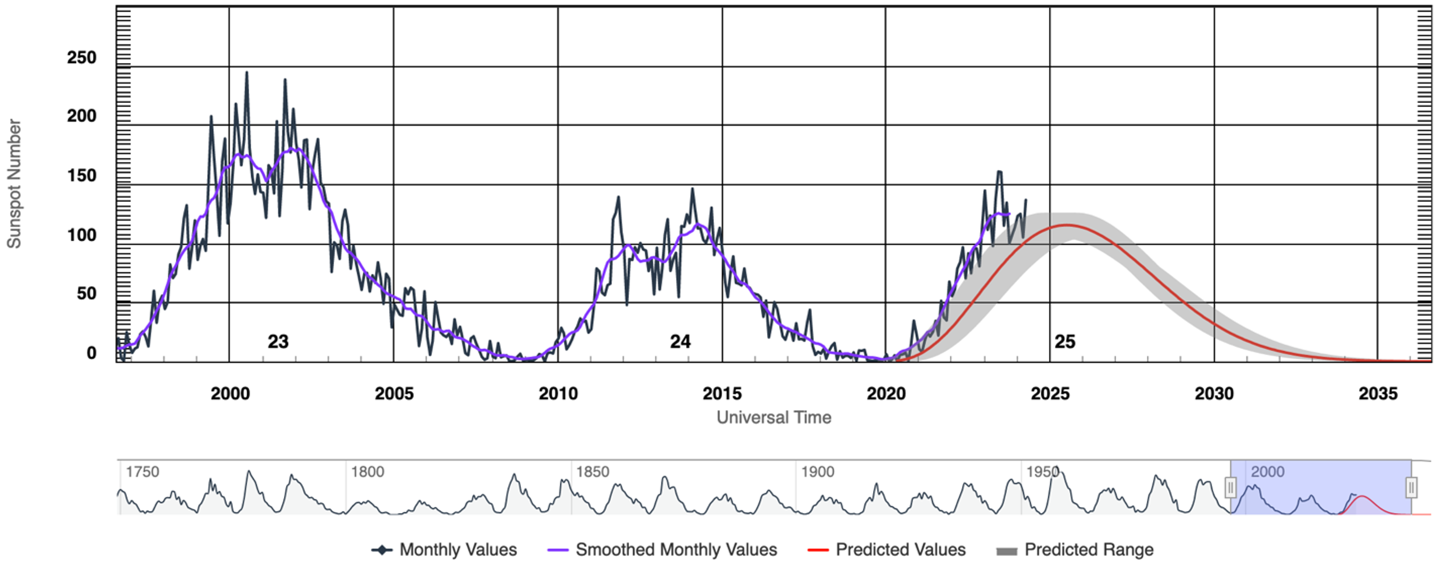
Session 5: Trending of Solar Variability and Climate Change for Solar Cycle 25 (present and future)
Session 5 focused on trends during Solar cycle 25 (SC-25), which generated lively discussions about predictions. It appears the SC-25 maximum sunspot number could be about 15% higher than the original SC-25 maximum predictions. Those differences between the sunspot observations and this prediction may be related to the timing of SC-25 ramp up. Lisa Upton started off Session 5 by presenting both the original and latest predictions from the NASA–NOAA SC-25 Prediction Panel. Her assessment of the Sun’s polar magnetic fields and different phasing of magnetic fields over the Sun’s north and south poles suggests that the SC-25 maximum will be larger than the prediction – see Figure 6.
The next several speakers – Matt DeLand [Science Systems and Applicatons Inc. (SSAI)], Sergey Marchenko [SSAI], Dave Harber [LASP], Tom Woods [LASP], and Odele Coddington [LASP] – showed a variety of TSI and SSI (NUV, visible, and NIR) variability observations during SC-25. The group consensus was that the difference between the SC-24 and SC-25 maxima may be due to the slightly higher solar activity during SC-25 as compared to the time of the SC-24 maximum – which was an anomalously low cycle. The presenters all agreed that SC-25 maximum may not have been reached yet (and SC-25 maximum may not have occurred yet in 2024).
On the climate change side, Don Wuebbles [University of Illinois, Urbana-Champaign] provided a thorough overview of climate change science showing that: the largest impacts result from the activities of humans, land is warming faster than the oceans, the Arctic is warming two times faster than rest of the world, and 2023 was the hottest year on record with an unprecedented number of severe weather events.
There were several presentations about the solar irradiance observations. Leah Ding [American University] presented new analysis techniques using machine learning with Solar Dynamics Observatory (SDO) solar images to study irradiance variability. Steve Penton [LASP] discussed new SIM algorithm improvements for TSIS-1 SIM data product accuracy. Margit Haberreiter [Physikalisch-Meteorologisches Observatorium Davos (PMOD), Switzerland] discussed new TSI observations from the Compact Lightweight Absolute Radiometer (CLARA) on the Norwegian NorSat-1 microsatellite. Marty Snow [South African National Space Agency] discussed a new TSI-proxy from the visible light (green filter) Solar Position Sensor (SPS) flown on the NOAA Geostationary Operational Environmental Satellites (GOES-R). (The first of four satellites in the GOES-R series launched in 2016 (GOES-16) followed by GOES-17 and GOES-18 in 2018 and 2022 respectively. The final satellite in the series – GOES-U – launched June 25, 2024 will become GOES-19 after checkout is complete.)
Peter Pilewskie [LASP] discussed future missions, focusing on the Libera mission for radiative energy budget, on which he is Principal Investigator. Selected as the first Earth Venture Continuity mission (EVC-1), Libera will record how much energy leaves our planet’s atmosphere on a day-by-day basis providing crucial information about how Earth’s climate is evolving. In Roman mythology, Libera was Ceres’ daughter. The mission name is thus fitting as Libera will act as a follow-on mission to maintain the decades long data record of observation from NASA’s suite of CERES instruments. Figure 7 shows the CERES climate data record trends over the past 20 years.

Susan Breon [GSFC] discussed the plans for and status of TSIS-2 , and Tom Patton [LASP] discussed CTSIS as an option for TSIS-3 – both of these topics were discussed earlier in this article in the section on “NASA’s Current and Planned Solar Irradiance Missions.”
Angie Cookson [California State University, San Fernando Observatory (SFO)] shared information about the SFO’s 50-year history, and how analyses of solar image observations taken at SFO are used to derive important indicators of solar irradiance variability – see Figure 8.


Sun-Climate Symposium Banquet Special Presentation on the Grand Canyon National Park
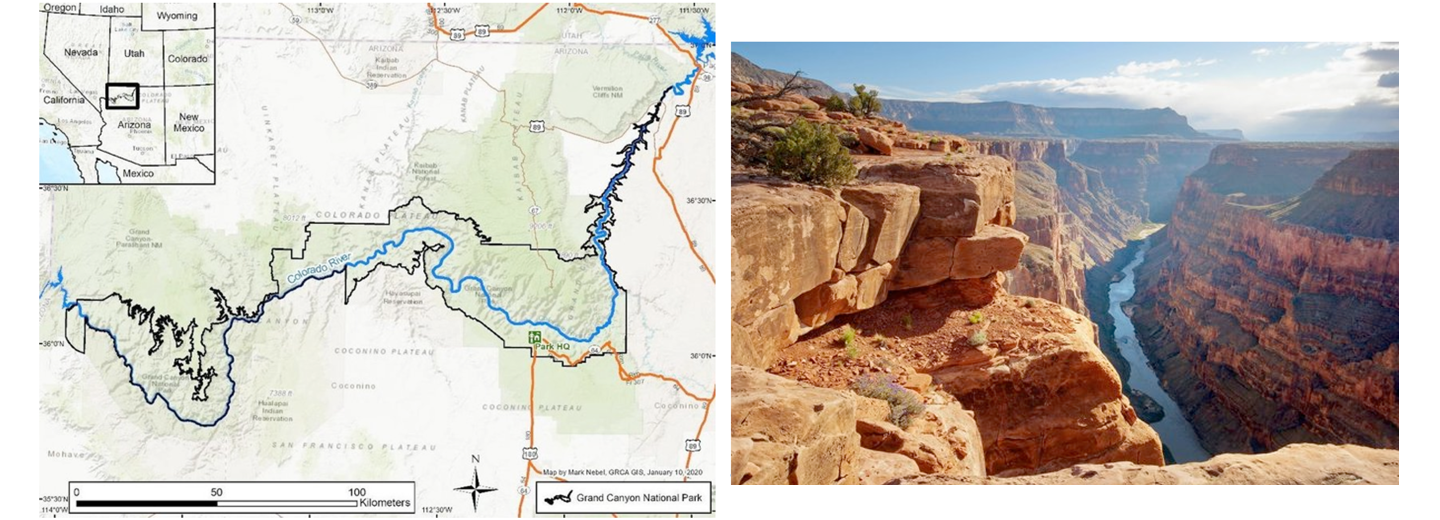
At the Thursday evening banquet, two speakers – Mark Nebel and Anne Millar – from the National Park Service (NPS) presented some of their geological research on the nearby Grand Canyon. Nebel discussed the water drainage systems surrounding the Grand Canyon while Millar described the many different fossils that have been found in the surrounding rocks. Nebel explained how the Grand Canyon’s water drainage system into the Colorado River is complex and has evolved over the past few decades – see map and photo below. Millar brought several samples of the plant and insect fossils found in the Grand Canyon to share with banquet participants. Those fossils ranged in time from the Bright Angel Formation ocean period 500 million years ago to the Hermit Formation period 285 million years ago – when the Grand Canyon was semi-arid land with slow-moving rivers.
Conclusion
Altogether, 80 presentations during the 2023 Sun–Climate Symposium spread across 6 sessions about solar analogs, exoplanets, long-term climate change, short-term climate change, and solar/climate recent trending. The multidisciplinary group of scientists attending made for another exciting conference for learning more about the TSIS solar irradiance observations. Sun–Climate recent results have improved perception of our Sun’s variability relative to many other Sun-like stars, solar impact on Earth and other planets and similar type impacts of stellar variability on exoplanets, and better characterization of anthropogenic climate drivers (e.g., increases in GHG) and natural climate drivers (Sun and volcanoes).
The next Sun–Climate Symposium will be held in spring 2025 with a potential focus on polar climate records, including polar ice trends and long-term solar variabilities derived from ice-core samples. Readers who may be interested in participating in the 2025 science organizing committee should contact Tom Woods and/or Dong Wu [GSFC].

Acknowledgments
The three co-authors were all part of the Science Organizing Committee for this meeting and wish to acknowledge the other members for their work in planning for and participating in another successful Sun–Climate Symposium. They include: Odele Coddington, Greg Kopp, and Ed Thiemann [all at LASP]; Jae Lee, Doug Rabin, and Dong Wu [all at GSFC]; Jeff Hall, Joe Llama, and Tyler Ryburn [all at Lowell Observatory]; Dan Lubin [UCSD’s Scripps Institution of Oceanography (SIO)]; and Tom Stone [U.S. Geological Survey’s Astrogeology Science Center]. The authors and other symposium participants are also deeply grateful to Kelly Boden [LASP] for organizing the logistics and management of the conference, and to the Lowell Observatory, the Drury Inn conference center staff, and the LASP data system engineers for their excellent support in hosting this event.
Tom Woods
University of Colorado, Laboratory for Atmospheric and Space Research
tom.woods@lasp.colorado.edu
Peter Pilewskie
University of Colorado, Laboratory for Atmospheric and Space Research
peter.pilewskie@lasp.colorado.edu
Erik Richard
University of Colorado, Laboratory for Atmospheric and Space Research
erik.richard@lasp.colorado.edu