


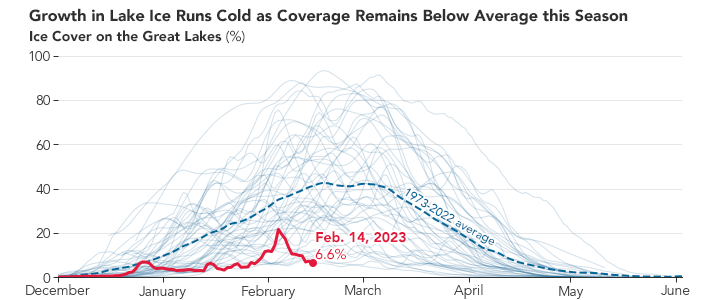
So far this winter, the Great Lakes have been unusually ice-free. As of February 14, 2023, ice covered only 6.6 percent of the five freshwater lakes, which is significantly less than the 35-40 percent ice cover that is typical for mid-February, according to data published by the National Oceanic and Atmospheric Administration's (NOAA) Great Lakes Environmental Research Laboratory (GLERL).
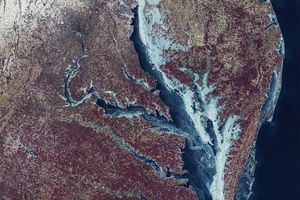
When the Visible Infrared Imaging Radiometer Suite (VIIRS) on the NOAA-20 satellite acquired this image on February 13, ice cover on the lakes was 7 percent. This is the lowest ice cover measured on this date of any year since 1973, when satellite-based record keeping began. What little ice is present skirts the coastlines of the lakes. A strip of ice can be seen crossing Lake Huron’s Saginaw Bay. In Lake Erie, sediment swirls kicked up by storms give the water a marble-like look.
Air temperatures are the main factor affecting ice cover on the Great Lakes. According to the U.S. National Ice Center, each of the five lakes experienced warmer than average air temperatures in January 2023. The average temperature across the contiguous U.S. was 35.2 degrees Fahrenheit (5.1 degrees above average) according to NOAA, making January 2023 the sixth-warmest January on record.
Ice extent across the Great Lakes Basin briefly jumped to 21 percent in early February in response to a cold snap. But since then, it has declined through at least mid-February. Maximum ice cover typically occurs between mid-February and early March.
Ice cover on the lakes varies from year to year. But an analysis led by Jia Wang, an ice climatologist at NOAA’s GLERL, shows a downward trend spanning 44 years. During the winter period, which runs from December 1 to April 30, average ice cover on the Great Lakes declined 69 percent between 1973 and 2017.
Anthropogenic warming has played a role in this decades-long decline. But a larger factor, Wang has found, is the natural patterns of climate variability over the Pacific and Atlantic oceans: the North Atlantic Oscillation, the Atlantic Multidecadal Oscillation, the Pacific Decadal Oscillation, and the El Niño-Southern Oscillation.
“Each year we have to look at these four patterns to model ice cover,” said Wang. “Right now, the Pacific Decadal Oscillation together with the North Atlantic Oscillation are causing warming in the Great Lakes.”
References & Resources
- NASA Earth Observatory (2020, February 20) Great Lakes, Not so Great Ice.
- NOAA (2023, February 8) January 2023 was nation’s 6th warmest on record. Accessed February 16, 2023.
- NOAA (2023, February 14) Earth had its 7th-warmest January on record. Accessed February 16, 2023.
- NOAA (2018, July 9) Great Lakes ice cover decreasing over last 40 years. Accessed February 16, 2023.
- NOAA Coast Watch Great Lakes (2023, February 15) Great Lakes Ice Concentration (1973-2023). Accessed February 14, 2023.
- NOAA Great Lakes Environmental Research Laboratory (2023, February 14) Great Lakes Ice Cover. Accessed February 15, 2023.
- NOAA Great Lakes Environmental Research Laboratory (2017, December 12) Great Lakes Ice Climatology Update of Winters 2012-2017: Seasonal Cycle, Interannual Variability, Decadal Variability, and Trend for the period 1973-2017. Accessed February 15, 2023.
- NOAA Great Lakes Environmental Research Laboratory, via Twitter (2023, February 9) Lake Erie MODIS Image. Accessed February 16, 2023.
- U.S. National Ice Center (2023, February 12) Great Lakes 30 Day Forecast. Accessed February 12, 2023.
NASA Earth Observatory images by Joshua Stevens , using VIIRS data from NASA EOSDIS LANCE , GIBS/Worldview , and the Joint Polar Satellite System (JPSS) and lake ice data from NOAA - Great Lakes Environmental Research Laboratory . Story by Emily Cassidy .


