


A Line of Snow in a Cold Spring Shower
Our forecasters at Iowa State, and I believe via the National Weather Service, are calling this a “once in a career storm.” The heavy snow in central Iowa—really, almost on top of us right now, is the reason. We ran NPOL all night long with the D3R radar in cold rain that started around 2 a.m. I awoke to some ice pellets this morning around 5 a.m. in my hotel room and then wind-driven rain. The wind has been blowing a steady 25 to 30 mph.
We had some funny things happen with the antenna last night. Wind stopped it a few times in big gusts; it is a big 28-foot “sail” after all, and then we had some miscommunication between the antenna controller and the software that controls scanning. The radar scientist on duty, Dr. Timothy Lang, came up with a good work-around. His solution was to run constant “PPI volumes,” which basically do a full 360 degree sweep at several elevation angles. This enabled us to keep collecting good data and to do it at our sub-3 minute cycle time. We set that time as the outside limit on how frequently we wanted to fully sample the rainfall field around us.
We got the antenna situation repaired this morning, and I was able to go back into alternate rain scan vs. range-height scanning mode with the D3R, so that we sample both the rain field and the structure of the precipitation with height at very high resolution along our ray of disdrometers and rain gauges that stretch in a line toward Iowa City.
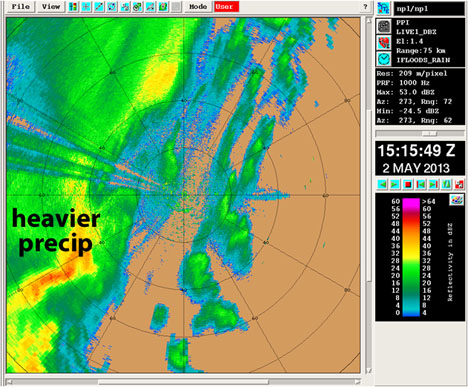
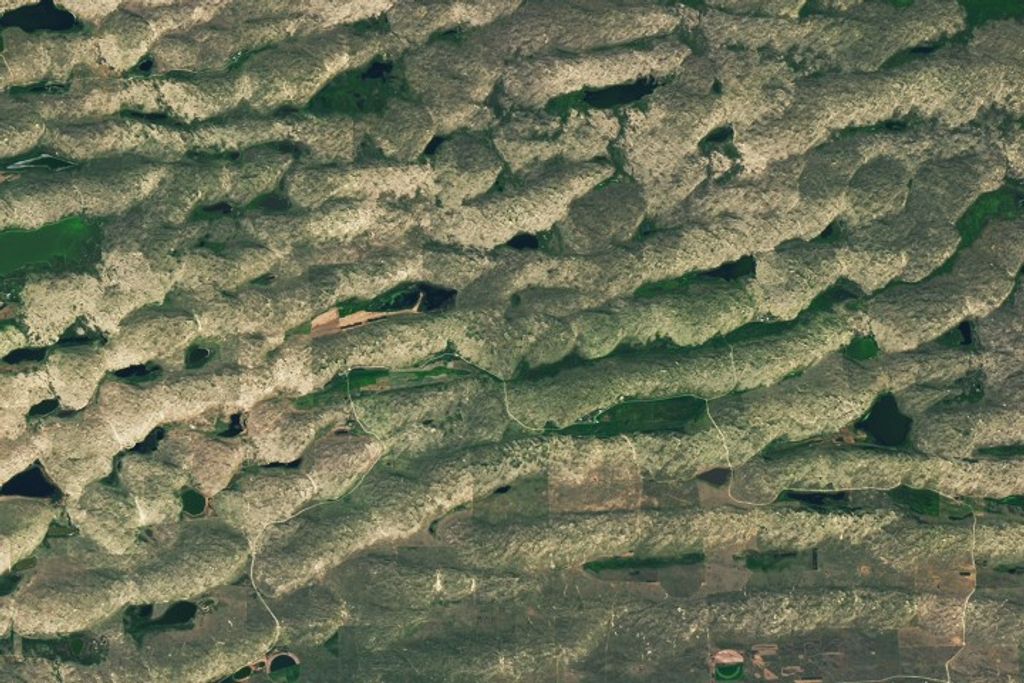
One thing that is really impressive is the change in precipitation type, and the rapid drop in the height of the freezing level we are seeing as one moves west of the radar. This is illustrated nicely in the dual-polarimetric data that the radar collects. The first image (above) shows an example of the radar reflectivity field that we saw around 15:15 UTC (or 10:15 local time). This variable is typically what your TV Meteorologist shows you on the evening newscast. Notice the band of higher reflectivity just to the west of the radar that indicates heavier rain.
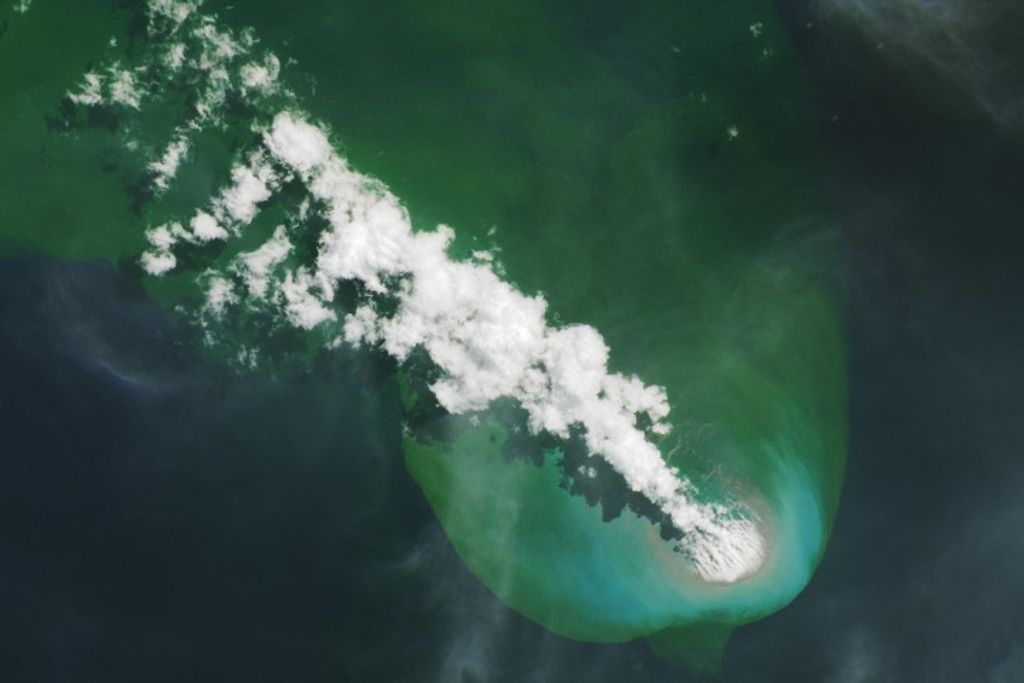
Now the second image (below) shows a variable called the “correlation coefficient” or, RHOHV. This variable takes the signal at both the horizontal and vertical polarizations and computes their correlation at each range sample along all the rays. It is a sensitive measure of the degree to which you have a mixture of liquid and frozen precipitation particles in a given sample volume.
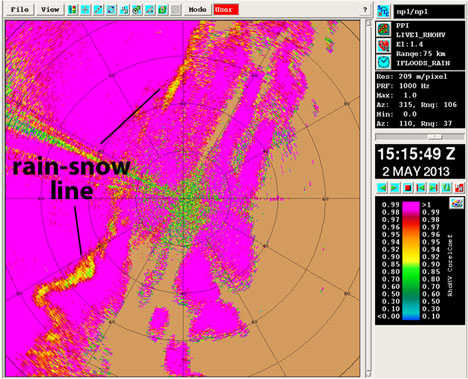
Raindrops are usually very highly correlated and values will typically exceed 0.98 or so. However, when you get a mixture of snow and rain, the correlation drops rapidly. You can see this rapid drop in correlation to the west of the radar along the narrow line yellowish to orange colors (embedded in the solid pinkish colors of high RHOHV) that extend in a line from southwest of the radar up to the northeast of the radar. That is where the infamous rain-snow line is located in Central Iowa. We await the arrival of that line over NPOL—though it is only progressing eastward very slowly.
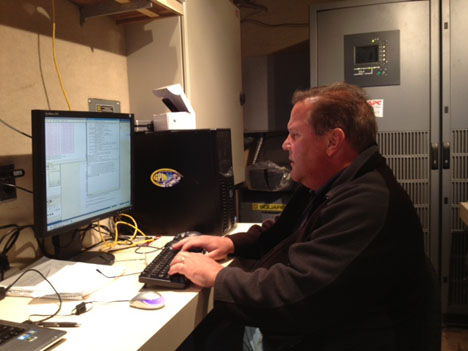
Dave Wolff (above), my companion Radar Scientist this week, and also from NASA Wallops, has done a great job of getting some of our NPOL imagery online in real time, so that is a big help to the field operations. It seems that most of the equipment and networking is working- a testament to the hard work several of these folks are putting in.
I must say though, right now I am most anxiously awaiting a hot cup of coffee which one of our Radar Engineers has graciously offered to grab for me on his lunch run.
From May 1 to June 15, NASA and Iowa Flood Center scientists from the University of Iowa will measure rainfall in eastern Iowa with ground instruments and satellites as part of a field campaign called Iowa Flood Studies (IFloodS). They will evaluate the accuracy of flood forecasting models and precipitation measurements from space with data they collect. Walt Petersen, a scientist based at NASA’s Wallops Flight Facility, is the Ground Validation Scientist for the Global Precipitation Measurement (GPM) mission.
