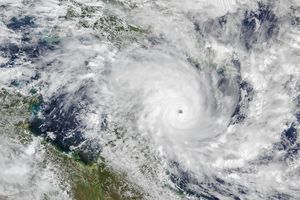


On September 8, 2008, Hurricane Ike hammered Cuba, the storm remained poised to strike the U.S. Gulf Coast in the next few days.
This data visualization of the hurricane shows observations of winds in Ike made by NASA’s QuikSCAT satellite on September 8, 2008, at 7:12 a.m. local time (11:12 UTC). Landmasses in this image appear in dark gray. Cuba appears in the center of this image. The southern tip of Florida appears in the northwest, the Bahamas appear in the northeast, and parts of Haiti appear in the southeast. Colors ranging from dark blue to purple indicate wind speeds over the ocean. The most intense winds appear off the coast of Cuba, at more than 50 knots (purple). Radiating out from this region are wind speeds of more than 25 knots (red). Small barbs indicate wind direction, and white barbs point to areas of heavy rain.
According to the U.S. National Hurricane Center’s Public Advisory 29A, a hurricane warning was in effect for ten Cuban provinces at the time this image was acquired. The eye of the storm was roughly 35 kilometers (20 miles) south of Camaguey, Cuba. Maximum sustained winds were 155 kilometers (100 miles) per hour with stronger gusts.
QuikSCAT measures wind by sending pulses of microwave energy through the atmosphere to the ocean and recording the energy that bounces back from the wind-roughened surface. The energy of the microwave pulses changes depending on wind speed and direction.
The wind speeds shown in this image may be lower than winds recorded on the ground. To relate the radar signal to actual wind speed, scientists compare measurements taken from buoys and other ground stations to data the satellite acquired at the same time and place. Because the high wind speeds generated by cyclones are rare, scientists do not have corresponding ground information to know how to translate data from the satellite for wind speeds above 50 knots (about 93 km/hr or 58 mph).
Also, the unusually heavy rain found in a cyclone distorts the microwave pulses in a number of ways, making a conversion to exact wind speed difficult. Instead, the scatterometer provides a nice picture of the relative wind speeds within the storm and shows wind direction. This information can be useful for helping forecasters precisely locate the eye.
References & Resources
NASA image courtesy of David Long, Brigham Young University, on the QuikSCAT Science Team , and the Jet Propulsion Laboratory. Caption by Michon Scott.