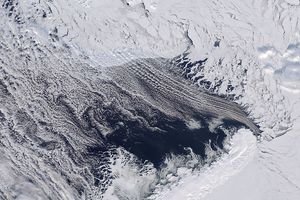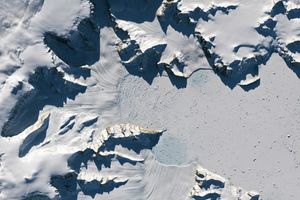


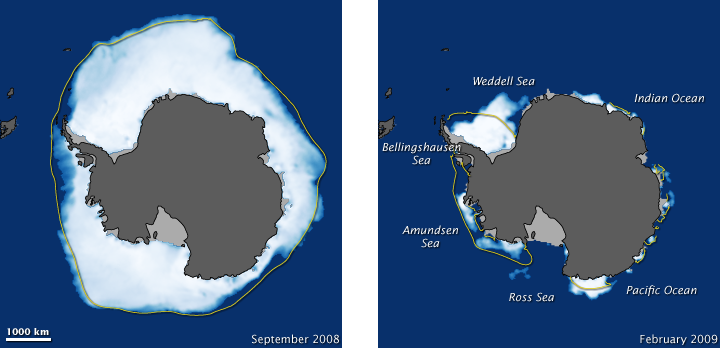
Antarctic sea ice grows to its maximum each September and melts to its minimum in late February, after which it resumes growing rapidly. This image pair shows monthly Antarctic sea ice concentration for the most recent winter maximum (September 2008, left) and summer minimum (February 2009, right). The images are two of the series of images in our recent article World of Change: Antarctic Sea Ice, which documents Antarctic sea ice maximums and minimums over the past decade.
Land is dark gray, and ice shelves—thick slabs of ice grounded along the coast—are light gray. The yellow outline on each image shows the median sea ice extent observed by satellite sensors from 1979 through 2000. Extent is the total area in which ice concentration is at least 15 percent. The median is the middle value. Half of the extents over the time period were larger than the line, and half were smaller.
These images are made from a combination of observations from the Special Sensor Microwave/Imagers (SSM/Is) flown on a series of Defense Meteorological Satellite Program missions and the Advanced Microwave Scanning Radiometer for the Earth Observing System (AMSR-E), a Japanese-built sensor that flies on NASA’s Aqua satellite.
At the September 2008 maximum, ice concentration in the Pacific, Bellingshausen Sea, and Amundsen Sea sectors were below the median extent, while concentration in the Weddell and Ross Seas were slightly above the median. It is normal for sea ice to completely melt in some sectors in the summer. For example, in the Indian and Pacific Ocean sectors, the yellow line is on top of or only slightly offshore of the edge of the continent: in general, sea ice disappears from those places by the end of the summer. On the other hand, absence of sea ice in the Bellingshausen and Amundsen Sea sectors at the February 2009 minimum is unusual compared to the long-term median extent.
Satellites began observing sea ice in late 1978 and since that time, Antarctic sea ice has increased by about 1 percent per decade. Whether this trend is a meaningful sign of change in Antarctic climate is uncertain, however, because the increase is very small, and the year-to-year oscillations in ice extent have been large relative to the trend. To see images from 1999–2009 and to learn about trends in Antarctic sea ice, see the Earth Observatory feature World of Change: Antarctic Sea Ice.
Links
- NSIDC. State of the Cryosphere. Accessed May 13, 2009.
- Scott, M. (2009, April 20). Sea Ice. Accessed May 13, 2009.
References & Resources
- Cavalieri, D. J., and C. L. Parkinson (2008). Antarctic sea ice variability and trends. 1979–2006. Journal of Geophysical Research Oceans. 113, C07004.
- NSIDC. (2007, September 25). Bootstrap Sea Ice Concentrations from Nimbus-7 SMMR and DMSP SSM/I. Accessed May 15, 2009.
- NSIDC. Frequently Asked Questions about Sea Ice. Accessed May 20, 2009.
- NSIDC. Sea Ice Index. Accessed May 13, 2009.
- Raphael, M.N. (2007). The influence of atmospheric zonal wave three on Antarctic sea ice variability. Journal of Geophysical Research. 112, D12112.
- Steig, E.J., Schneider, D.P., Rutherford, S.D., Mann, M.E., Comiso, J.C., Shindell, D.T. (2009). Warming of the Antarctic ice-sheet surface since the 1957 International Geophysical Year. Nature. 457, 459-463.
NASA images by Jesse Allen, using data from the National Snow and Ice Data Center (NSIDC). Caption by Michon Scott.
None