


![Request for Information – Potential [Placeholder for Prize]](https://assets.science.nasa.gov/dynamicimage/assets/science/psd/solar/2023/09/s/solarsystem_0.jpg?w=1024)


Many types of aerosol particles circulate in the atmosphere, but one of the most damaging to human health is known as PM2.5, a technical term for microscopic bits of matter less than 2.5 microns in diameter (one thirtieth the width of a human hair). These small pollutants, which come mostly from burning fossil fuels and biomass, can lodge deep in the lungs, where they exacerbate a variety of respiratory and cardiovascular diseases.
Ground-based instruments are the standard for monitoring PM2.5 in many industrialized nations. For example, the U.S. Environmental Protection Agency, along with state and local governments, maintain a network of about 10,000 ground stations that generate real-time air quality measurements for hundreds of cities. Such data gets funneled into services like AIRNow, which issues warnings when pollution reaches unsafe levels.Â
However, not all countries have ground-based monitoring systems that measure such fine-grained pollutants. China, like most countries, has traditionally only monitored a larger type of particle pollution known as PM10. Though Chinese leaders have announced a plan to monitor PM2.5 more broadly in the future, to date only a handful of cities have started to publish PM2.5 numbers.
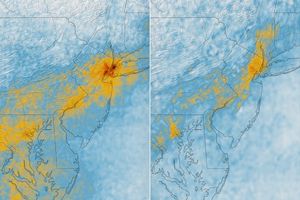
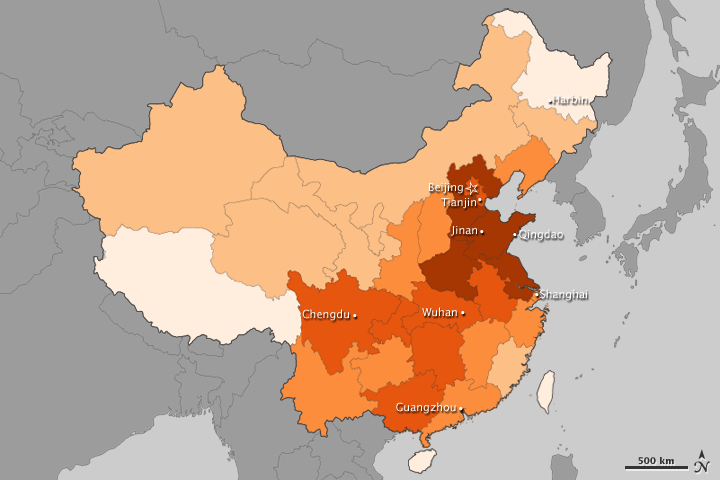
Satellites offer a perspective on PM2.5 that is particularly useful when ground instruments are unavailable or offer limited information. With that in mind, researchers at Columbia University’s Earth Institute and Batelle Memorial Institute have developed maps based on satellite data that depict annual PM2.5 exposure in all of China’s provinces.
The map above, which shows annual exposure between 2008-2010, indicates that most areas had PM2.5 levels that exceeded World Health Organization guidelines (10 micrograms per cubic meter). Areas surrounding Beijing and to the south along the coast, which fall in China’s industrial heartland, had the most pollution. In many cases, annual exposure was above 40 micrograms per cubic meter. Other provinces in eastern and south central China had pollution levels above 30 micrograms per cubic meter. For comparison, the New York, Chicago, and Los Angeles metro areas have PM2.5 levels that average between 10 and 20 micrograms per cubic meter.
The values used to create the map were derived from a method that Dalhousie University scientist Aaron van Donkelaar developed and published in Environmental Health Perspectives in 2010. At the time, van Donkelaar released a global map of PM2.5 pollution. Both that map and the map above are based on data from the Multi-angle Imaging Spectroradiometer (MISR) instrument on the Terra satellite, the Moderate Resolution Imaging Spectroradiometer (MODIS) instrument on the Terra and Aqua satellites, and a chemical transport model called GEOS-Chem.
While satellite measurements are the best option in areas with limited ground monitoring, they are not without shortcomings. Satellites, for example, have difficulty detecting pollution over bright surfaces, such as snow and deserts. Overall, the researchers say the uncertainty amounts to about 6.7 micrograms per cubic meter.
References & Resources
- Donkelaar, A. (2010, March). Global Estimates of Ambient Fine Particulate Matter Concentrations from Satellite-Based Aerosol Optical Depth: Development and Application. Environmental Health Perspectives, 118(6)
- Economist. Man-Made and Visible From Space. Accessed March 22, 2012.
- State of the Planet. Bottom Up or Top Down? Another Way to Look at an Air Quality Problem. Accessed March 22, 2012.
- China Dialogue. Seeing China’s Pollution from Space. Accessed March 22,2012.
NASA Earth Observatory image by Jesse Allen, using data provided by Erica Zell, Battelle and Angel Hsu, Yale Center for Environmental Law & Policy. Caption by Adam Voiland.
None