


“Climate change is already affecting the American people in far-reaching ways.” So begins an extensive report issued by the U.S. Global Change Research Program on May 6, 2014. The Global Change Research Act of 1990 requires that Congress and the President should be presented every four years with an assessment of the effects of climate change on the United States, so a team of more than 300 experts assembled the report from peer-reviewed science and observations. It contains 12 key findings, the first of which notes that climate is changing globally and that change is apparent in the United States.
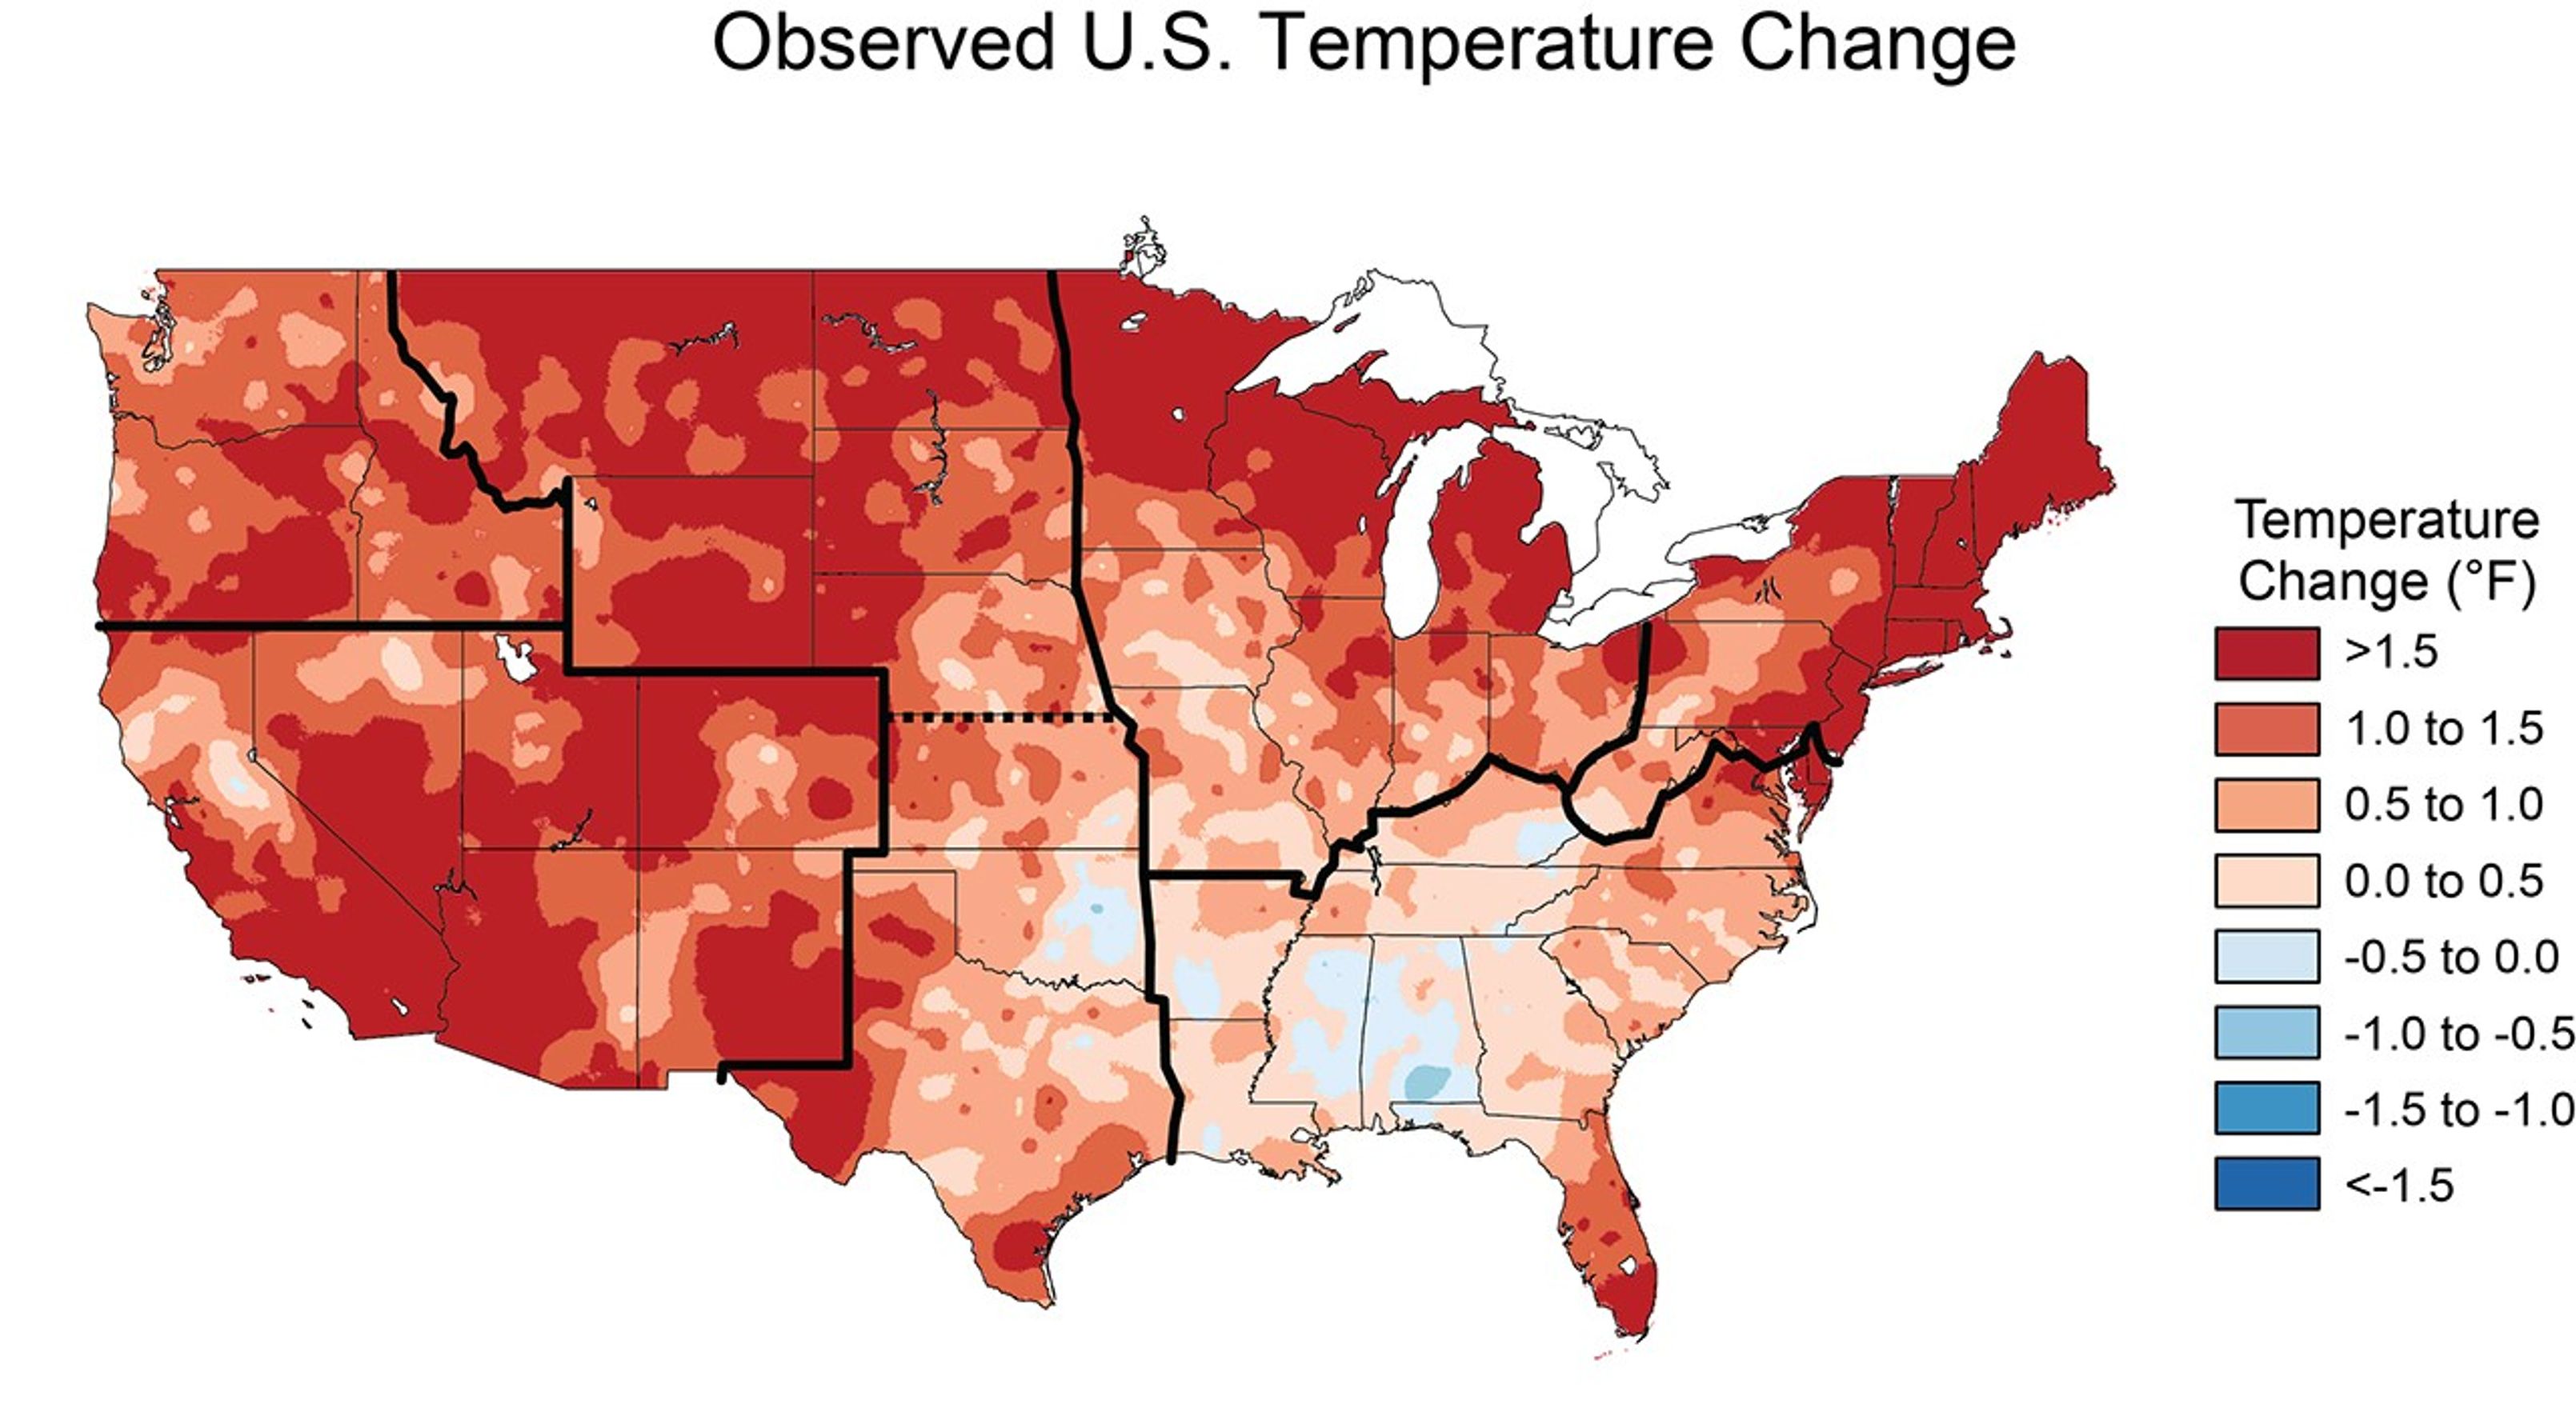
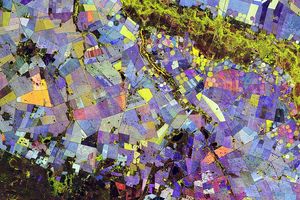
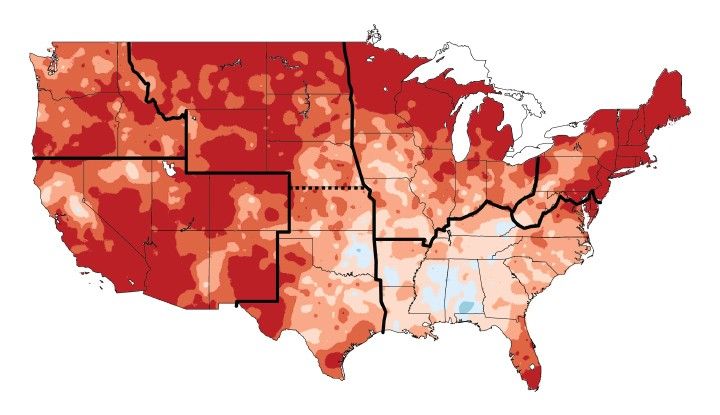
Among the changes is an increase in temperature, as illustrated in the above image. Since consistent record-keeping began in 1895, the average temperature in the United States has increased by 1.3 to 1.9 degrees Fahrenheit (0.8 to 1.1° Celsius), and most of that change has happened since 1970. The warmest year on record for the United States was 2012. The map above shows temperature changes between 1991 and 2012 compared to the average temperature between 1901 and 1960. Bold lines divide the country into regions, and the change is uneven across the regions. “Multiple lines of independent evidence confirm that human activities are the primary cause of the global warming of the past 50 years,” says the report.
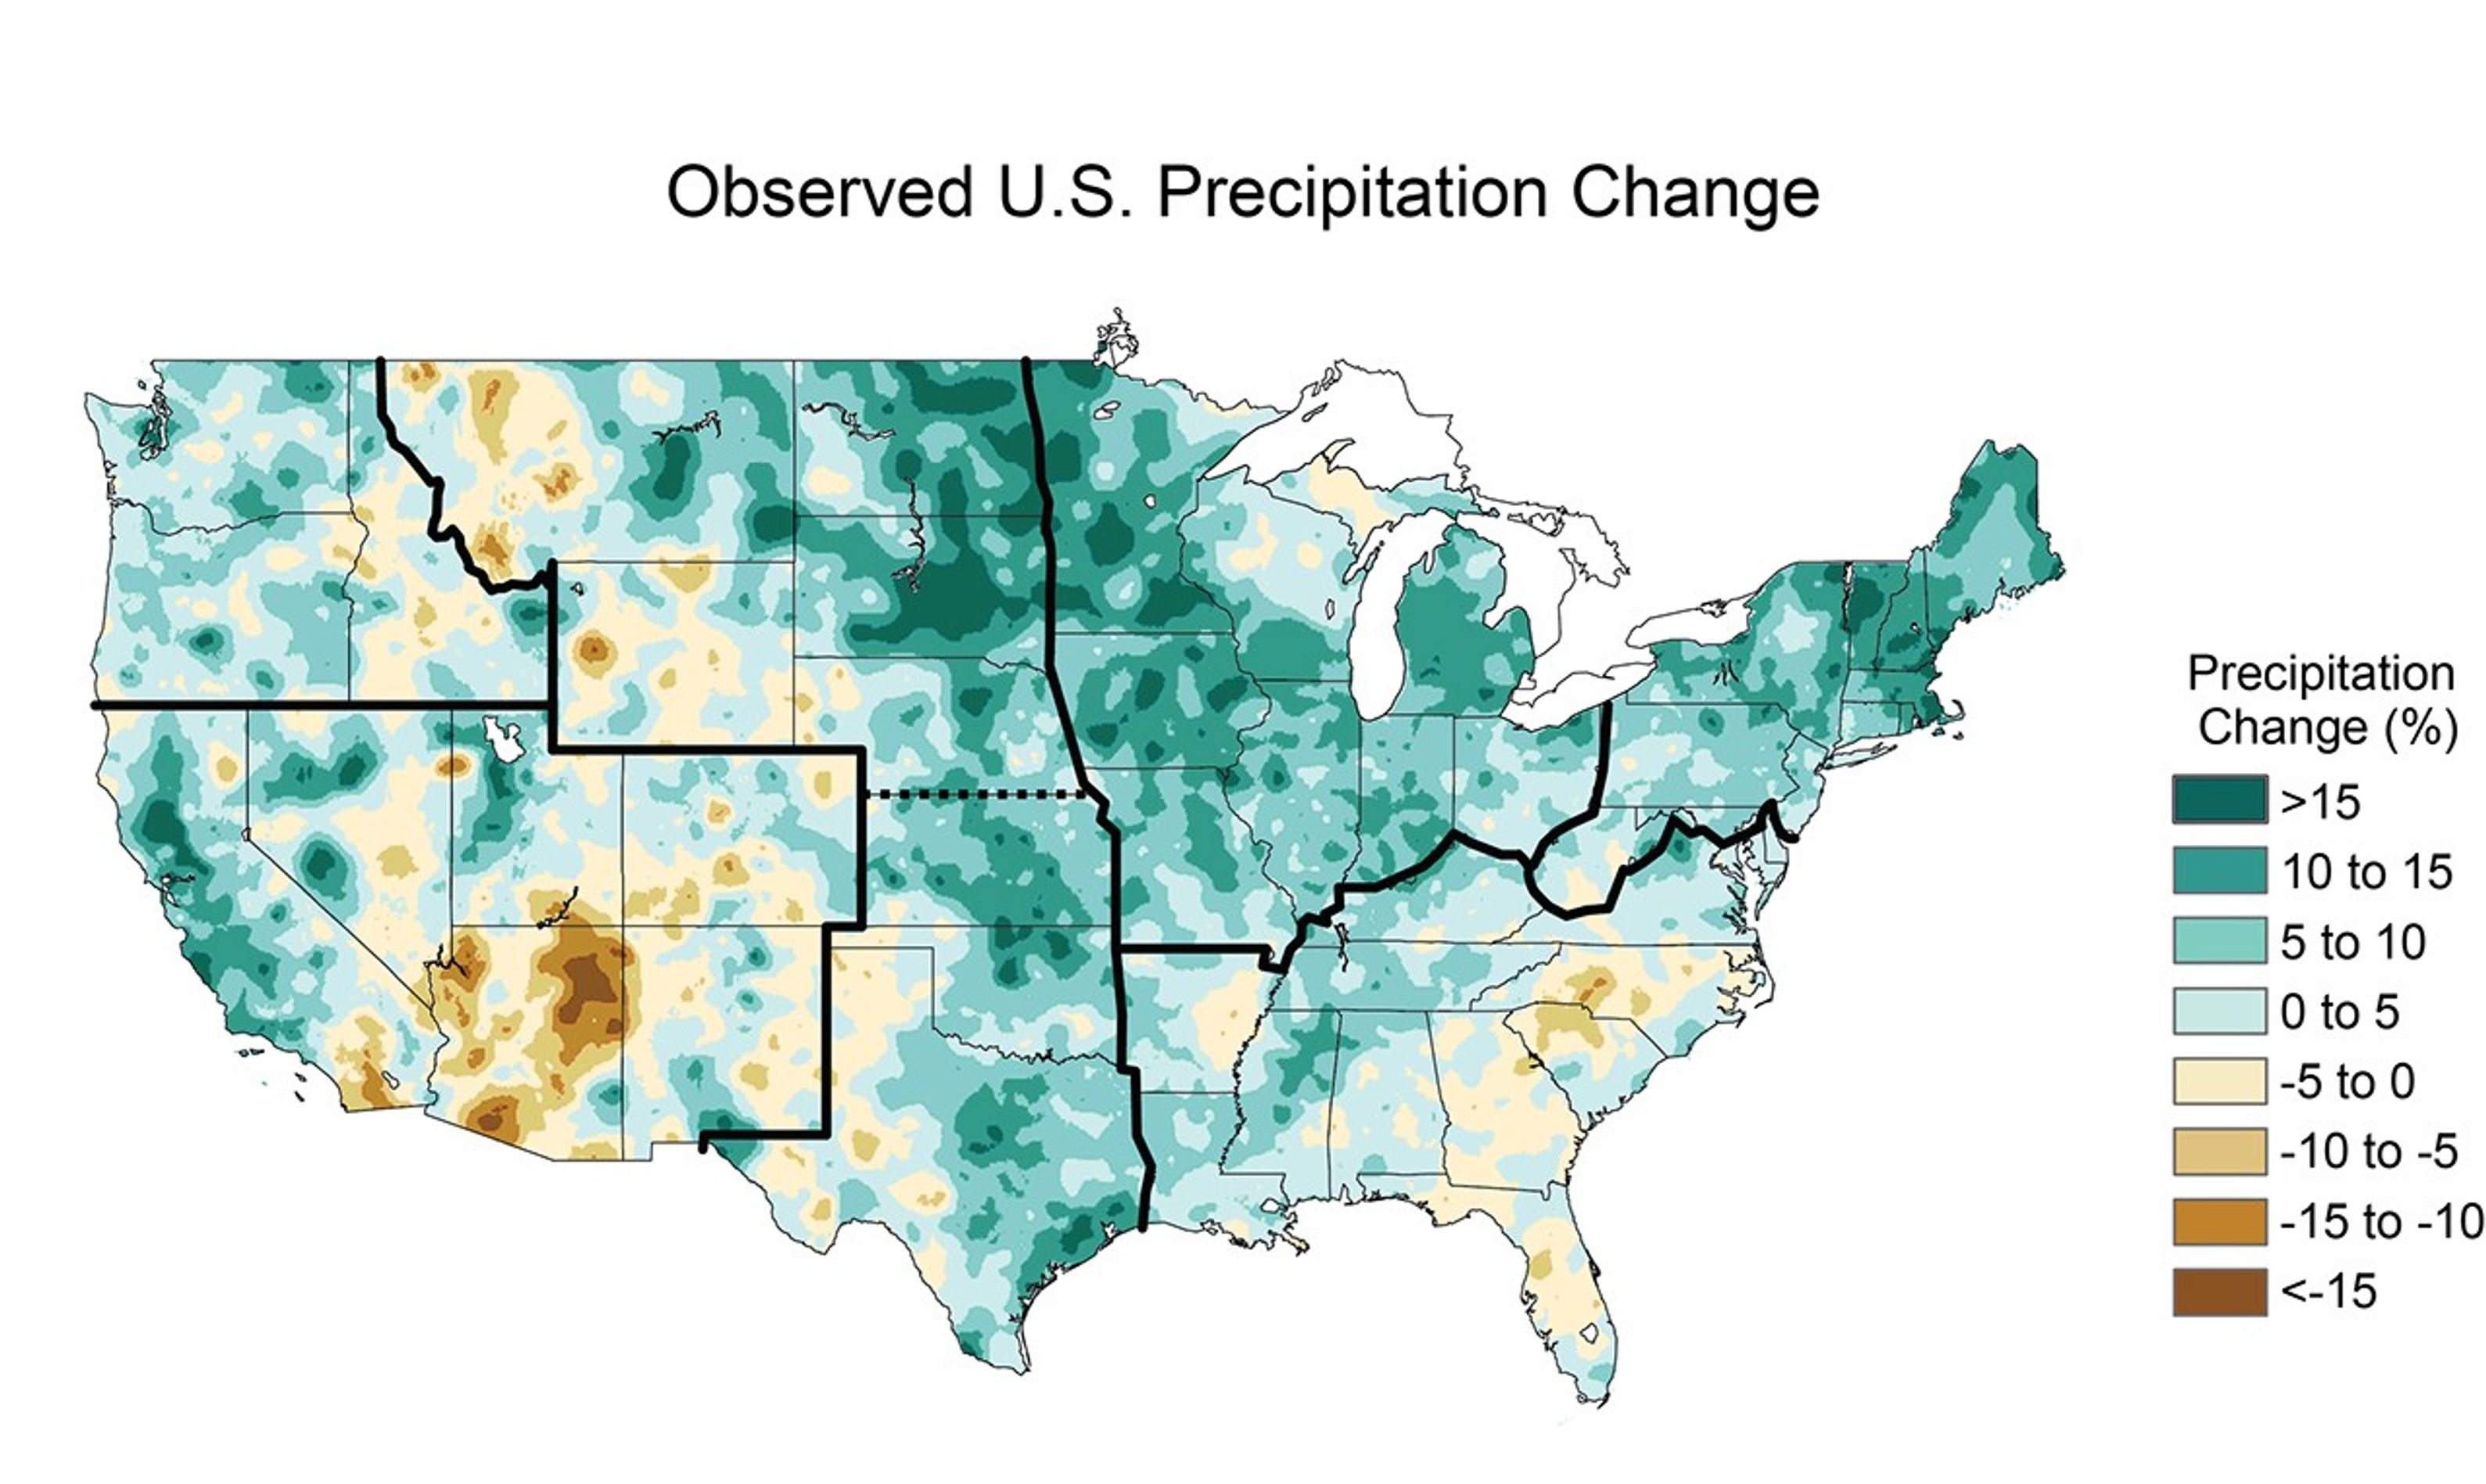
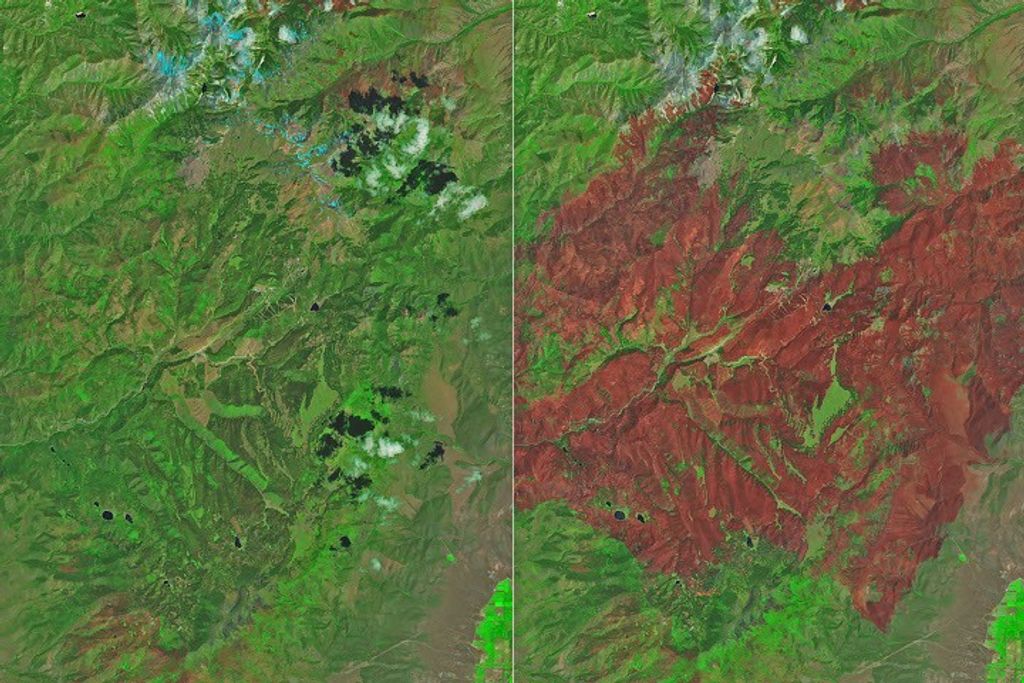
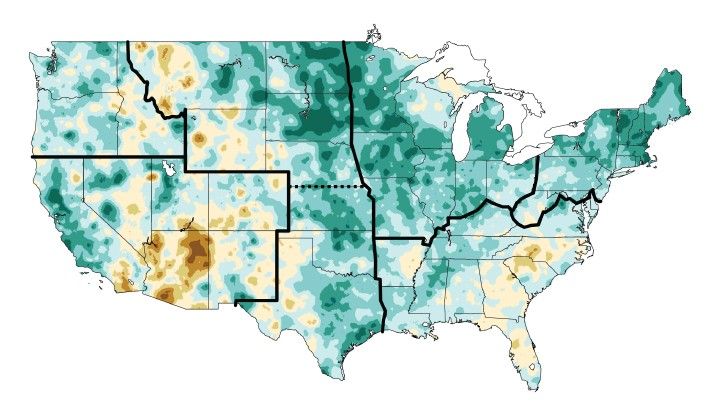
Scientists also observed changes in precipitation. On average, precipitation has increased since 1900, but some areas have gotten drier. This map shows how much precipitation changed between 1991 and 2012 compared to the average precipitation observed between 1901 and 1960. While there is an increase, it is harder to attribute the change to human activity, since rain and snowfall totals vary widely from year to year. For example, significant droughts in the 1930s and 1950s dropped the average precipitation for the earlier period, making recent years seem much wetter in comparison.
However, if warming continues, climate models project that wet areas will continue to get wetter while dry areas will get drier. The changes will include more frequent downpours, floods, droughts, and heat waves. In fact, heavy rainfall events have already become more common throughout the United States, while heat waves and droughts have become more frequent and intense, particularly in the West.
Additional findings discuss the impacts of climate change on a variety of sectors, including human health, infrastructure, water quality and availability, agriculture, ecosystems, and the ocean. The report also looks at actions being taken to prepare for impacts and to mitigate future changes.
References & Resources
- U.S. Global Change Research Program (2014) Climate change impacts in the United States. Accessed May 7, 2014.
Temperature and precipitation images courtesy the U.S. Global Change Research Program. Caption by Holli Riebeek.