


Over the course of a week in July 2015, a series of cyclones lined up across the Pacific Ocean: Linfa, Chan-hom, Nangka, and finally Ella. As of July 10, the strongest storm approaching land was Typhoon Chan-hom, which barreled westward toward China.
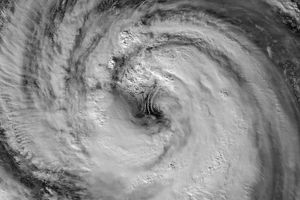
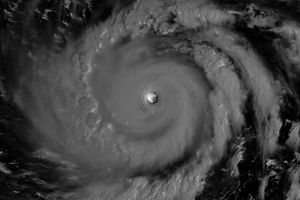
The strength of Chan-hom is evident in these images, produced with measurements from the International Space Station-Rapid Scatterometer (ISS-RapidScat). Arrows represent the direction of near-surface winds. Shades of blue indicate the range of wind speeds (lighter blue and green represent faster-moving winds).
ISS-RapidScat works by reflecting microwave pulses off the ocean surface and back toward the sensor. Rough waters—those disturbed more by wind—return a stronger signal than smooth waters. From that information, scientists can derive wind speed, as well as its direction based on the position of the waves. The nature of this measurement method means RapidScat is describing the winds close to the ocean’s surface. Higher up in a storm, winds can be even faster.
The left image was acquired at about 4 a.m. China Standard Time on July 8 (20:00 Universal Time on July 7). Wind speeds of the Category 1 storm measured about 145 kilometers per hour (90 miles per hour) according to Unisys Weather. The right image shows a more recent view of the storm, acquired at about 3:30 a.m. CST on July 10 (1930 UTC July 9). Chan-hom had strengthened to a Category 4 storm with wind speeds of about 210 kilometers per hour (130 miles per hour).
Landfall was expected to occur on July 11 along China’s eastern coast. Prior to landfall, news outlets reported that thousands of people were evacuated and transportation services were suspended in coastal areas. The potential storm surge was a major concern, particularly in the densely populated city of Shanghai. According to meteorologist and blogger Jeff Masters, this region of China is not accustomed to storms like Chan-hom, which had the potential to be one of the strongest typhoons on record for the area.
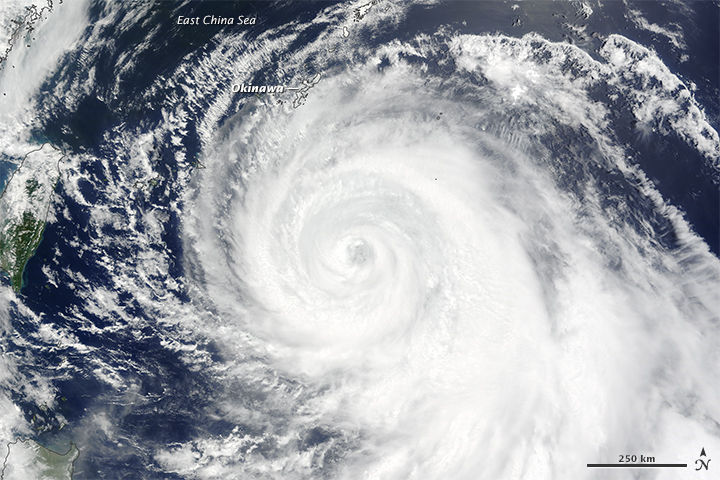
In addition to wind observations from ISS-RapidScat, imagery from the Moderate Resolution Imaging Spectroradiometer (MODIS) on NASA’s Terra satellite (above) shows a true-color view of the typhoon on July 9.
Meanwhile, 144 images combined from Japan’s Himawari-8 weather satellite shows an even broader view, demonstrating the progression of Chan-hom and neighboring storms over the course of a single day.
References & Resources
- Discover: ImaGeo (2015, July 7) WATCH: Chorus Line of Cyclones Marching Across the Pacific. Accessed July 10, 2015.
- The Guardian (2015, July 10) China issues highest-level alert as Chan-hom heads for south-eastern coast. Accessed July 10, 2015.
- Mashable (2015, July 10) Shanghai prepares for potentially historic storm surge from Typhoon Chan-hom. Accessed July 10, 2015.
- NASA’s Jet Propulsion Laboratory ISS-RapidScat.
- The New York Times (2015, July 10) Japan’s New Satellite Captures an Image of Earth Every 10 Minutes. Accessed July 10, 2015.
- Unisys (2015, July 10) Typhoon-4 Chan-hom. Accessed July 10, 2015.
- Weather Underground News & Blogs: Dr. Jeff Masters (2015, July 10) Category 3 Chan-hom: One of Shanghai’s Strongest Typhoons on Record?. Accessed July 10, 2015.
NASA Earth Observatory maps (top) by Joshua Stevens, using RapidScat data from the Jet Propulsion Laboratory . NASA image (bottom) by Jeff Schmaltz, LANCE/EOSDIS Rapid Response . Caption by Kathryn Hansen.