


![Request for Information – Potential [Placeholder for Prize]](https://assets.science.nasa.gov/dynamicimage/assets/science/psd/solar/2023/09/s/solarsystem_0.jpg?w=1024)


Landsat 8 – USGS EROS Archive
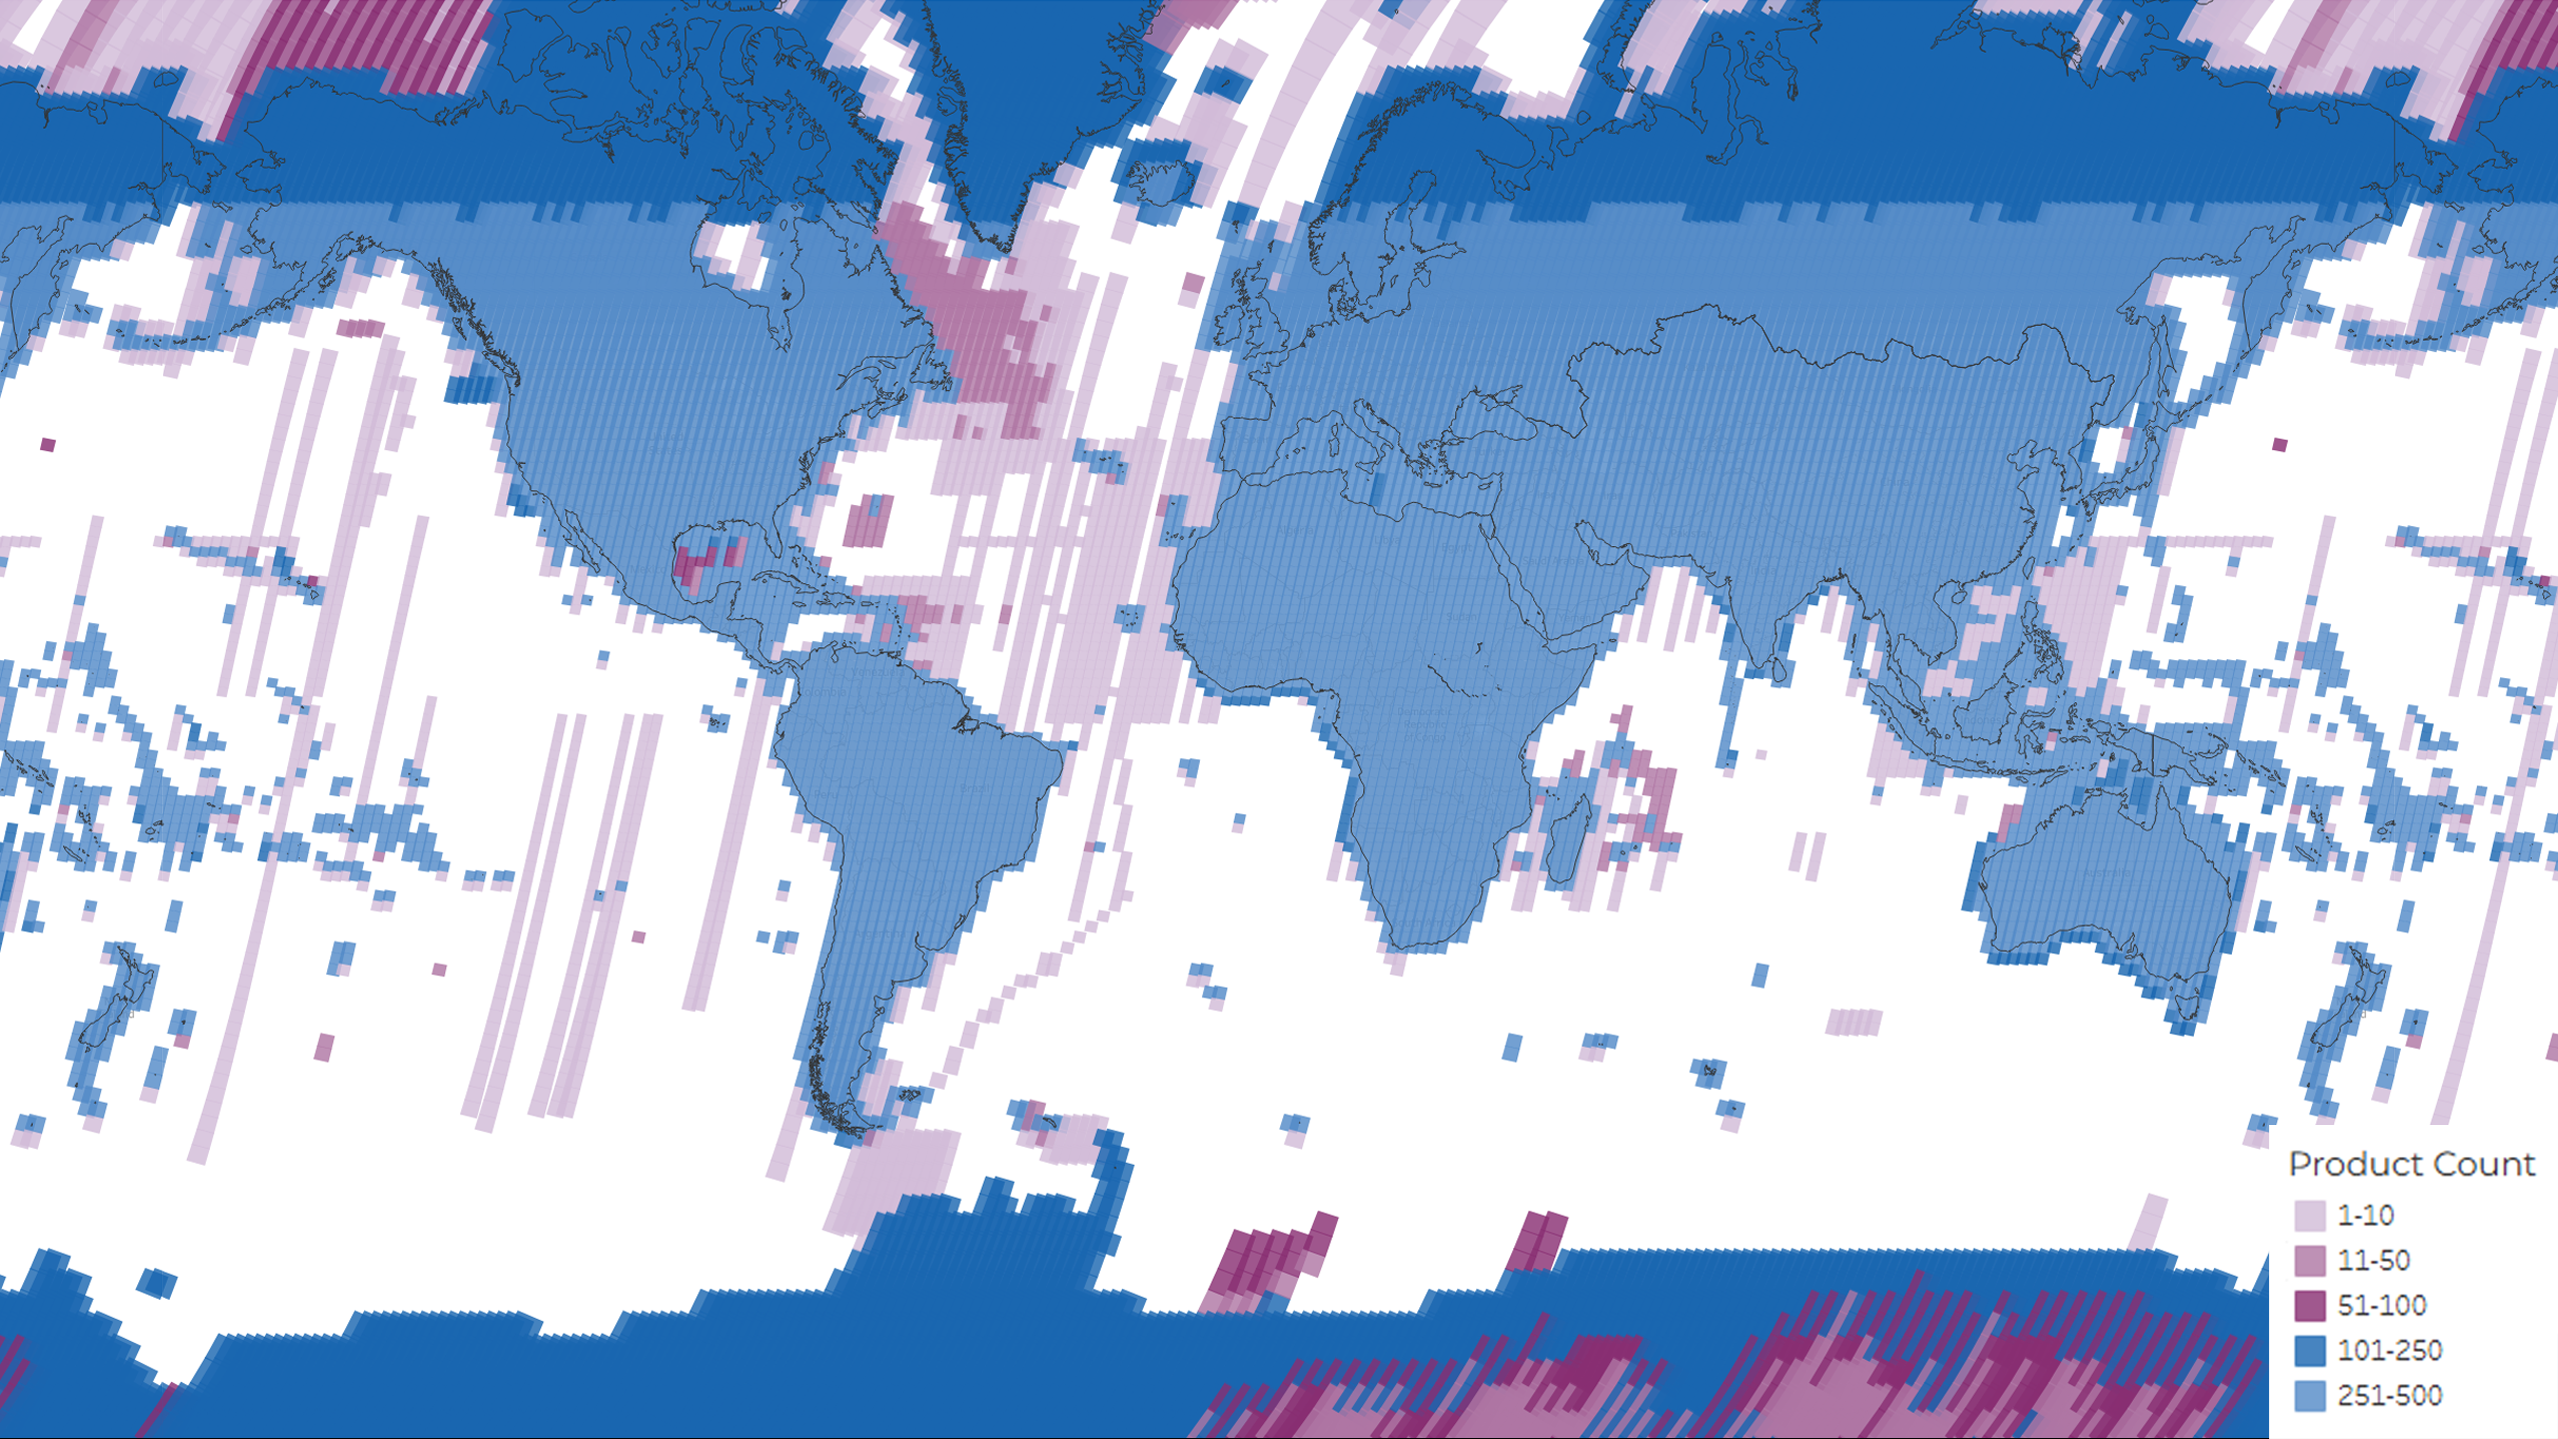
A density map showing the distribution of the total 3,052,414 OLI/TIRS scenes acquired and archived during the lifetime of the Landsat 8 mission. The colors represent the number of products per Path/Row.
Image Credit: USGS
- X
https://science.nasa.gov/image-detail/amf-edfd270a-e6e1-4fc6-a967-fedeb0ebb834/
Image CreditUSGS
Size2558x1439px