


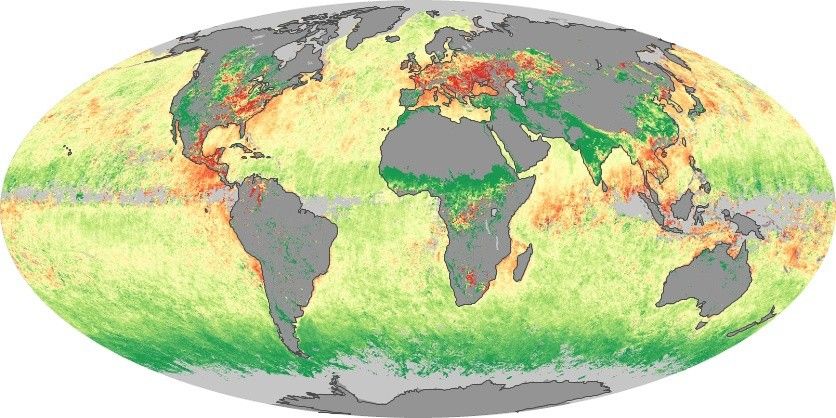
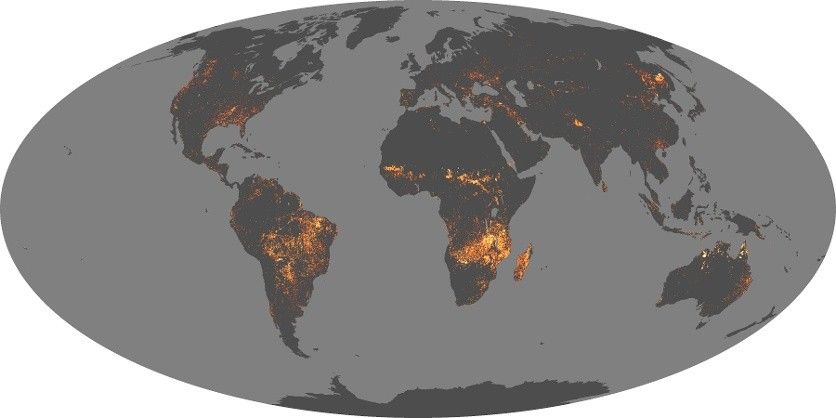
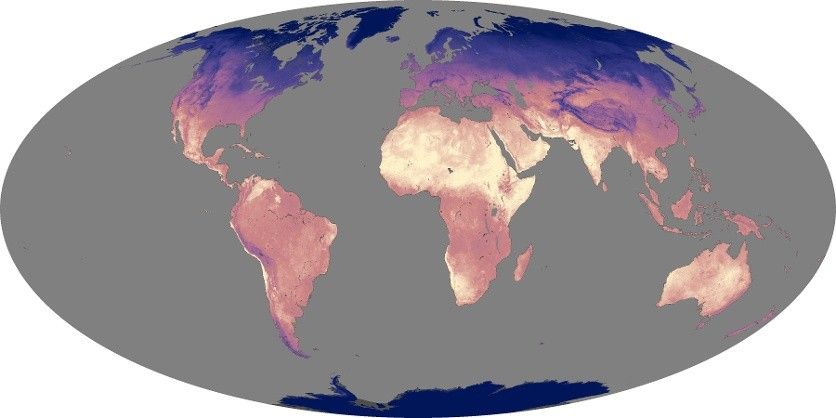
Vegetation
More from the Earth Observatory
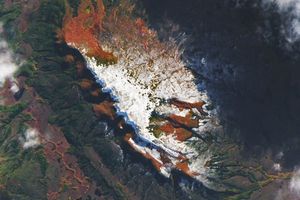
Fiery Fall Color in Southern Chile
The beech forests of southern Patagonia put on vibrant autumn displays.
Apr 28, 2026
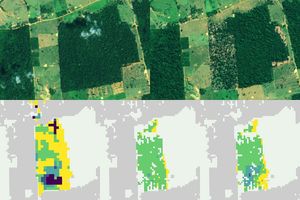
Faster Detection of Forest Loss
Scientists pioneered a new system that combines data from multiple Earth-observing satellites to identify forest clearing up to 100 days…
Apr 6, 2026
A Fault Line in Full Bloom
Plains around the San Andreas Fault and across Carrizo Plain National Monument are awash with yellow as wildflowers bloom.
Mar 23, 2026


