Suggested Searches

5 min read

Scientists Use NASA Data to Predict Solar Corona Before Eclipse

Editor’s Note: This story was updated to correctly reference which NASA supercomputer was used.

Our Sun, like many stars, is adorned with a crown. It’s called a corona (Latin for “crown” or “wreath”) and consists of long, thread-like strands of plasma billowing out from the Sun’s surface. The powerful magnetic field of the Sun defines these strands, causing them to ripple and evolve their structures constantly. The strands are faint, however, so the only way to observe the corona with the naked eye is during a total solar eclipse.

In anticipation of the solar eclipse on April 8, 2024, scientists at Predictive Science are using data from NASA’s Solar Dynamics Observatory (SDO) to predict what our Sun’s crown may look like on that day. What’s more, their model uses the computational efforts of NASA’s Electra Supercomputer to update its predictions in near real-time. This means that the model continuously updates its predictions as it ingests data beamed down from SDO, providing information as close to real-time as possible.

The Sun is near the maximum phase of the solar cycle, so the solar magnetic field is evolving rapidly. This predictive model is updated in near real-time with the latest measurements of the surface magnetic field. This animation shows how the Sun and the prediction are evolving with time. Credits: Predictive Science Inc.

The solar corona is our star’s outer atmosphere. It “extends out into interplanetary space as the solar wind,” said Predictive Science president Jon Linker. Driven by heat and magnetic turbulence in the Sun, this wind blows out to the edges of the solar system. “It envelopes the planets,” Linker said, “including Earth.”

As Earth and other planets bathe in coronal outflow, their atmospheres react to the energetic particles and magnetic fields found within the solar wind. This reaction, called space weather, can range from mild to severe, just like terrestrial weather. Extreme space weather events, such as large solar eruptions called coronal mass ejections, can disrupt important communications technology, affect astronauts in orbit, or even harm the electric grids we all rely on.

A visualization showing some of the effects the Sun's activity can have on technology and infrastructure. At top of the image, an orange sun in space shows active flares. Energetic electrons are shown damaging spacecraft electronics orbiting Earth. Solar flare protons are also shown damaging orbiting spacecraft electronics, but also causing radiation effects on avionics and communications and GPS signal scintillation. On land, enlarged power lines represent geomagnetically induced currents in power systems. In water, enlarged images of a submarine and offshore pipeline facility represent induced effects in submarine cables and telluric currents in pipelines, respectively.
Modern society depends on a variety of technologies that are susceptible to the extremes of space weather. This graphic shows some of the technology and infrastructure affected by space weather events.
NASA’s Goddard Space Flight Center

Space weather is one of the most tangible effects of the Sun’s dynamic exterior, and creating accurate forecasts is something scientists are striving toward. According to Linker, refining these solar models helps build the foundation for forecasting. “If you’re going to predict the path of a coronal mass ejection, just like for a hurricane, to have this more accurate background is really important,” he said.

SDO and other solar observatories provide detailed insights about the corona, but scientists are still missing some vital information about the forces that drive its activity, which is needed to predict the corona’s appearance with precision. “We don’t have a way of measuring the magnetic field accurately in the corona,” said Emily Mason, a research scientist at Predictive Science. “That’s one of the things that makes this so challenging.”

To build their model, researchers at Predictive Science use measurements of the Sun’s changing magnetic field at the solar surface to drive their model in near real-time. A key to this innovation was creating an automated process that converts raw data from SDO to show how magnetic flux and energy are injected into the corona over time. Adding this dynamic into the model allows the corona to evolve over time, leading to solar eruptions. “We developed a software pipeline that took in the magnetic field maps, picked out all of the areas that should be energized, and then fine-tuned the amount of energy to add to those areas,” Mason said. Building this automatic pipeline was a huge step forward for the team. In past predictions, the model used a static snapshot of the surface magnetic field – not ideal for keeping up with the ever-changing Sun, especially during our current heightened period of solar activity. Similarly, in iterations from 2017 and 2021, Mason explained that a teammate used to “literally hand-draw which areas on the Sun needed to be energized” by analyzing extreme ultraviolet activity in certain regions. Continuously updating the magnetic field is central to all of the changes with this year’s model, and the team has high hopes for the results.

Prediction
Actual
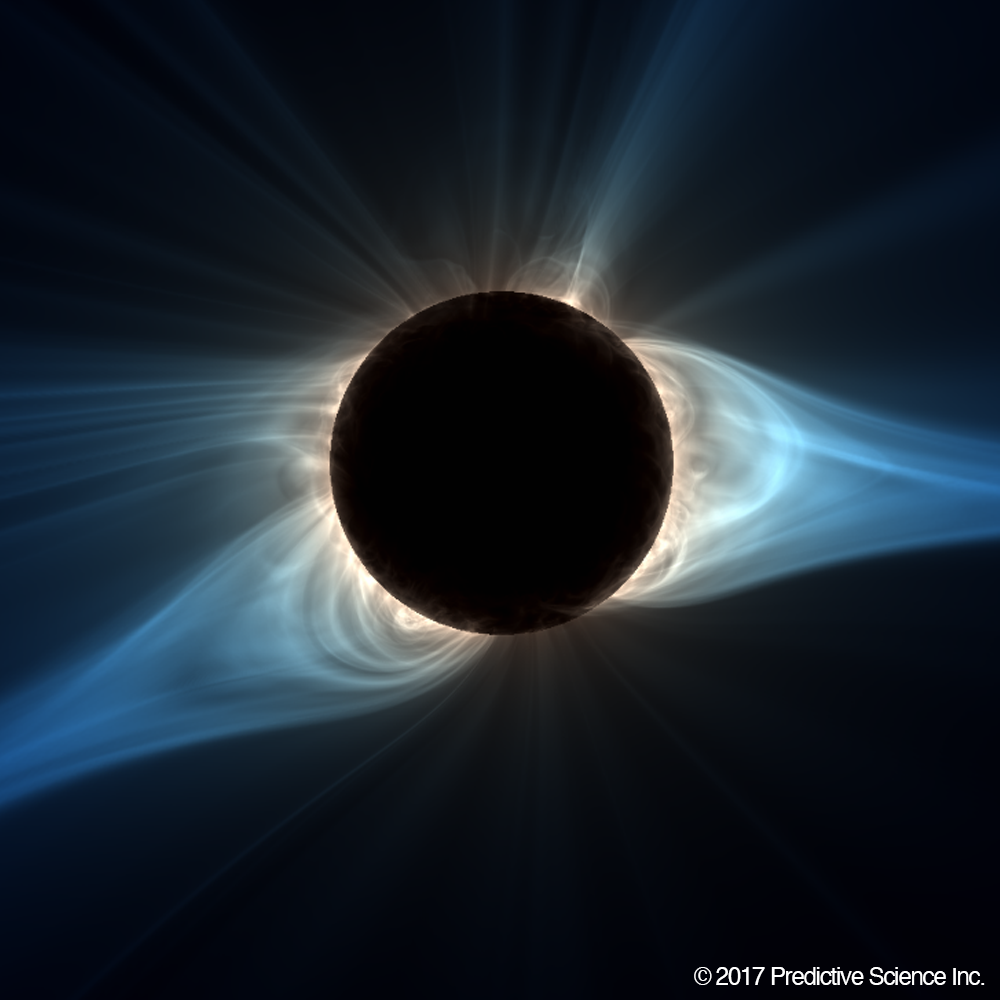
A model of the total solar eclipse from 2017 shows the solar corona with the magnetic field highlighted in white against a dark black background. The structures seen in the predictive model closely match the structures seen in the image of the actual corona.
Predictive Science’s coronal prediction for the 2017 total solar eclipse.
Predictive Science, Inc.
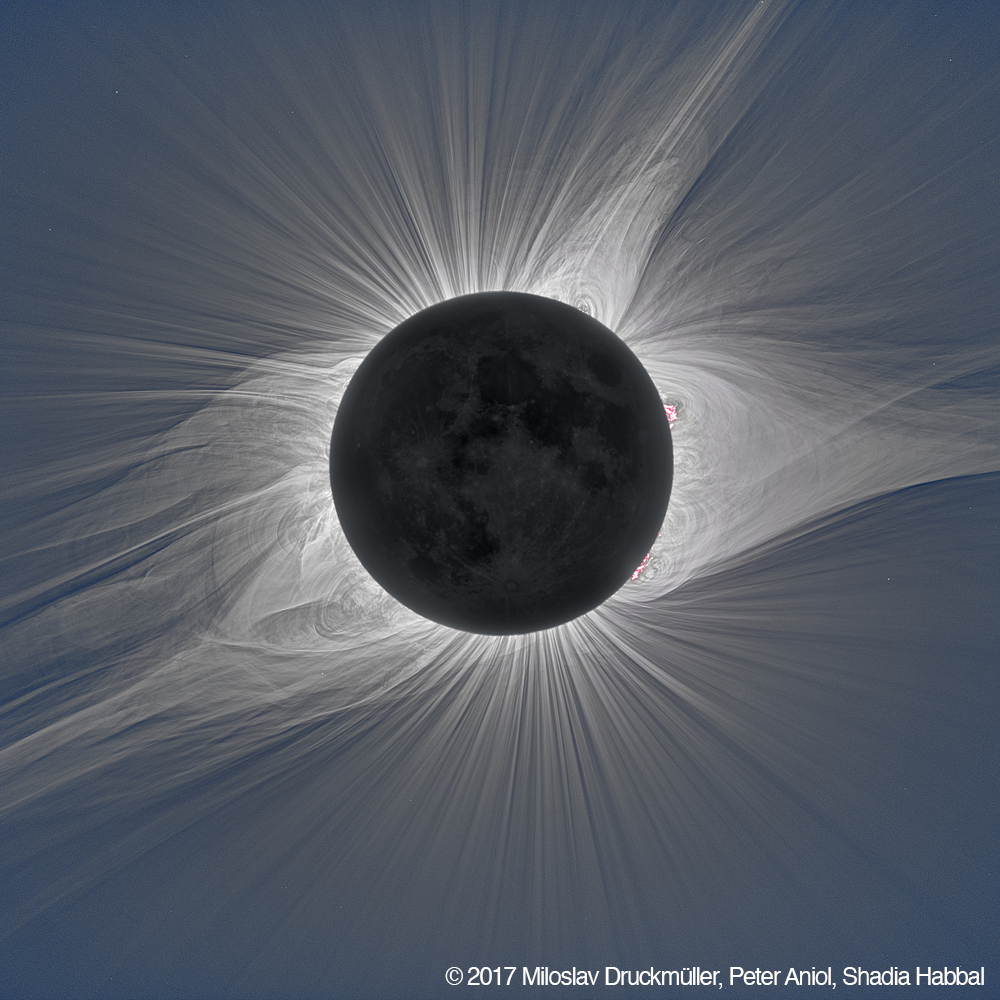
A processed image of the total solar eclipse from 2017 shows the moon completely covering the disk of the Sun. Encircling the moon, the solar corona can be seen in white light with well-defined structures.
A composite image of the actual corona from the 2017 total solar eclipse.
Miloslav Druckmüller, Peter Aniol, Shadia Habbal/NASA Goddard, Joy Ng
Prediction
Actual

2017 Total Solar Eclipse

Corona Prediction and Actual Composite Image

Predictive Science’s coronal prediction for the 2017 total solar eclipse and a composite image of the actual corona from the 2017 total solar eclipse. Credits: Predictive Science Inc. and Miloslav Druckmüller, Peter Aniol, Shadia Habbal

Downloads

Image 1 (JPG) ### KB

The recurrence of total solar eclipses provides opportunities to test the accuracy of their models against real-life conditions and update them accordingly. “We’ve used the eclipse predictions every time to do something new with the model,” said Cooper Downs, a research scientist at Predictive Science who orchestrated the automated modeling pipeline. “I’m really excited to see over the next two weeks how this prediction keeps improving. I think it will be a really drastic difference from what we used to be able to do.”

Mason shares his enthusiasm. “The eclipse is just such a fantastic chance to go, ‘Look at this! This is what we think it’s gonna look like! Don’t you want to learn more about this?” she said with a grin. “It’s a really exciting opportunity for us to share the things that excite us all year round with everybody else.”

By Rachel Lense
NASA’s Goddard Space Flight Center, Greenbelt, Md.