![A satellite viewpoint of the United States in black with state outline overlays has a pixelated colorscale overlay indicating how much methane was released in a given area that ranges from black or dark brown into brassier colors until you reach white. While most of the map is a very dark shade, indicating little methane emissions, there are a few spots on the map that range into, or very nearly reach a white coloration. The two most significant of these white spots in size and lightness are in Texas Eastern and Western Borders. Other large population centers also show elevated levels such as the California Valley and Bay Area.](https://science.nasa.gov/wp-content/uploads/2023/06/methane-trop-2019.jpg)
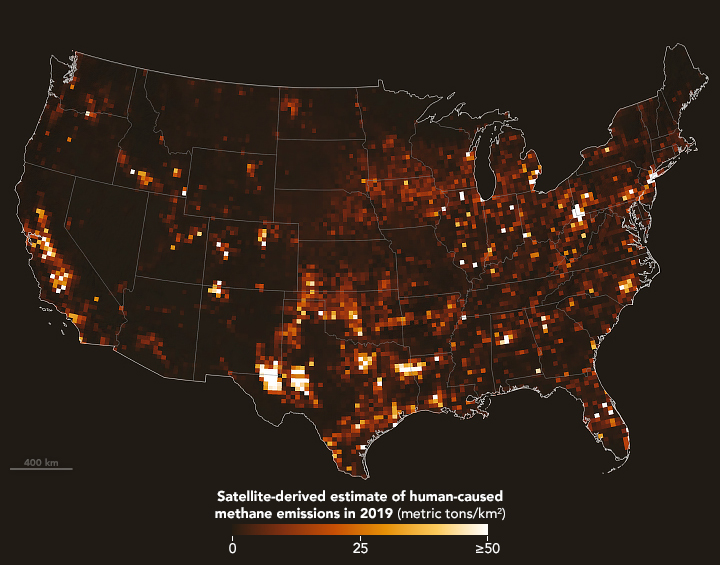
Satellite Data Suggest U.S. Methane Emissions Underestimated
Emissions of the potent greenhouse gas may be higher than previously thought, especially from landfills. View the full story
Image Credit: NASA Earth Observatory / Michala Garrison
- X
https://science.nasa.gov/image-detail/methane-trop-2019/
TakenDecember 31, 2019
Image CreditNASA Earth Observatory / Michala Garrison
Size720x565px