


.png?w=1024)


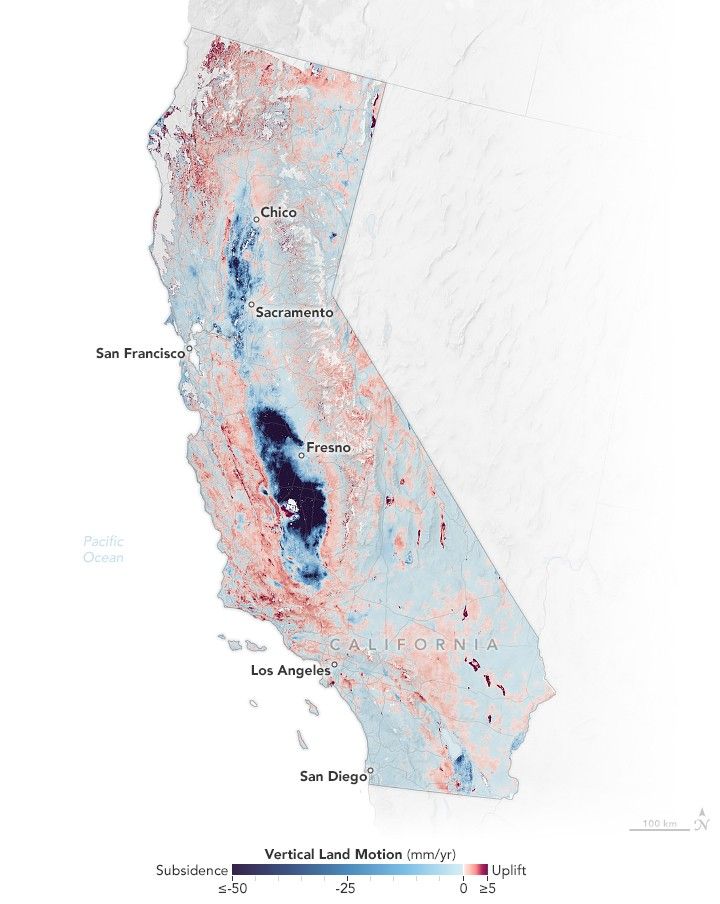
Where California’s Land Is Sinking and Rising
The elevation changes may seem small, amounting to fractions of inches per year, but they can increase or decrease local flood risk, wave exposure, and saltwater intrusion.
- X
https://science.nasa.gov/image-detail/amf-3cfafc7e-3223-47f9-be25-7fd76026c03c/
Size720x904px
