


Mapping to Make Sense of Pluto
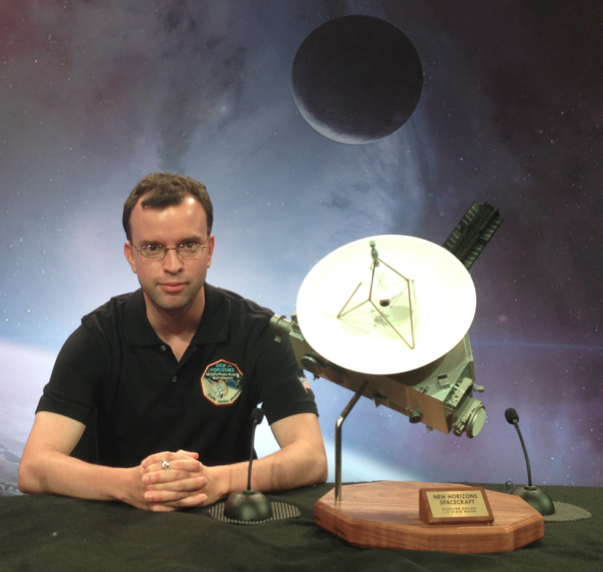
Today’s blog post is from Oliver White, a postdoctoral researcher in planetary science at NASA Ames Research Center in Mountain View, California. He studies the geomorphology and surface processes of planetary bodies in the outer solar system.
Looking at the surface of a planet or moon for the first time can be bewildering, particularly when confronted by a variety of terrains and landforms. This is certainly what NASA’s New Horizons team felt when we received the first close-up pictures of Pluto after the flyby in July 2015. None of us were expecting to see such a diverse range of landforms like mountains and glaciers of exotic ice on such a small, cold and distant world.
After flyby our challenge was to piece together the geological history of Pluto’s surface—that is, to determine what processes have formed and modified each terrain, and when these processes occurred relative to one another.
In order to accomplish this, planetary scientists create geological maps of the surfaces of distant bodies. The New Horizons spacecraft flew past Pluto at a range of several thousand miles/kilometers. As such, creating a geological map of a planetary surface like Pluto’s is more challenging than creating a map for one on Earth. Of course, we’re unable to walk around on Pluto and pick up samples in order to analyze what they are and how they have been processed. Instead, we must rely entirely on spacecraft images and other remote sensing data to create a Pluto map. For example, compositional data provided by the Ralph/Multispectral Visible Imaging Camera (MVIC) and the Linear Etalon Imaging Spectral Array (LEISA) are extremely useful for mapping Pluto. Knowing the composition of a unit helps constrain what physical properties it has and, therefore, how it likely formed and was modified over time. The compositional data are the closest we have to possessing an ice sample from each of the different terrains on Pluto.
The colored map shown above is just such a map that I have created for the region of the encounter hemisphere on Pluto that covers the huge nitrogen ice plains informally named Sputnik Planum and the terrain immediately surrounding it. The map shows New Horizons imagery of this area, overlaid with colors that represent different geological terrains, or units. The black and white image below shows the New Horizons imagery, along with latitude and longitude lines and a scale bar.
I have studied this area in great detail, and have defined each unit based on its texture and morphology—for example, whether it is smooth, pitted, craggy, hummocky or ridged. How well a unit can be defined depends on the resolution of the images that cover it. All of the terrain in my map has been imaged at a resolution of approximately 1,050 feet (320 meters) per pixel or better, meaning textures are resolved such that I can map units in this area with relative confidence.
By studying how the boundaries between units crosscut one another, I can also determine which units overlie others, and assemble a relative chronology (or timeline) for the different units; this work is aided by crater counts for the different terrains that have been obtained by other team members. I caution that owing to the complexity of the surface of Pluto, the work I’ve shown is in its early stages, and a lot more is still to be done.
My mapping project, which began only a few days after the flyby, is currently expanding across the rest of Pluto’s encounter hemisphere. Mapping a place as interesting as Pluto has been a highly engaging, thought-provoking and fun experience. When I was an undergraduate studying planetary science, filling in my first planetary geological map of a region on Mars with coloring pencils, I never imagined that a decade later I would be making the first geological map of this world that had been a tantalizing enigma for so long!