


A Picture of Pluto is Worth a Thousand Words
Today’s blog is from Veronica Bray, a planetary scientist at the Lunar and Planetary Laboratory in Tucson. She specializes in comparing the surfaces of planetary bodies across the solar system, especially through the study of impact craters.
A spacecraft flies to Pluto, amazing images of this alien disk are sent back to Earth for us to enjoy, and suddenly scientists are telling us about what Pluto is made of—that it has different layers in its crust, that one part of the Pluto crust is weaker or stronger, or older or younger than another. How can that information be gained from photos?
Well, in part the answer is that many other kinds of data—like compositional and atmospheric spectra – were also obtained, but this blog post gives one example of how the New Horizons team is using the spectacular images to investigate the surface of Pluto. As my specialty is impact cratering, you know what I’ll be talking about.
When a comet or other object collides with Pluto, the speed of the impact is typically faster than a bullet. As a result, such collisions create an explosion that excavates a large hole in the surface—an impact crater. Depending on the size, speed and density of the impactor, as well as the near-surface properties of Pluto, the resultant craters can look very different from one another. As part of my work with the New Horizons team, I have been using the study of impact craters as a tool for investigating the physical properties of the Plutonian crust. I do this first by measuring the dimensions of different craters on Pluto from the Digital Terrain Models (DTMs), created from New Horizons images by my awesome team members! The figure below shows a topographic profile of the informally-named Elliot crater, whose namesake is the late Pluto researcher Jim Elliot of MIT.
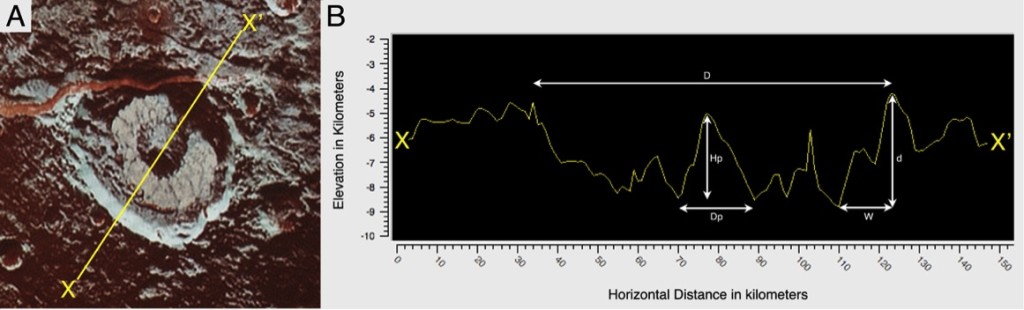
From this profile I can measure all the important dimensions, including:
Depth (d) and Diameter (D). When measuring a newly formed crater, a lower depth/diameter ratio can point to a weaker or warmer target surface. The depth/diameter value (and the other crater dimensions listed below) is also affected by the gravity of the target body and the age of the crater, as craters tend to shallow with time. So, depth/diameter can also be used to gauge the relative age of the different craters on Pluto.
- The central peak height (Hp) and width (Dp). These can tell us about how much uplift of material from depth has occurred at the impact site. When I compare this ratio to the uplifts seen in other craters across the solar system, I can tell whether the Pluto near sub-surface is weaker or stronger than on other bodies. I can also compare central peak craters across Pluto: two craters of the same size with different central peaks might be telling me that the one with the larger peak was formed by a higher velocity impact, or that the Pluto surface is weaker or warmer in that location.
- The height of crater rims (measured from the surrounding terrain level). This offers indirect evidence of the extent of crater wall collapse. When comparing two craters of the same diameter, a lower rim height suggests that more collapse has occurred and might point towards the upper levels of the Pluto crust in that area being weaker than for areas with greater rim heights.
- The average slope angle (d/W). Although the walls of craters can be complicated, including scarps, terraces and scree slopes segments (all of which can provide their own information on the material strength and target structure), we can also gain knowledge from a more simple measurement: the average slope angle, as it is a proxy for the ‘effective’ coefficient of friction during the process of impact crater formation.
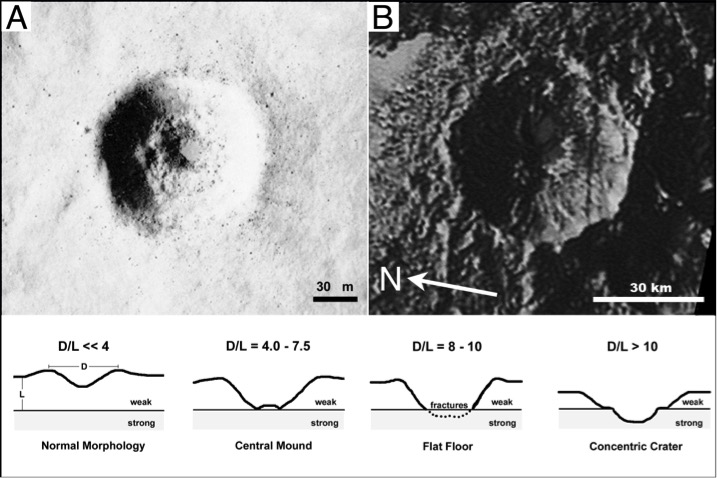
- Crater Diameter of ‘benched craters’ can be used to estimate the thickness of layers – as seen in the figure below – within the Pluto crust. This is an especially exciting crater dimension to study as it gives a specific value – the upper layer thickness. We can then start to hypothesize on why this layering is there. Is it deposition from the atmosphere, snowing down on the surface? Is it bombardment from the solar wind breaking down the upper layer of the crust to make a regolith, like we see on the moon?
I’m currently measuring crater dimensions on Pluto and other icy bodies so that I can compare them to one another and also to existing measurements of craters on rocky bodies such as Earth’s moon. Once I have these measurements and the topographic profiles in hand, I can also use them to compare to my computer modelling results in which I simulate the impact process in various targets (different materials, different sets of layers, whatever I want). There are thousands of craters on Pluto waiting for me to measure them. I’d better get started!
If you would like to read more about how to use impact crater measurements to study the surfaces of moons and planets, I suggest the following references:
Bray, V. J., G. S. Collins, J. V. Morgan and P. M. Schenk (2008). The Effect of Target Properties on Crater Morphology: Comparison of Central Peak Craters on the Moon and Ganymede, Meteoritics and Planetary Science, Vol. 43, No. 12, pp. 1979-1992. PDF Here
Quaide, W. L. and Oberbeck, V. R. 1968. Thickness determinations of the lunar surface layer from lunar impact craters. J. Geophys. Res. 73:5247-5270. PDF Here.
Osinski, G. R. and Pierazzo, E. (2012). Impact cratering: Processes and Products. ISBN: 978-1-4051-9829-5, 330 pages, Published December 2012, Wiley-Blackwell.
Melosh, H. J. 1989 Impact cratering: a geologic process. 245 pages, Oxford University Press.