Dark Energy Explorers

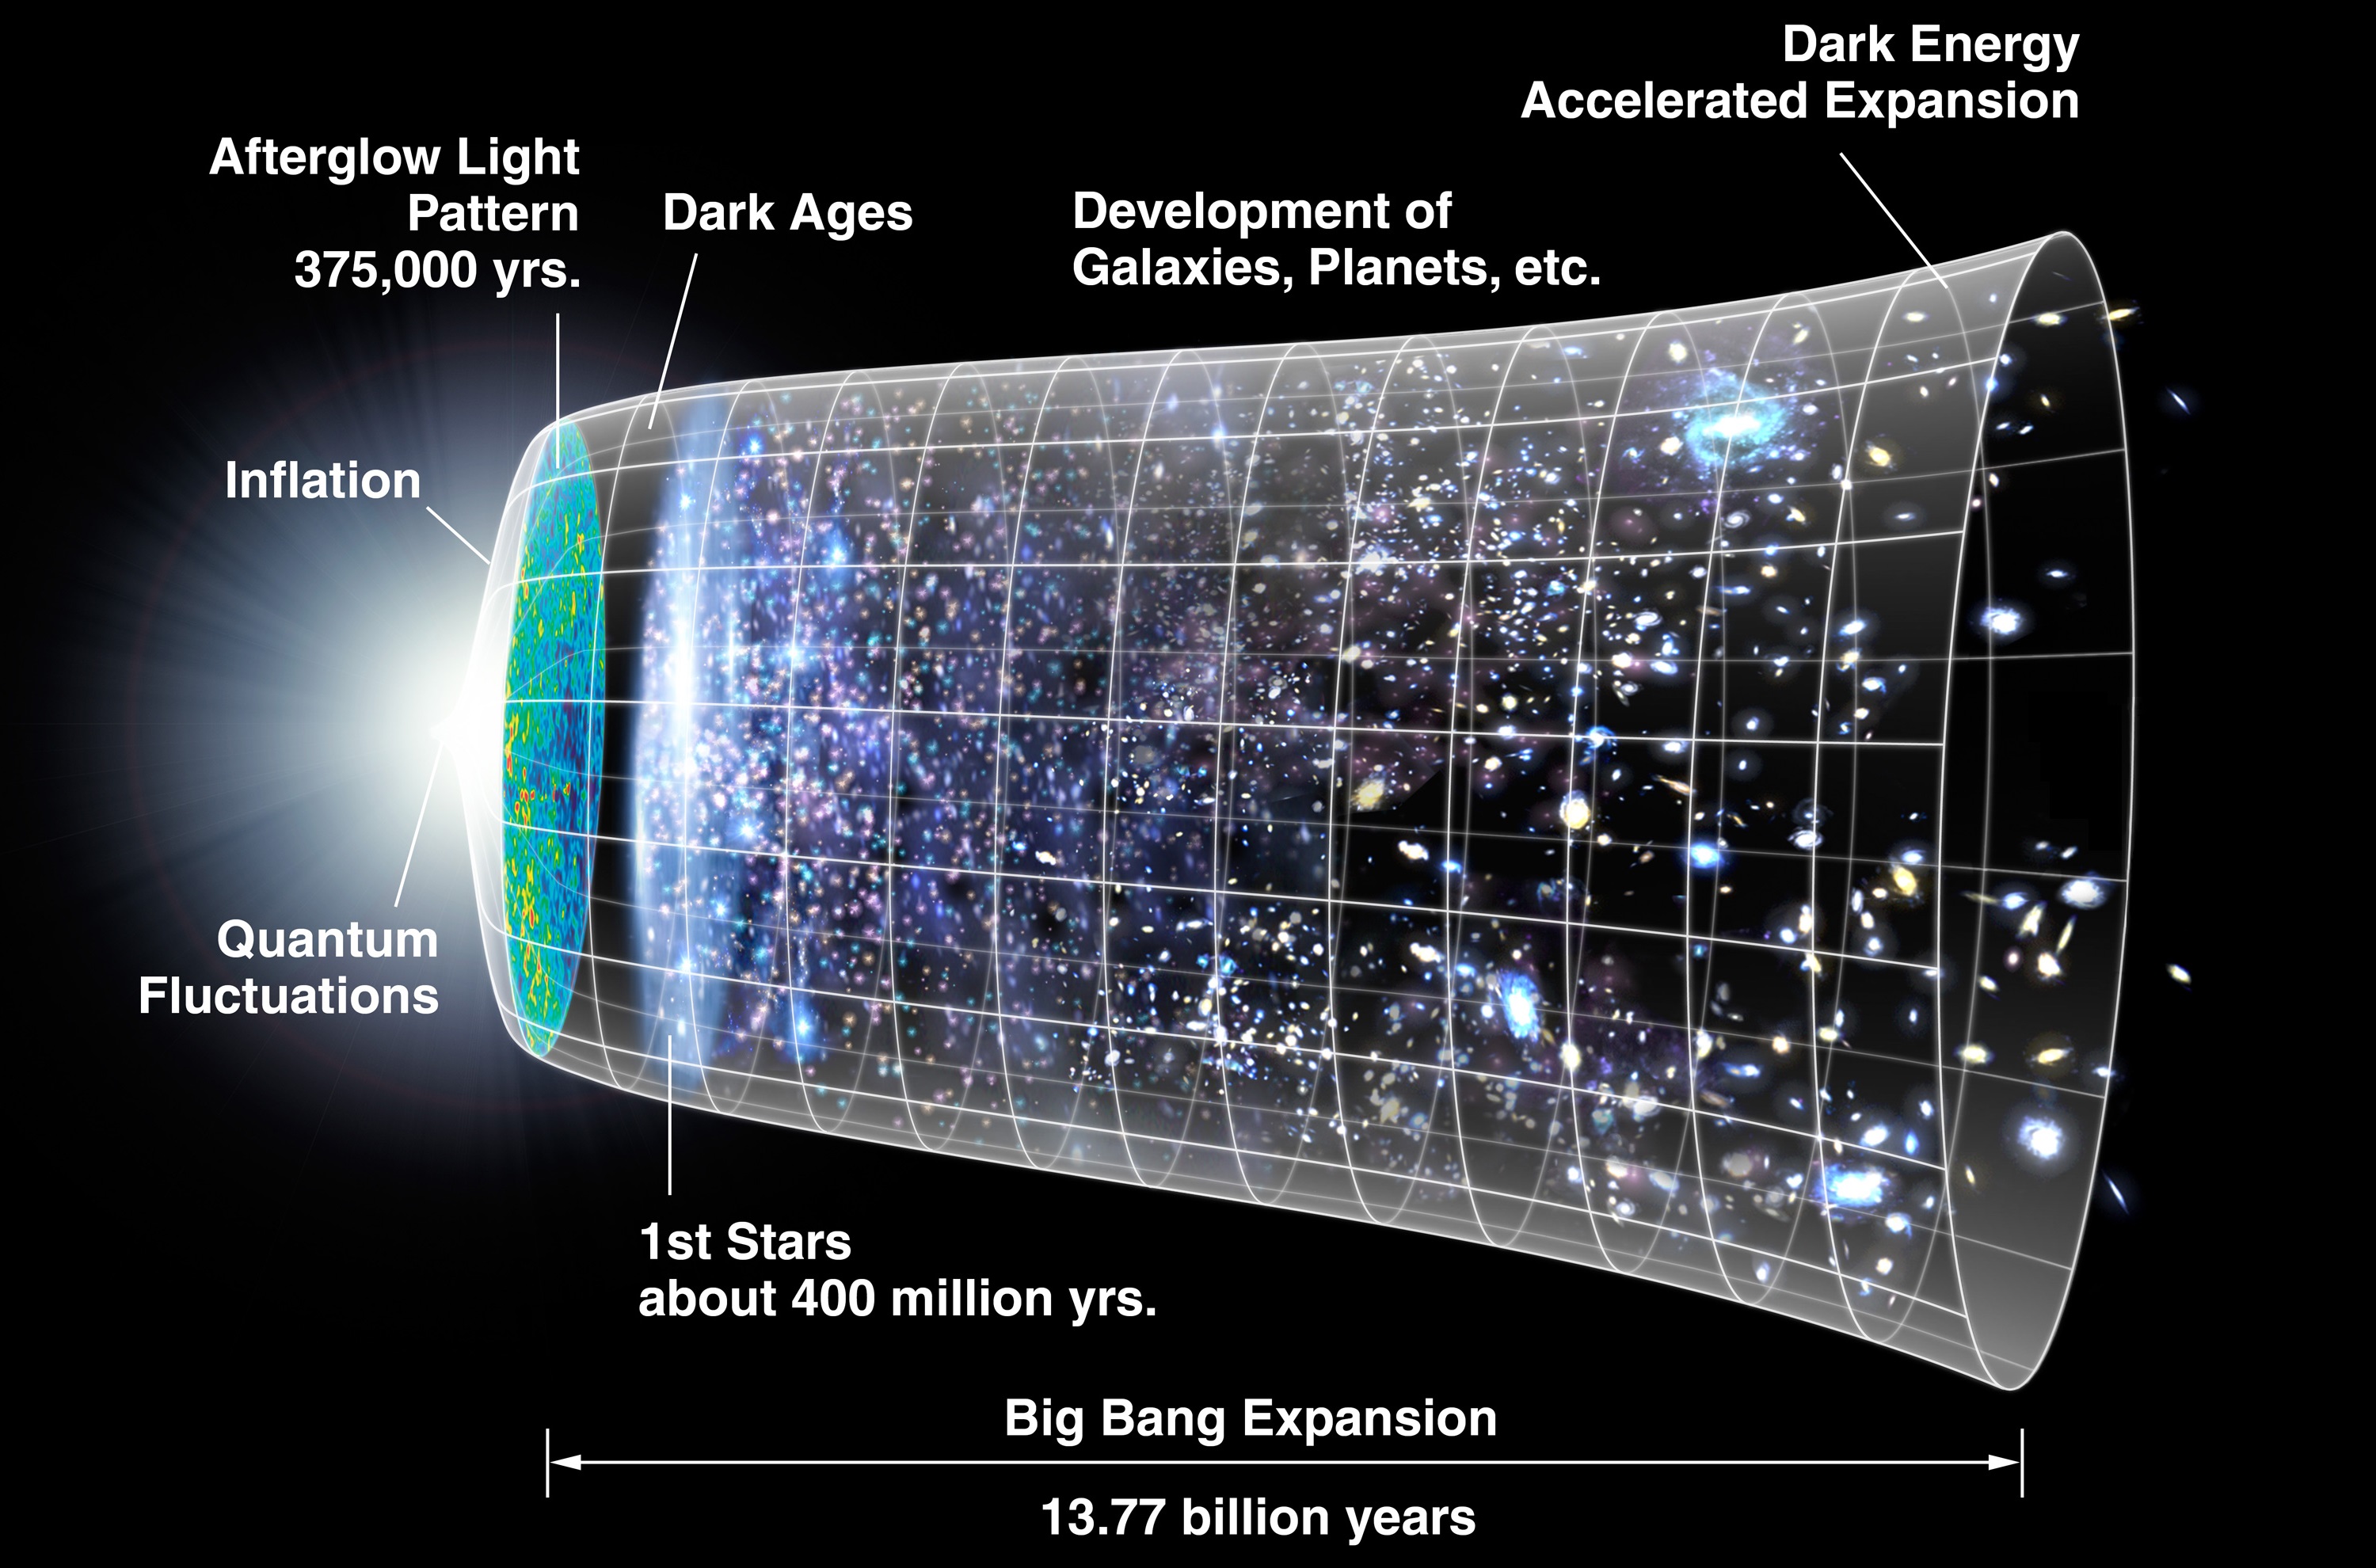
Help illuminate the mystery of dark energy - the unknown force that is driving galaxies away from one another! 

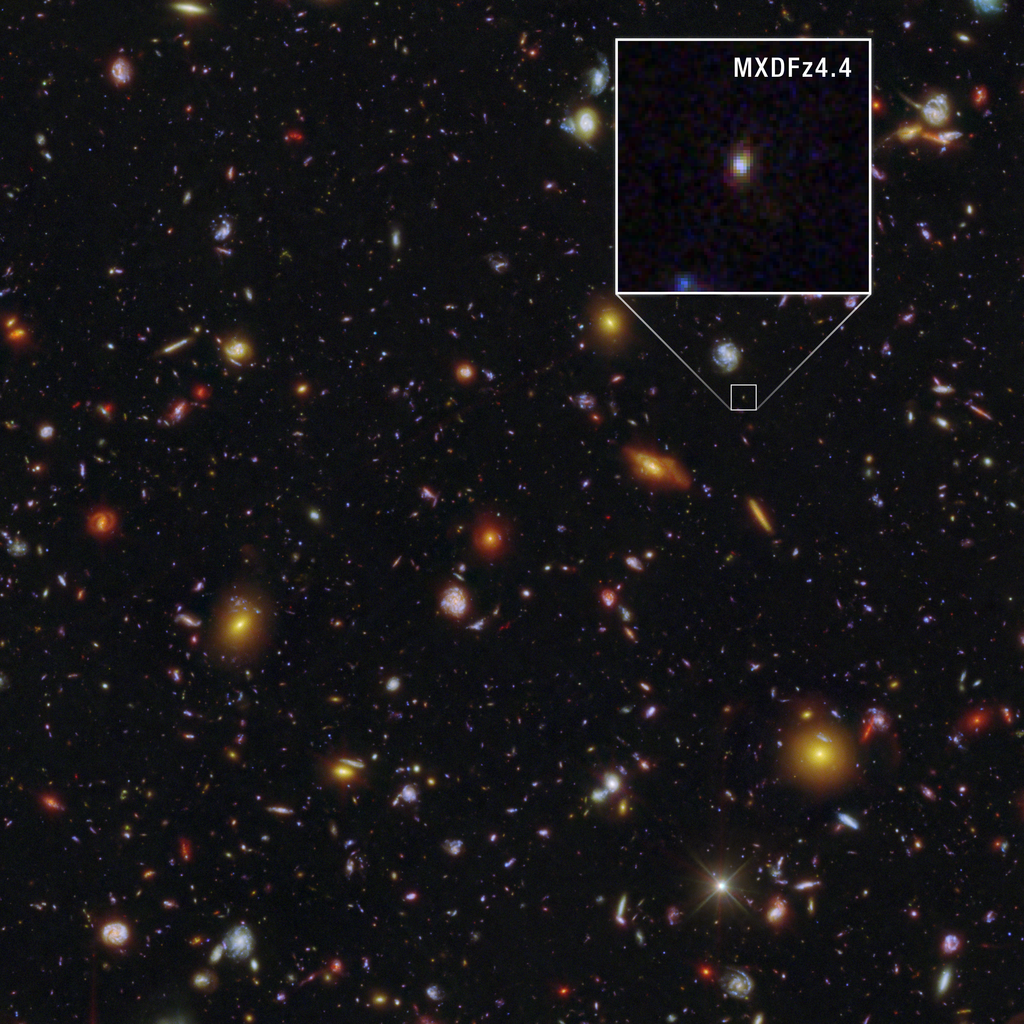
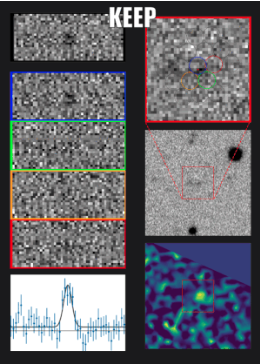
Dark Energy Explorers are creating the largest and most detailed map yet of galaxies in the early universe. They need your help to identify the faint, ancient, distant galaxies they want to include on the map. Your eyes are better for this task than any software yet developed! The resulting map will be compared to nearby galaxies to reveal how dark energy has influenced our universe through time.

Go to Project Website

ages

18 and up

division

Astrophysics

where

Online

launched

2023

What you'll do

  • Learn how to identify distant galaxies and black holes in spectral lines and images collected by the giant Hobby-Eberly telescope.
  • Connect with other dark energy enthusiasts through the project Talk forum.

Requirements

  • Time to get started: 5-15 minutes to complete the tutorial.
  • Equipment: Web-connected device.
  • Knowledge: None. In project tutorial provides all instruction needed.

Get started!

  1. Visit the project website
  2. Click on the “Classify” tab in the upper right.
  3. Complete the project tutorial.
  4. Start looking for ancient galaxies and black holes!

Learn More

To learn more about the science, visit the project’s About page. You can also visit the Hobby-Eberle Telescope Experiment website to learn more about dark energy and the efforts underway to understand it.

The Dark Energy Explorers YouTube Channel offers even more information from the science team: https://www.youtube.com/@DarkEnergyExplorers.

On a black field a cylinder outlined in a white grid expands from a bright white point on the left to a wide circle on the right. Held within this cylinder are the evolving contents of the universe. From left to right the stages of the universe are depicted and labeled: Inflation, the afterglow of the Big Bang, the Dark Ages, star formation, development of planets and galaxies.
A representation of how the universe evolved over 13.77 billion years. The far left depicts the earliest moment we can now probe, when a period of "inflation" produced a burst of exponential growth in the universe. (Size is depicted by the vertical extent of the grid in this graphic.) For the next several billion years, the expansion of the universe gradually slowed as gravity pulled together the matter in the universe. More recently, the expansion has begun to speed up again thanks to the repulsive effects of dark energy. Visit https://hetdex.org/what-is-dark-energy/ for a more detailed explanation of this graphic.
Credit: NASA/WMAP Science Team
The words Dark Energy Explorers appear in white text on a circular background image of deep space full of pale yellow, blue, and orange galaxies - bright clusters of tiny dots of light. The galaxies appear smeared or elongated by gravitational lensing. In other words, they appear stretched around the outside curve of this image.
On a black field we see six representations of data. Grainy black-and-white images appear at top and left, containing subtle dark patches. The spectrum at bottom left is a graph on white, with a series of dots with vertical deviation bars marching across the graph and a distinct hump in the middle. The pattern of dots closely tracks a black line. The middle image on the right is also a grainy black-and-white image with some fuzzy black blobs, though the pixels are far smaller than the other images and the black blobs are more distinct. A red box in the center of this image is traced upwards to a zoomed-in view of the same area. In the bottom right, we see another square, this one full of blue blotches surrounded by greens and less numerous yellow splotches, including one especially bright yellow spot right in the middle.
This screenshot from the project interface shows the different kinds of data participants evaluate as they look for galaxies. The boxes outlined in black, blue, green, yellow, and orange (upper left) show images from the telescope. A “spectrum” is shown in the bottom left panel, a plot showing how bright the galaxy candidate is across different wavelengths. If the blue dots and black lines of the spectrum overlap, the candidate may be a real galaxy. A round and bright yellow dot in the bottom right image is also a good sign of a real galaxy.
Credit: Dark Energy Explorers

Get to know the Dark Energy Explorers!

Photo of person smiling with glasses and long grey curly hair

Karl Gebhardt

Professor and Research Scientist

Portrait photo of smiling blond woman, her chin is resting on her hand.

Keely Finkelstein

Professor and Research Scientist

Portrait photo of woman with long brown hair

Erin Cooper

Research Scientist

Portrait photo of a young smiling woman with long brown hair

Lindsay House

Graduate Student Lead

Portrait photo of a man wearing a dark brimmed hat and glasses.

Dustin Davis

Graduate Student

Portrait photo of a smiling bearded man with dark hair and glasses

Jose Saucedo

Undergraduate Researcher

portrait photo of a young man with dark hair and a dark tshirt

Mike Truong

Undergraduate Researcher

Portrait photo of a young man with dark hair

Isaiah Pipkin

Undergraduate Researcher