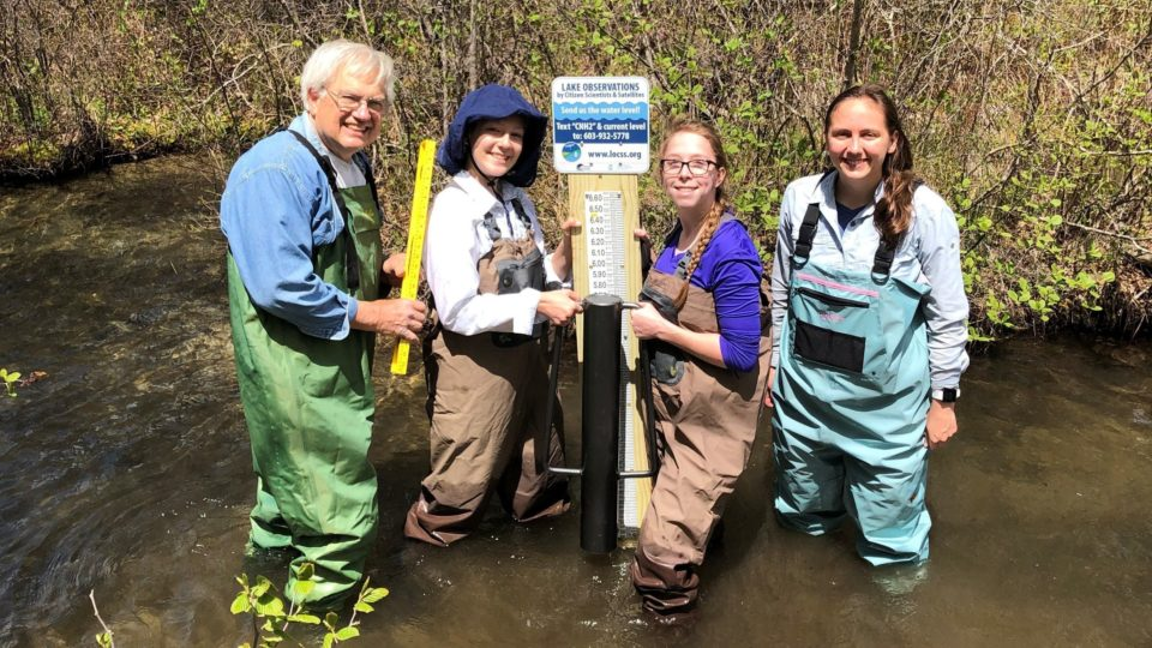


Lake Observations by Citizen Scientists and Satellites
How does water move in and out of lakes and the land around them? Does precipitation, groundwater level or evaporation affect the water level the most? How can we better protect freshwater in lakes for future generations? This project combines direct observations of lake heights by volunteers with satellite maps. These measurements of lake heights and surface areas reveal how their water volumes are changing, a key step to answering those questions.
project task
Collecting data
division
Earth
where
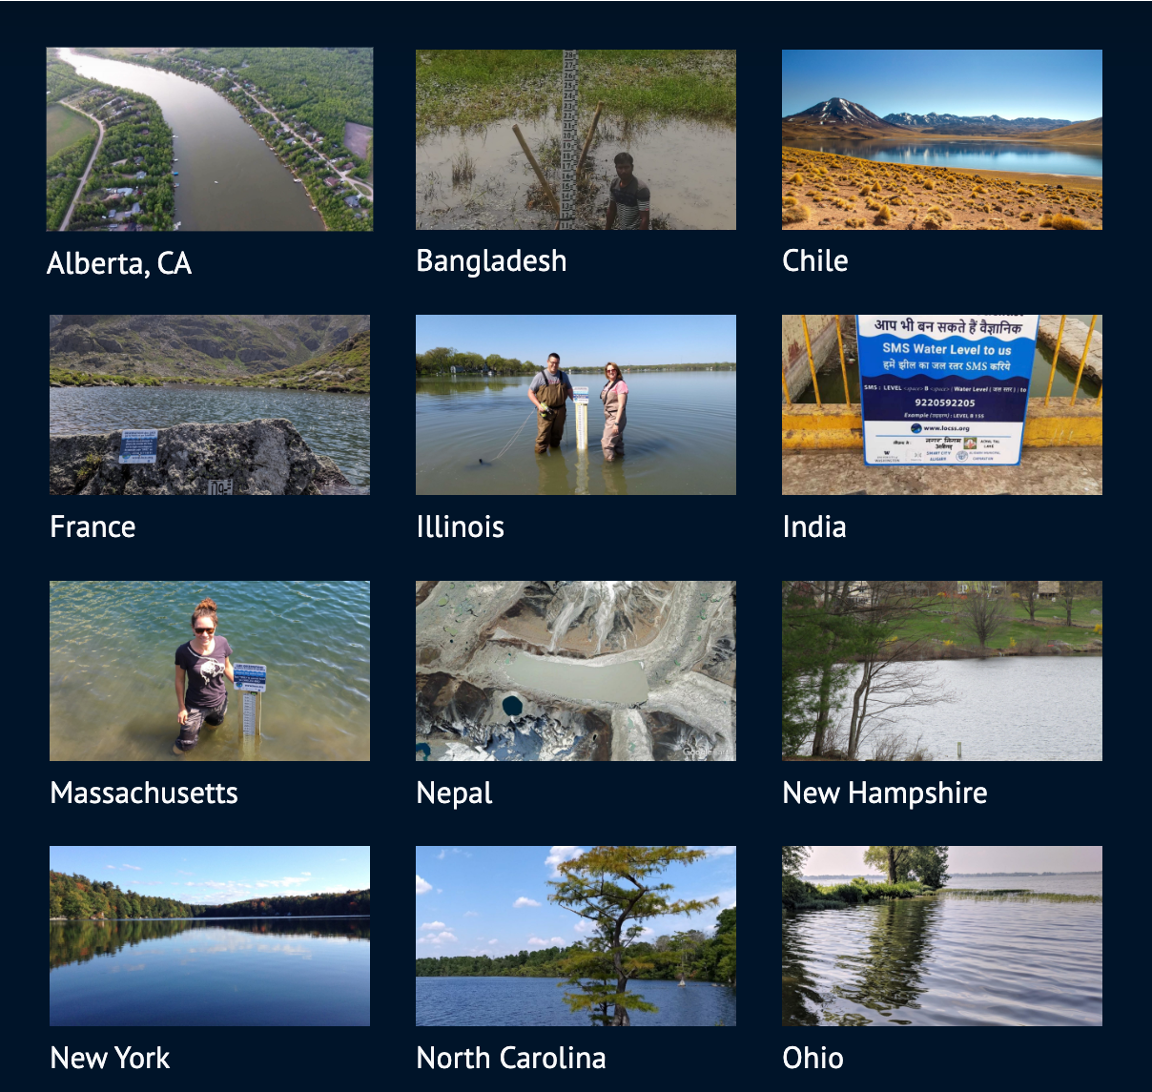
Alberta, Bangladesh, Chile, Colombia, France, India, Illinois, Massachusetts, New Hampshire, New York, Nepal, North Carolina, Pakistan or Washington (as of September 2023).
Launched
2020
What you’ll do
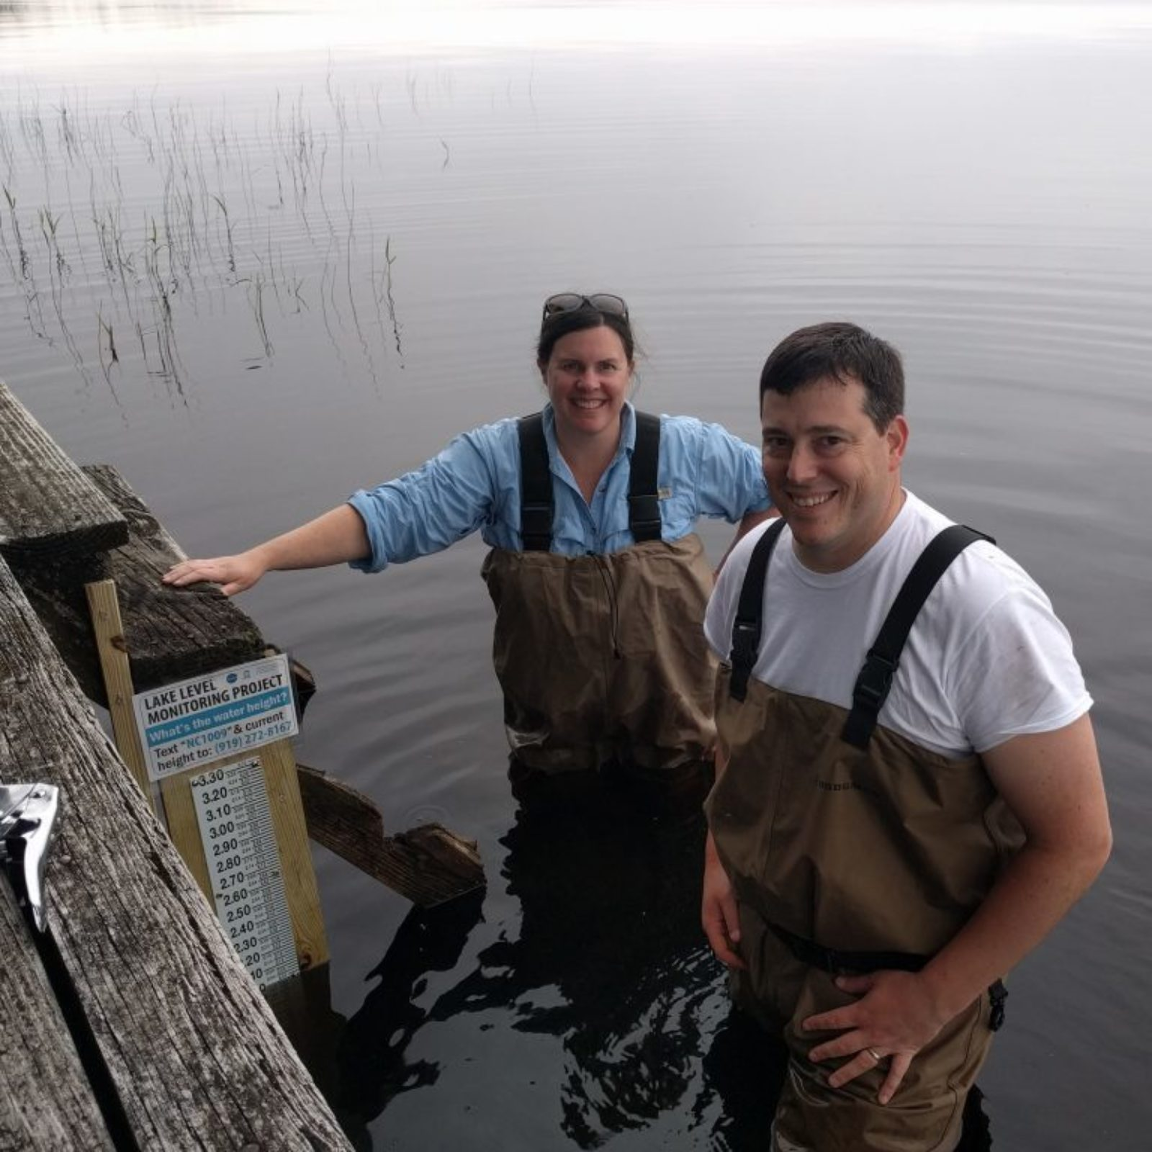
- Visit a lake where a LOCSS gauge is installed (View the latest list of lakes).
- Read the water level on the gauge, and send a text message to report your reading.
Requirements
- Time: Minutes to report current lake level
- Equipment:
- Cellphone
- Binoculars (site-dependent)
- Knowledge: None. Instructional video tells you all you need to know.
Get started!
- Go to the project website.
- Watch our short instructional video to learn how to report lake levels or read our written instructions.
- Interested in installing a gauge in your lake? Learn how to do this.
- Nominate your lake for inclusion in our project by filling out this form.
Learn More
Join the LOCSS newsletter list and follow our blog to learn more about our progress.
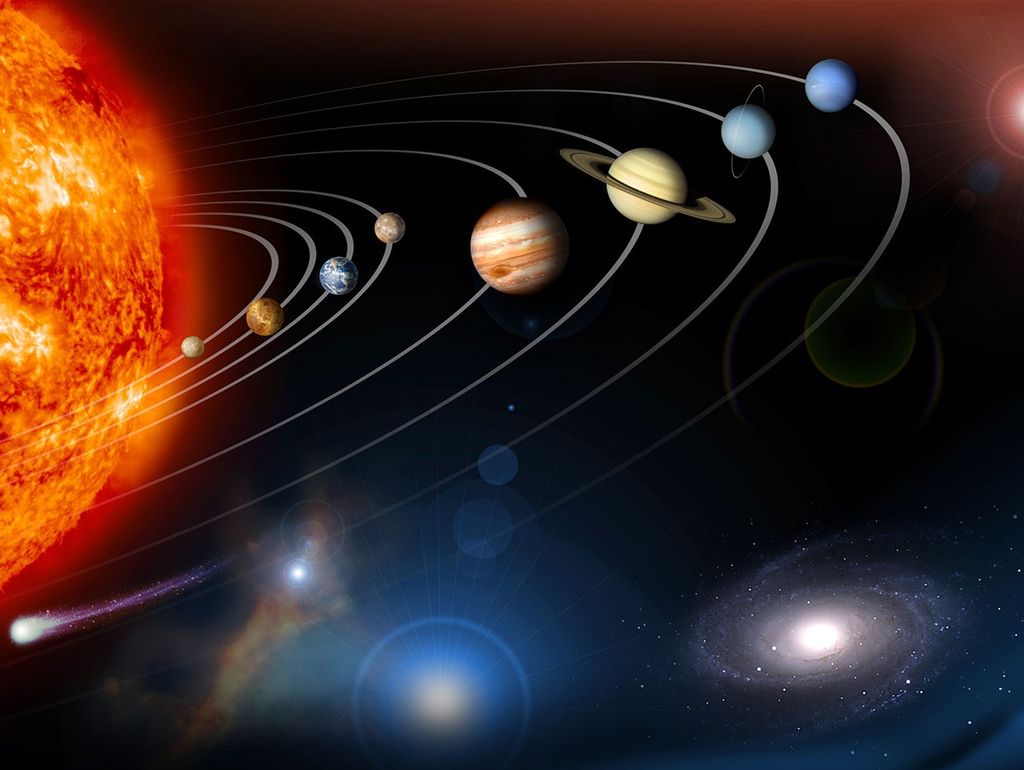
Visit the Surface Water and Ocean Topography mission website to learn more about the satellite data used by the project.
Follow the LOCSS project on Twitter @lakeobservation!
Get to know the people of Lake Observations by Citizen Scientists and Satellites!