


![Request for Information – Potential [Placeholder for Prize]](https://assets.science.nasa.gov/dynamicimage/assets/science/psd/solar/2023/09/s/solarsystem_0.jpg?w=1024)


A Year in Review: New Earth Discoveries in 2024
Each year, the Earth Science Division’s Research and Analysis Program combines space, airborne, and ground-based observations with data processing from high-tech computer models and algorithms to uncover new things about the Earth. Explore some of our top discoveries of 2024.
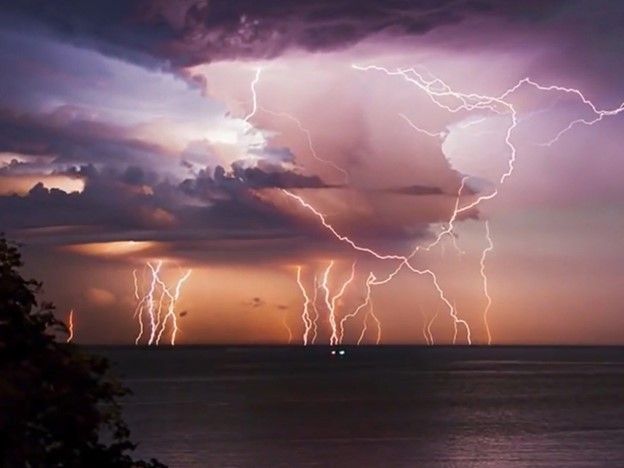
Field Campaign and New Discoveries about Gamma-Ray Radiation in Thunderstorms (WAD)
The Airborne Lightning Observatory for Fly’s Eye Geostationary Lightning Mapper (GLM) Simulator and Terrestrial Gamma-Ray Flashes (ALOFT) campaign is a collaboration between NASA and University of Bergen, Norway. Held in July 2023, focused on lightning off the US Gulf Coast. ALOFT data were used to validate observations from the International Space Station (ISS) Lightning Imaging Sensor (LIS) and the GLM on the NOAA Geostationary Operational Environmental Satellite (GOES)-16.
The ALOFT campaign made major discoveries about the abundance of high energy emissions known as gamma-ray glows using the NASA ER-2 plane. Glows found by ALOFT researchers were ubiquitous and highly dynamic within tropical thunderclouds, covering areas the size of thunderstorm complexes and lasting for hours in aggregate. Originally thought to be up to 10,000 times rarer than lightning, terrestrial gamma-ray flashes (TGFs) instead were detected on most ALOFT science flights and appear to be related to the presence of low-level, longer-lived glows. ALOFT also discovered a new type of TGF-like event, called a Flickering Gamma-ray flash (FGF). This discovery could be the missing link between the gamma-ray glows and conventional TGFs, of which the absence has puzzled the atmospheric electricity community for decades.
Associated Publications: Marisaldi, M., et al., 2024: Highly dynamic gamma-ray emissions are common in tropical thunderclouds. Nature, 634, 57-60, https://doi.org/10.1038/s41586-024-07936-6
Østgaard, N., and coauthors, 2024: Flickering gamma flashes – the missing link between gamma glows and terrestrial gamma-ray flashes. Nature, 634, 53-56, https://doi.org/10.1038/s41586-024-07893-0
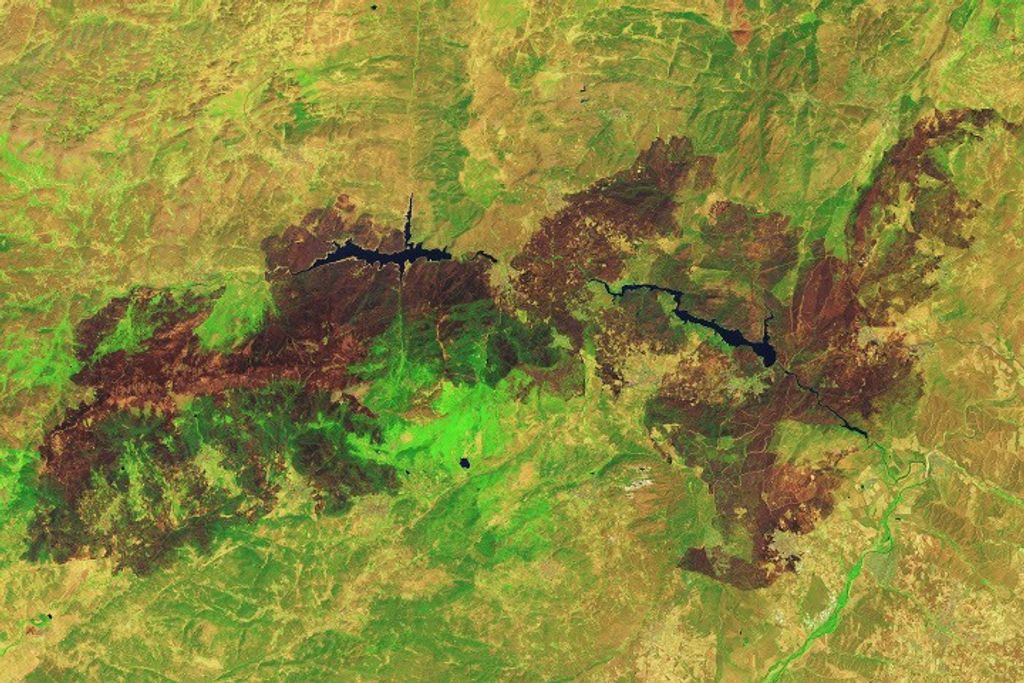
GRACE reveals exceptional snow years can’t offset water management and aridification effects in the Great Basin (WEC)
The GRACE (a collaboration between NASA and the German space agency (DLR)) and GRACE-FO (a partnership between NASA and the German Research Centre for Geosciences (GFZ)) missions provide measurements of Earth’s gravity field, which can be used to derive estimates of monthly terrestrial water storage (TWS) change. Terrestrial water storage is the sum of soil moisture, groundwater, snow, ice, river and lake water, and vegetation water content. While point measurements of groundwater table depth indicate changes in local aquifer levels, GRACE provides a valuable regional measure of integrated above- and below-ground water volume losses or gains. For the U.S. Great Basin watershed, which spans most of Nevada, and parts of Utah, Idaho, Wyoming, Oregon and California, seasonal TWS variations are mostly attributable to snow. Peaks in the GRACE TWS timeseries for the basin correspond with above normal snowfall years in 2010-2011, 2016-2017, and 2018-2019, as well as record snowfall in 2022-2023. However, Hall and co-authors point out that despite these recent notable snow years, the basin’s long-term downward TWS trend remains intact, dating back to the start of the GRACE record in 2002. Their analysis of GRACE data reveals a total loss of 68.7 km3 in TWS during the period from 2002–2023. That amounts to two-thirds as much water as the entire state of California uses in a year. The team links the continuing decline in Great Basin TWS to increased evapotranspiration, increased groundwater withdrawals, increased streamflow diversions, and decreased infiltration and groundwater recharge.
Associated Publication: Hall, D. K., Loomis, B. D., DiGirolamo, N. E., & Forman, B. A. (2024). Snowfall replenishes groundwater loss in the Great Basin of the western United States, but cannot compensate for increasing aridification. Geophysical Research Letters, 51, e2023GL107913. https://doi.org/10.1029/2023GL107913
Forecasting the likelihood of catastrophic landslides (ESI)
Several environmental factors including precipitation, topography, and flow composition can influence the stability of a landslide and can be used to forecast the location and likelihood of a landslide event. Here Interferometric Synthetic Aperture Radar (InSAR) and pixel tracking of PlanetScope optical data are used together to characterize the precursory motion of six active landslides in California, one catastrophic landslide and five slow-moving landslides in similar environments to better understand how slow movement can translate into catastrophic failure. The slow, progressive, accelerating deformation that precedes catastrophic landslides differs from the persistent motion of slow-moving landslides. This differentiation can help researchers more clearly determine if slow moving landslide has the potential for a larger event. These findings provide further evidence that satellite remote sensing data can contribute to landslide early warning systems and can also be used to better understand the impacts of climate change on landslide hazards.
Associated Publication: Li, X., A. Handwerger, G. Peltzer, and E. Fielding (2024), Exploring the behaviors of initiated progressive failure and slow‐moving landslides in Los Angeles using satellite InSAR and pixel offset tracking, Geophys. Res. Lett., 51, e2024GL108267. https://doi.org/10.1029/2024GL108267
Plant responses to changing rainfall frequency and intensity. (CCE)
To understand plant responses to shifts in rainfall patterns caused by climate change across different ecosystems, an integrated approach incorporating evidence from field experiments, satellite data, and models was used. Plant responses to altered rainfall patterns were found to be highly variable and depend significantly on the type of ecosystem. In dry ecosystems, plants tend to respond positively to fewer, larger rainfall events due to increased soil moisture availability, while in wet ecosystems, plants often exhibit negative responses due to waterlogging and other stressors. These results underscore the critical role satellite data play in observing the large-scale patterns and trends that are not easily captured through ground-based methods, enabling researchers to analyze plant responses to changing rainfall patterns across diverse and often remote ecosystems.
Associated Publication: Feldman, A. F., Feng, X., Felton, A. J., Konings, A. G., Knapp, A. K., Biederman, J. A., & Poulter, B. (2024b). Plant responses to changing rainfall frequency and intensity. Nature Reviews Earth & Environment. https://doi.org/10.1038/s43017-024-00534-0
Radiative effects of aerosols(AC)
Human activities modify the composition of the atmosphere, which then can induce radiative forcings that drive climate change. One example is the cooling effect of anthropogenic aerosols that has partially offset the warming effect of anthropogenic greenhouse gases. In 2020 fuel regulations abruptly reduced the emission of sulfur dioxide from international shipping by about 80%. Specifically, the new fuel regulations led to an estimated radiative forcing of +0.2 ± 0.11 Wm−2 averaged over the global ocean. This could lead to a doubling of the warming rate in the 2020s as compared to the rate since 1980 but with strong spatiotemporal heterogeneity. The warming effect is consistent with the recent observed strong warming in 2023 and expected to make the 2020s, as a whole, anomalously warm. The forcing is equivalent in magnitude to 80% of the measured increase in planetary heat uptake since 2020. The radiative forcing also has strong hemispheric contrast, which has important implications for precipitation pattern changes.
Associated Publication: Yuan, T., Song, H., Oreopoulos, L. et al. (2024). Abrupt reduction in shipping emission as an inadvertent geoengineering termination shock produces substantial radiative warming, Commun. Earth Environ., 5, 281 (2024). https://doi.org/10.1038/s43247-024-01442-3
Impacts of New Satellite Instruments on Weather Prediction (WAD)
NOAA and NASA are currently planning the GeoXO mission as a follow-on to the GOES program. The GeoXO satellite system will include a hyperspectral infrared sounding instrument, the GeoXO Sounder (GXS). This instrument will provide real-time information about the vertical distribution of atmospheric moisture, winds, and temperature. As part of the mission development process NASA has performed several Observing System Simulation Experiments (OSSEs) to investigate the potential performance of proposed new GXS instrument on numerical weather prediction. In the OSSE adding GXS produced better forecasts of simulated tropical cyclones compared to control runs without additional data. The addition of a geostationary hyperspectral IR sounder over the central US was the single most important source for regional forecast improvement over the continental United States (CONUS) when compared to other sources of meteorological satellite data. At a global scale, improvements in numerical weather prediction depended on a global ring of hyoerspectral IR sounder instruments.
McGrath-Spangler, E. L., N. C. Privé, B. M. Karpowicz, I. Moradi, and A. K. Heidinger, 2024: Using OSSEs to evaluate GXS impact in the context of international coordination. J. Atmos. Ocean. Technol., 41, 261-278, https://doi.org/10.1175/JTECH-D-23-0141.1.
Salinity of Coastal Waters as a Bellwether for Global Water Cycle Changes (CVC)
Extensive monitoring of the global water cycle has been done from both the land and open ocean perspective. However, the coastal ocean offers an extremely set of signals of changes in the global water cycle. An obstacle to monitoring the coastal oceans is that the observational capability for river discharge has traditionally been reliant upon a sparse and aging in situ observing network, with very few river gauges. To overcome this obstacle this study used the multi-mission Optimally Interpolated sea surface salinity data set which is built on data from three satellite missions: the NASA Aquarius/SAC-D, SMAP and ESA SMOS, combined with precipitation data from the Global Precipitation Mission (GPM) constellation as well as a published global river discharge dataset based on multiple satellite observations.
These results show that satellite sea surface salinity year to year variations near the coast are strongly correlated with global water cycle variability driven by El Niño Southern Oscillation (ENSO) via modulation of precipitation on land and subsequent river runoff. As the climate warms, the global water cycle is expected to change, with complex impacts for land hydrology and its influence on the coastal ocean. This makes the coastal ocean a prime candidate for monitoring signals of global change. Aggregated global coastal sea surface salinity observations could be used as a proxy for detection of changes in the large-scale cycling of water between the oceans and continents that are expected.
Associated Publication: Fournier, S., Reager, J. T., Chandanpurkar, H. A., Pascolini‐Campbell, M., & Jarugula, S. (2023). The Salinity of Coastal Waters as a Bellwether for Global Water Cycle Changes. In Geophysical Research Letters (Vol. 50, Issue 24). American Geophysical Union (AGU). https://doi.org/10.1029/2023gl106684
A Foundational Study for Future NISAR Snow Water Equivalent Retrievals (WEC)
Seasonal snow monitoring and modeling, including of the timing of snow melt is critically important for water resource managers in mountainous, snow-dominated watersheds. Estimates of the amount of water stored in snow, or its snow water equivalent (SWE), inform our forecasts of streamflow and regional flood and drought. NASA has long supported satellite remote sensing of fractional snow cover via optical remote sensing instruments including Landsat (1972-pres), AVHRR (1978-pres), MODIS (2000-pres), and VIIRS (2011-pres). Since 2003, NASA ICESat and ICESat-2 have supported global lidar-based snow depth estimates.
However, satellite-based SWE remains an unsolved challenge. NASA’s 2017-2023 Snow Experiments (SnowEx) was designed to advance snow remote sensing theory through coordinated ground, airborne, and satellite remote sensing activities. Research using SnowEx airborne lidar, SnowEx-tasked European Space Agency Sentinel-1 data, and USDA/NRCS SNOwpack TELemetry Network (SNOTEL) data, demonstrates the feasibility of retrieving SWE from spaceborne Interferometric Synthetic Aperture Radar (InSAR). This study reports on the development and application of a new retrieval equation. At SNOTEL sites, retrieved and in situ 6-day changes in SWE were found to be highly correlated, and accurate to within 1-2 cm. Good spatial correlation between the derived SWE and airborne lidar-based snow depth is also reported. This research establishes a solid foundation for the team’s future work to develop a global SWE product from NASA-ISRO Synthetic Aperture Radar (NISAR) and ESA Radar Observing System for Europe in L-band (ROSE-L) missions expected to launch in 2025 and 2029, respectively.
Associated Publication: Oveisgharan, S., Zinke, R., Hoppinen, Z., and Marshall, H. P.: Snow water equivalent retrieval over Idaho – Part 1: Using Sentinel-1 repeat-pass interferometry, The Cryosphere, 18, 559–574, https://doi.org/10.5194/tc-18-559-2024, 2024.
Mapping geologic provinces beneath the Greenland Ice Sheet (ESI)
The Greenland Ice Sheet obscures the rocks beneath 79% of Greenland. The ice sheet's large-scale flow pattern, its discharge into the surrounding oceans and the island's response to changing ice loading are all influenced by solid-Earth boundary conditions that are obscured by the icesheet and thus difficult to constrain. By necessity, scientists have relied mostly on studying the rocks exposed along Greenland's edge to understand the island's interior geology. This study combined geophysical data from seismometers on the ground, with remote sensing observations of gravity and magnetic fields, surface topography and ice thickness from both satellites and NASA’s airborne campaign, Operation Ice Bridge, and its predecessor surveys. The result is a new map of Greenland's geology beneath the ice sheet developed by examining where those data show similar signals regarding the nature of the underlying rock, and where they could be related to mapped rock exposures. We also find evidence of some areas with geophysical expressions that are distinct from the rocks found at the island's edges.
This new map provides a much improved if still an incomplete representation of Greenland's subglacial geology, it provides a modernized framework for combined interpretation of the subglacial and solid-Earth properties of Greenland.
Associated Publication: MacGregor, J. A., Colgan, W. T., Paxman, G. J., Tinto, K. J., Csathó, B., Darbyshire, F. A., ... & Sergienko, O. V. (2024). Geologic provinces beneath the Greenland Ice Sheet constrained by geophysical data synthesis. Geophysical Research Letters, 51(8), e2023GL107357. https://doi.org/10.1029/2023GL107357
A marine heatwave changes the stabilizing effects of biodiversity in kelp forests (CCE)
Biodiversity can stabilize ecological communities, but environmental changes can disrupt this process causing both ecosystem destabilization and biodiversity loss. Changes to biodiversity–stability relationships are largely unexplored in marine ecosystems. An analysis of two decades of kelp forest biodiversity data showed changes in biodiversity, stability, and their relationships at multiple scales related to the marine heatwave in 2014-2016, the most severe one ever documented in the North Pacific Ocean. Results suggested that biodiversity plays a key role in stabilizing marine ecosystems, but the resilience of these relationships to adverse climate impacts depends on the functional identities, or the role traits, of ecological communities.
Associated Publication: Liang, M., Lamy, T., Reuman, D. C., Wang, S., Bell, T. W., Cavanaugh, K. C., & Castorani, M. C. (2024). A marine heatwave changes the stabilizing effects of biodiversity in kelp forests. Ecology, 105(5), e4288. https://doi.org/10.1002/ecy.4288
Nitrate photolysis and the photochemistry of tropospheric ozone (AC)
Tropospheric ozone is an air pollutant and a greenhouse gas whose anthropogenic production is limited principally by the supply of nitrogen oxides (NOx) from combustion. Tropospheric ozone in the northern hemisphere has been rising despite the flattening of NOx emissions in recent decades. This sustained increase could be the result of the photolysis of nitrate particles (pNO3−) which regenerates NOx. Nitrate particulate photolysis is now included in the GEOS-Chem atmospheric chemistry model, and this improves the consistency with ozone observations. Our simulations show that pNO3− concentrations have increased since the 1960s due to rising ammonia and falling SO2 emissions, augmenting the increase in ozone in the northern extratropics by about 50% which better matches the observed ozone trend. Photolysis of nitrate particles will likely continue to increase through 2050, which would drive a continued increase in ozone even as NOx emissions decrease. More work is needed to better understand the mechanism and rates of pNO3− photolysis.
Associated Publication: Shah, V., C. A. Keller, K. E. Knowland, A. Christiansen, L. Hu, H. Wang, X. Lu, B. Alexander, and D. J. Jacob (2024). Particulate nitrate photolysis as a possible driver of rising tropospheric ozone. Geophys. Res. Lett., 51, e2023GL107980. https://doi.org/10.1029/2023GL107980
Improved estimates of Greenland Ice Sheet calving from 1985 to 2022 (CVC)
Nearly every glacier in Greenland has thinned or retreated over the past few decades leading to glacier acceleration, increased rates of sea-level rise and climate impacts around the globe. More than 200,000 manually and AI-derived observations of glacier terminus positions collected from 1985 to 2022 were combined to generate a 120-m-resolution mask defining the ice-sheet extent every month for nearly four decades to better understand how calving-front retreat has affected the ice-mass balance of Greenland. Since 1985, the Greenland Ice Sheet (GrIS) has lost an area greater than 5,000 square kilometers, corresponding to more than 1,000 gigatons of ice lost to retreat. By neglecting calving-front retreat, current estimates of ice-sheet mass balance have underestimated recent mass loss from Greenland by as much as 20 %. The mass loss reported in this study has had minimal direct impact on global sea level, but is large enough to affect ocean circulation and the distribution of heat energy around the globe. On seasonal timescales, Greenland loses almost 200 square kilometers in area (roughly 60 Gt) of ice to retreat each year from a maximum extent in May to a minimum between September and October. Multidecadal retreat is highly correlated with the magnitude of seasonal advance and retreat of each glacier, meaning that variability on seasonal timescales can serve as an indicator of glacier sensitivity to longer-term climate change.
Associated Publication: Greene, C.A., Gardner, A.S., Wood, M. et al. Ubiquitous acceleration in Greenland Ice Sheet calving from 1985 to 2022. Nature 625, 523–528 (2024). https://doi.org/10.1038/s41586-023-06863-2
Multidecadal land reanalysis over High Mountain Asia showcases a pioneering multivariate land data assimilation system (WEC)
Water management decisions and natural climate variability affect water availability in High Mountain Asia (HMA), home to over two billion people. Despite their critical role in water resources management, consistent and reliable estimates of snow, soil moisture, evapotranspiration, and streamflow are unavailable for this region. To address this need, a new multi-satellite/ multi-variate land data assimilation implementation of the NASA Land Information System (LIS) was developed. This system has the unique capability to assimilate GRACE terrestrial water storage, SMAP soil moisture, MODIS leaf area index, MODIS snow cover fraction, and regional irrigation estimates simultaneously. By assimilating NASA satellite-based land surface data, the system compensates for the lack of accurate regional meteorological data. The resulting 5 km, daily resolution regional reanalysis for the period from 2003–2020 more accurately represents both seasonal streamflow variability and long-term regional declines in streamflow compared to prior modeling. The lessons learned from this regional reanalysis inform ongoing upgrades to the version of LIS implemented in NASA National and Global Land Data Assimilation Systems (NLDAS and GLDAS).
Associated Publication: Maina, F.Z., Xue, Y., Kumar, S.V. et al. Development of a multidecadal land reanalysis over High Mountain Asia. Sci Data 11, 827 (2024). https://doi.org/10.1038/s41597-024-03643-z
Impacts of oil and gas exploration and extraction on Arctic permafrost (CCE)
An analysis of the impacts of the oil and gas industry exploration and extraction on climate and land cover showed that subsurface expansion is substantial, and it is affecting Alaskan permafrost thawing. The resulting rapid thaw increases the subsurface flow of water and the release of climate warming greenhouse gases. The team used remote sensing and field observations to provide a first-order comparison of the direct impacts to the permafrost tundra from oil well pads. They studied the long-term consequences of the legacy oil pads on the warming North Slope of Alaska and confirmed that oil well pads accelerate permafrost degradation.
Associated Publication: Miner, K., Baskaran, L., Gay, B. et al. Frozen no more, a case study of Arctic permafrost impacts of oil and gas withdrawal. Sci Rep 14, 25403 (2024). https://doi.org/10.1038/s41598-024-76292-2.
Validation of satellite measurements of tropospheric trace species (AC)
As satellite programs focus more on tropospheric composition, air quality, tropospheric ozone and ozone precursors, these orbital sensors need to be validated. Most sensors are not sensitive to the surface values due to boundary layer dynamics and mixing variability. The international Network for the Detection of Atmospheric Composition Change (NDACC) includes 110 globally distributed, ground-based, remote-sensing research stations with more than 160 currently active instruments including twenty solar viewing Fourier-Transform Infrared Spectrometers (FTIR) that are distributed on all continents spanning the latitude range from 80ºS to 80ºN. The NDACC FTIR is the only network of consistent data that with the sensitivity necessary for this task. Data from the NDACC FTIR were used to validate the Cross-track Infrared Sounder (CrIS) measurements of the volatile organic compounds; methanol, ethane, ethyne and hydrogen cyanide. The validation effort here relies solely on NDACC data and is the first validation for ethyne. We expect this to continue and broaden to other species in the future and the NDACC to become increasingly important for these validation studies.
Associated Publication: Wells, K., Millet, D., Brewer, J., Payne, V., Cady-Pereira, K., Pernak, R., Kulawik, S., Vigouroux, C., Jones, N., Mahieu, E., Makarova, M., Nagahama, T., Ortega, I., Palm, M., Strong, K., Schneider, M., Smale, D., Sussmann, R., and Zhou, M. (2024). Long-term global measurements of methanol, ethene, ethyne, and HCN from the Cross-track Infrared Sounder, EGUsphere [preprint], https://doi.org/10.5194/egusphere-2024-1551
Assessing Flash Characteristics in Lightning-Initiated Wildfire Events (WAD)
Twenty-six years (1995-2020) of lightning data were paired with over 68,000 lightning-initiated wildfire (LIW) reports to understand lightning flash characteristics responsible for wildfire ignition. Cloud-to-ground (CG) lightning flashes are classified by the nature of the charge (either positive or negative) transferred from the cloud to the ground. Key results indicated that 92% of LIWs were started by negative CG lightning flashes and 57% were single stroke flashes. They also found that 62% of LIW reports did not have a positive CG flash within 10 km of the start location, contrary to the scientific literature’s suggestion that positive CG flashes are a dominant fire-starting mechanism. Nearly one-third of wildfire events were classified as holdovers, meaning one or more days elapsed between lightning occurrence and the fire report. Holdover events were found to be most common over the American southeast and Intermountain West, though this varied regionally.
Finally, the team considered lightning intensity. The peak current was not found to be a statistically significant delineator between fire starters and non–fire starters for negative CGs but was for positive CG lightning events. Overall, these results highlight the need for reassessing the role of positive CG lightning and subsequently long-continuing current in wildfires started by lightning.
Associated Publication: Schultz, C. J., P. M. Bitzer, M. Antia, J. L. Case, and C. R. Hain, 2024: Assessing flash characteristics in lightning-initiated wildfire events between 1995 and 2020 within the contiguous United States. J. Appl. Meteor. Climatol., 63, 543–551, https://doi.org/10.1175/JAMC-D-23-0166.1.
Insights into the Causes and Predictability of Atmospheric Rivers (CVC)
In late December of 2022 and the first half of January 2023, an unprecedented series of atmospheric rivers (ARs) produced near-record heavy rains and flooding over much of California. Here the NASA GEOS Atmospheric Global Climate Model and a stationary wave model were used to investigate the causes and predictability of the unprecedented series atmospheric rivers (ARs) which hit California, focusing on remote forcing regions, mechanisms, and underlying predictability of this flooding event. A persistent positive Pacific–North American (PNA)-like circulation pattern was identified as the cause the development of the ARs. The PNA -like pattern was, in turn, the result of a chain of events initiated in mid-December with the development of a Rossby wave in the northern Indian Ocean which moved into the North Pacific. The study found a fundamental lack of predictability of this type of event at seasonal time scales. Forecasts suggest that useful skill in predicting the PNA and extreme precipitation over California is limited to lead times shorter than about three weeks.
Schubert, S., Y. Chang, A. M. DeAngelis, Y.-K. Lim, N. P. Thomas, R. D. Koster, M. G. Bosilovich, A. M. Molod, A. Collow, and A. Dezfuli, 2024. Insights into the Causes and Predictability of the 2022/23 California Flooding. Journal of Climate doi.org/10.1175/JCLI-D-23-0696. https://doi.org/10.1175/JCLI-D-23-0696.1