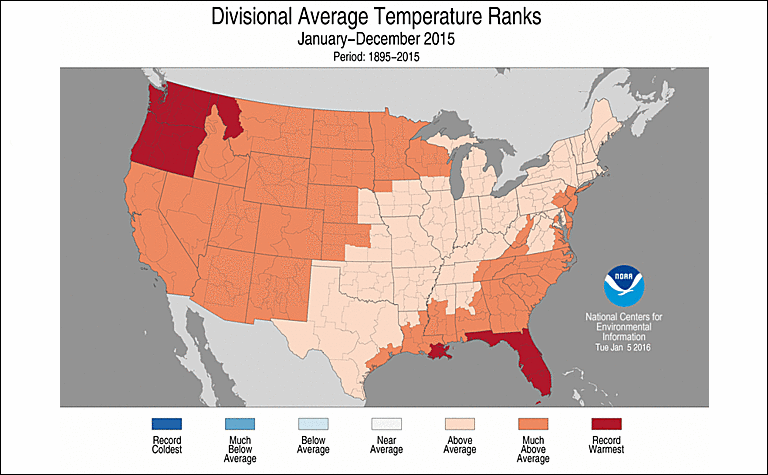
The 2015 annual average U.S. temperature was 54.4°F, 2.4°F above the 20th century average, the second warmest year on record. Only 2012 was warmer for the U.S. with an average temperature of 55.3°F. This is the 19th consecutive year the annual average temperature exceeded the 20th century average. The first part of the year was marked by extreme warmth in the West and cold in the East, but by the end of 2015, record warmth spanned the East with near-average temperatures across the West. This temperature pattern resulted in every state having an above-average annual temperature.
The average contiguous U.S. precipitation was 34.47 inches, 4.53 inches above average, and ranked as the third wettest year in the 121-year period of record. Only 1973 and 1983 were wetter. The central and southeastern U.S. was much wetter than average, while parts of the West and Northeast were drier than average. The national drought footprint shrank about 10 percent during the course of the year.
In 2015, there were 10 weather and climate disaster events in the U.S. each with losses exceeding $1 billion. These events included a drought, two floods, five severe storms, a wildfire event, and a winter storm. Overall, these resulted in the deaths of 155 people and had significant economic effects. Further cost figures on individual events in 2015 will be updated when data are finalized later this year.
This annual summary from NOAA’s National Centers for Environmental Information is part of the suite of climate services NOAA provides to government, business, academia, and the public to support informed decision making.
For extended analysis of regional temperature and precipitation patterns, as well as extreme events, please see our full report that will be released on January 13, 2016.

