Lots of forces are at work on the world’s ocean, and NASA studies them all. When it comes to sea level, NASA does much more than just measure it; they also seek to understand it. But for non-scientists, fathoming the forces that determine sea levels around the world can sometimes be a bit daunting, so here’s a little guide to some of the basics.
Let’s dive in.
NASA/JPL-Caltech
Waves in the Bathtub
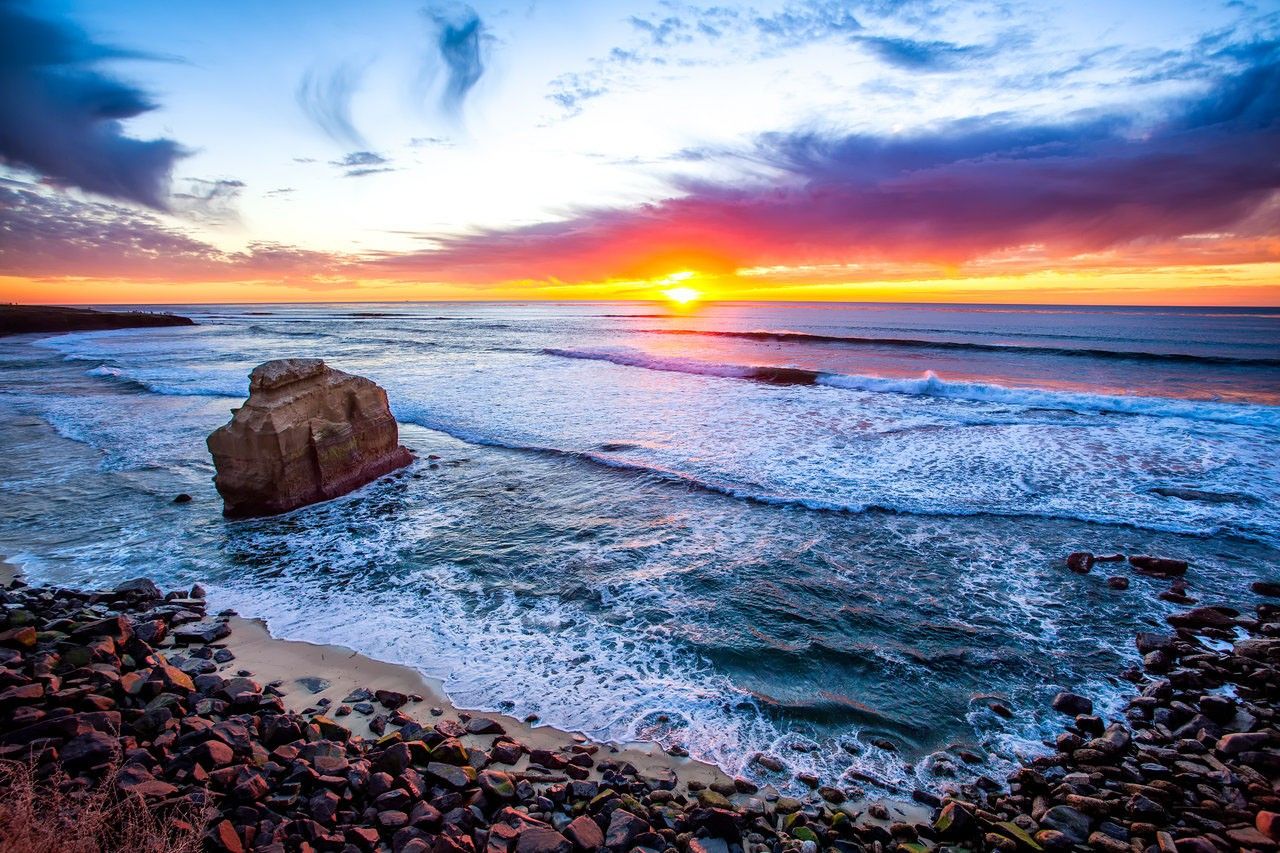
Most of the time, Earth’s ocean looks pretty darn flat to those of us here on the ground, like the water in a bathtub. If you’re on a boat at sea, the only topography you’re going to notice on the ocean is waves. Generated by the friction between wind and water, wind waves range from tiny ripples on a calm sea to storm-generated monsters that can tower more than 100 feet (30 meters) high. Some wind waves are generated locally. Others, called swells, which result from winds that blew somewhere else in the past, travel across the ocean surface.

But even in the absence of waves, it turns out the ocean isn’t really flat at all. It has hills and valleys just like land surfaces do, though they’re relatively small — up to about 2 meters (6.5 feet) high.

These small variations in ocean surface topography are influenced by many factors, including the temperature of the water, how much salt it contains (its salinity), the pressure of the atmosphere above the ocean surface, and ocean currents.
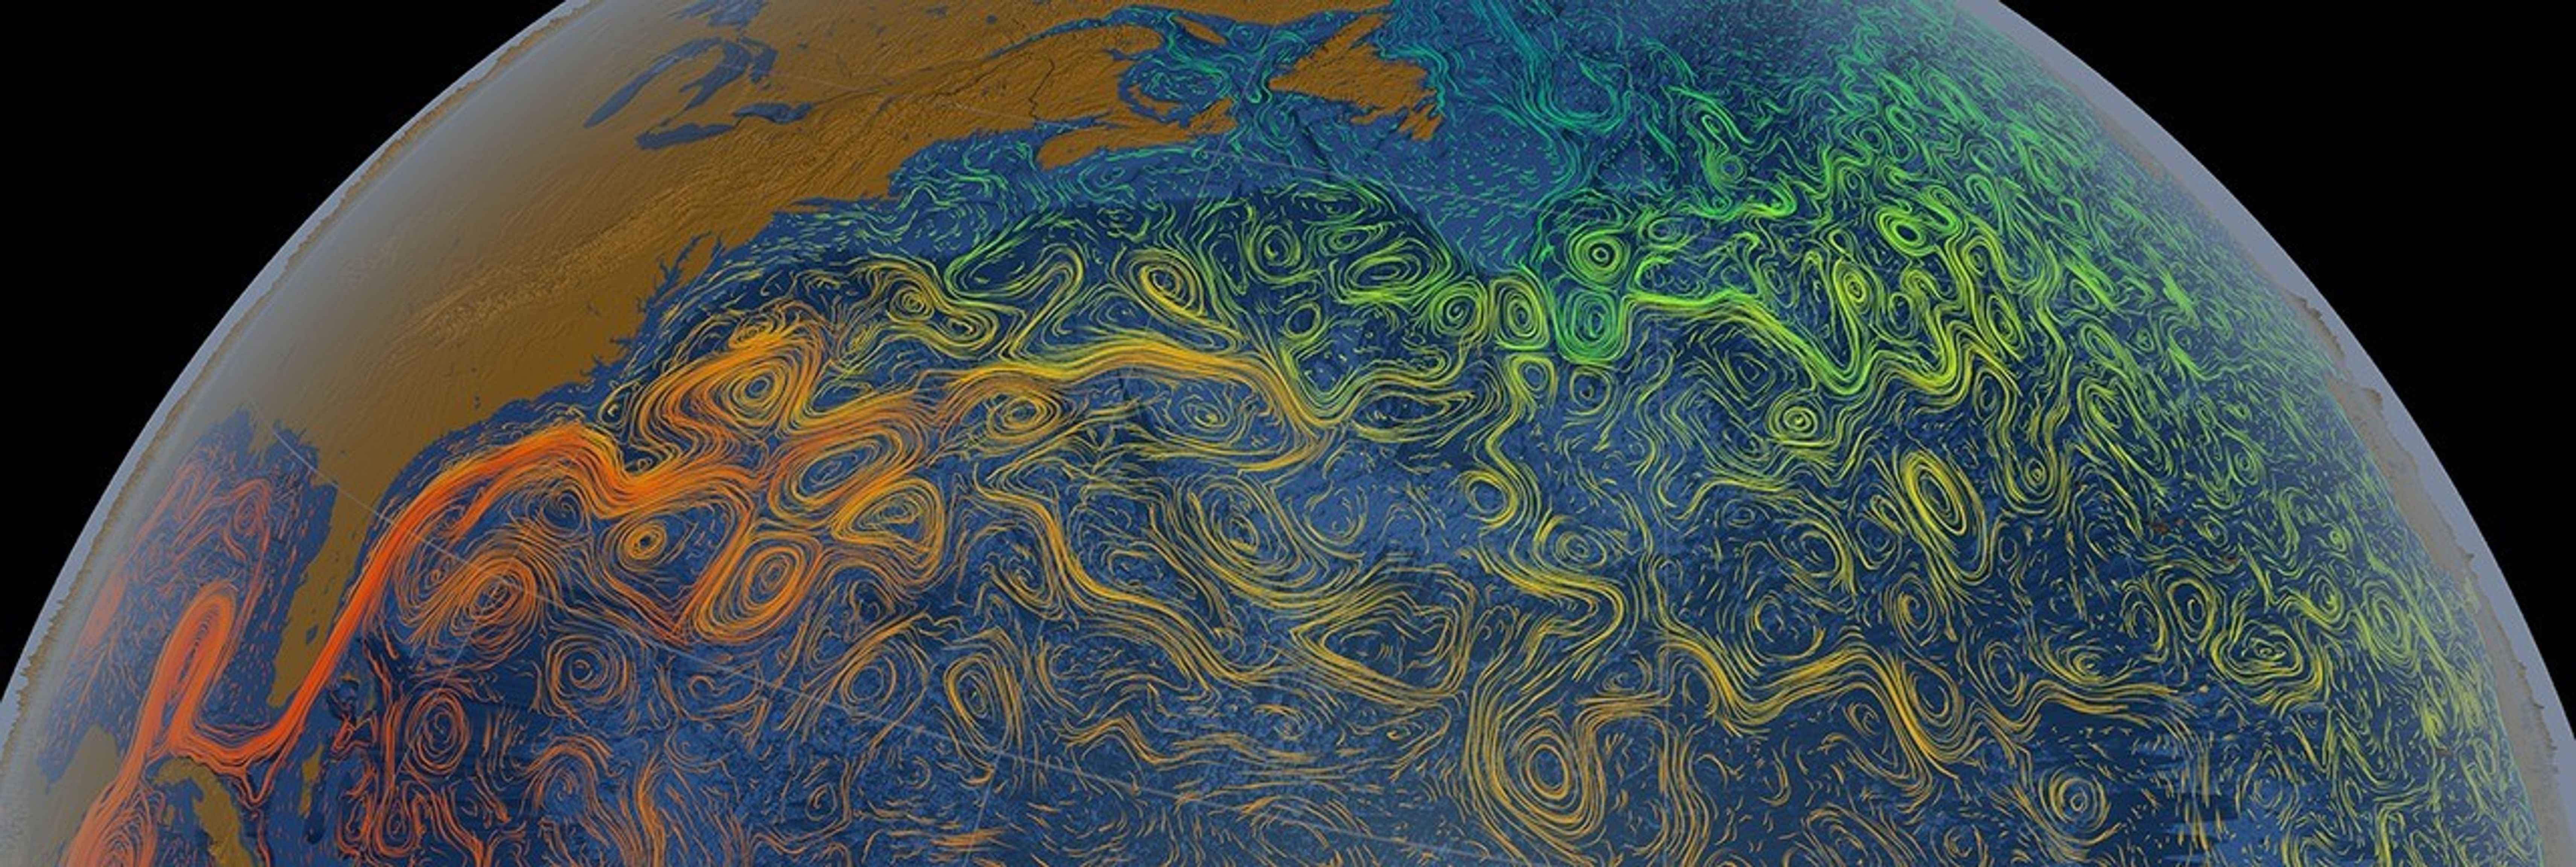
Currents move ocean waters around our planet over long distances, primarily in a horizontal direction, reshaping the ocean’s surface and causing it to tilt. They’re generated by various forces, including winds, breaking waves, ocean temperature, salinity, and a phenomenon known as the Coriolis effect (which causes water and wind to deflect to the right in the Northern Hemisphere and to the left in the Southern Hemisphere). Currents flow around the ocean’s hills and valleys, much like wind blows around areas of high and low pressure in our atmosphere.
Ocean currents happen in the open ocean and generally don’t have a big impact on coastlines, with a few major exceptions, such as the Gulf Stream in the Atlantic Ocean along the U.S. East Coast and a similar Pacific Ocean current off the coast of Japan called the Kuroshio, which transports water northward up Japan’s east coast and then due east. As our planet warms, it affects wind patterns that drive most of these currents, changing them.
While all of these factors are important drivers of ocean surface topography, there’s an even larger force working to shape the ocean: changes in Earth’s geoid. The geoid is the shape that Earth’s ocean surface would take if the only influences acting upon it were gravity and Earth’s rotation. Changes in the solid Earth affect Earth’s gravitational field, causing the height of Earth’s geoid to vary by up to 100 meters (328 feet) around the globe. For example, in places where Earth’s crust is thick and dense, the gravitational pull causes extra water to pile up. In addition, the shape of the geoid is partly determined by geologic features on the floor of the ocean, including seamounts (underwater mountains) and valleys, which pull the water due to the force of gravity.
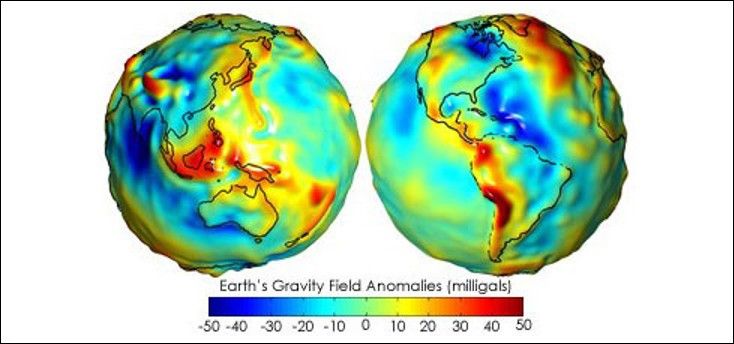
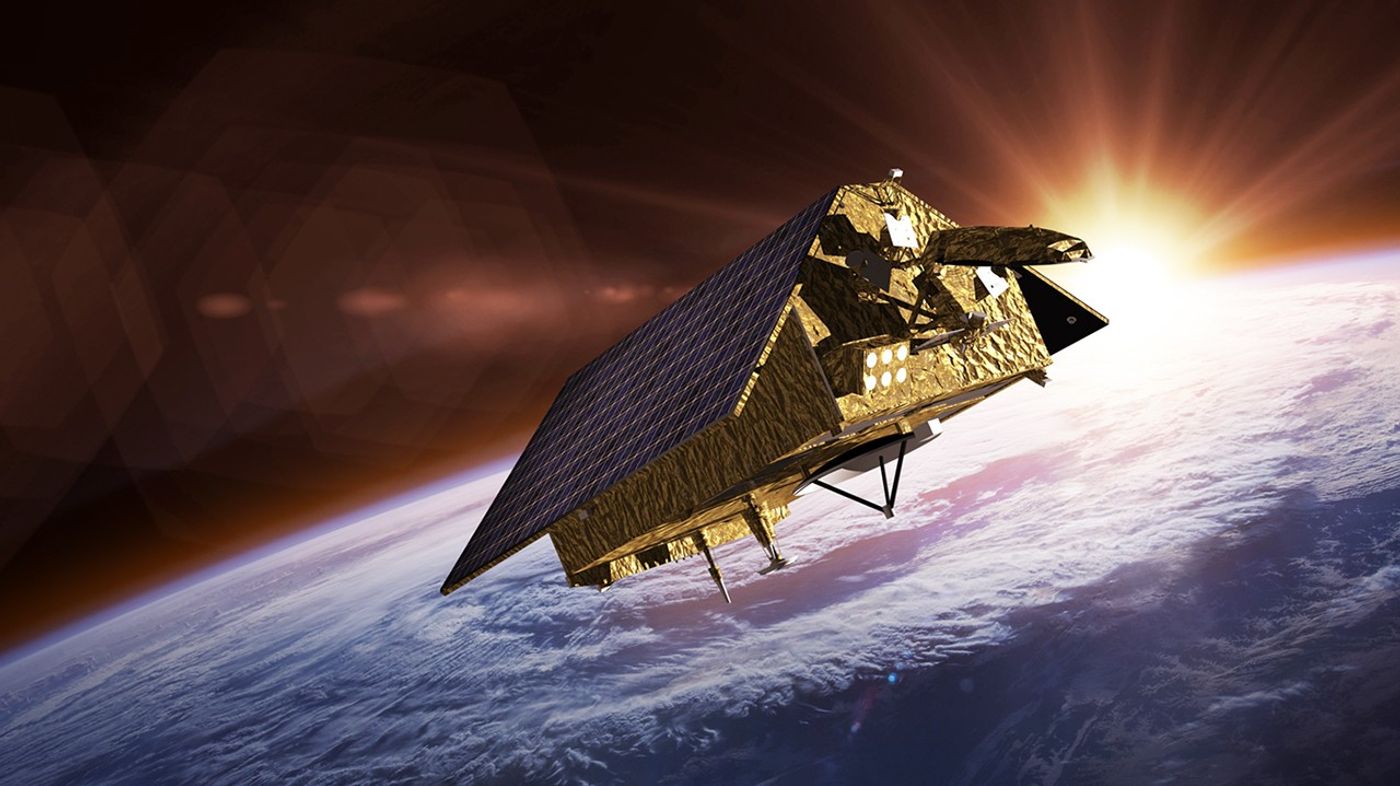
Topographic features on the open ocean can only be seen from space, by specialized instruments called altimeters that precisely measure the height of the ocean surface.
Since 1992, NASA has partnered with other U.S. and European institutions on multiple satellite missions to map ocean surface topography. They include the joint NASA/Centre National d'Etudes Spatiales (CNES) Topex/Poseidon mission, which operated from 1992 to 2005; the NASA/CNES Jason-1, which operated from 2001 to 2013; the joint NASA/CNES/National Oceanic and Atmospheric Administration (NOAA)/European Organisation for the Exploitation of Meteorological Satellites (EUMETSAT) Jason-2/Ocean Surface Topography Mission (OSTM), which operated from 2008 to 2019; and the current Jason-3, an international partnership led by NOAA with participation by NASA, CNES and EUMETSAT, launched in 2016. This November, Sentinel-6 Michael Freilich will launch to continue this long-term data set. The new mission is jointly developed by the European Space Agency (ESA), EUMETSAT, NASA and NOAA with funding support from the European Commission and support from CNES.
Measuring ocean surface topography allows us to understand ocean circulation (how our ocean stores energy from the Sun and moves it around our planet), accurately track changes in global sea level, and understand how the ocean joins forces with Earth’s atmosphere to create our weather and climate, including phenomena such as El Niño and La Niña and weather patterns such as hurricanes and other storms.
A Flattening Map

A look at a current map of trends in the nearly 30-year satellite record of global ocean surface topography reveals clear regional differences across the globe, with variations of up to 20 centimeters (8 inches) of sea level rise and fall from one place to another. But, says Josh Willis of NASA’s Jet Propulsion Laboratory in Pasadena, California, NASA’s project scientist for the Jason-2, Jason-3 and Sentinel-6 Michael Freilich missions, the map is getting flatter every year.
“Most of these 20-to-30 centimeter (8-to-12 inch) changes in sea level on the open ocean are cyclic, from natural things like El Niño and La Niña, or ocean currents speeding up or slowing down,” he said. “They've always been part of the story and always will be. But what really matters to people at the coast are long-term changes in their relative sea level – that is, the height of the ocean relative to the land. Those are caused by the overall rise due to global warming, and the movement of the land. And both of those are here to stay.”
Up next: why all sea level is "local."


